Cities with the Most Immigrants from Nepal in Texas
RELATED REPORTS & OPTIONS
Nepal
Texas
Compare Cities
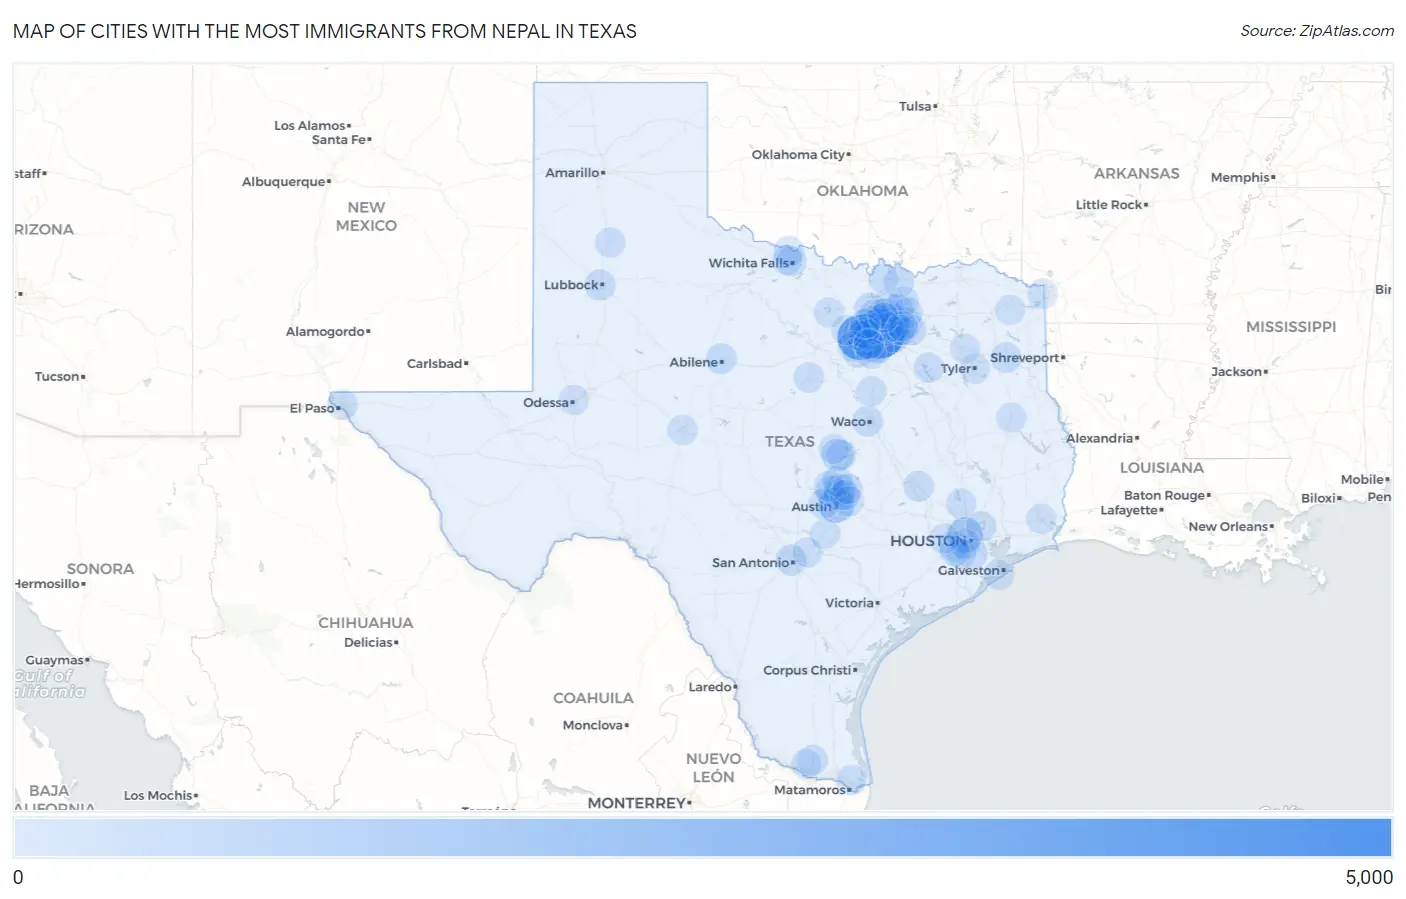
Map of Cities with the Most Immigrants from Nepal in Texas
0
5,000
Cities with the Most Immigrants from Nepal in Texas
| City | Nepal | vs State | vs National | |
| 1. | Irving | 4,994 | 27,480(18.17%)#1 | 165,080(3.03%)#2 |
| 2. | Fort Worth | 3,817 | 27,480(13.89%)#2 | 165,080(2.31%)#3 |
| 3. | Austin | 1,363 | 27,480(4.96%)#3 | 165,080(0.83%)#7 |
| 4. | Houston | 1,334 | 27,480(4.85%)#4 | 165,080(0.81%)#8 |
| 5. | Euless | 1,332 | 27,480(4.85%)#5 | 165,080(0.81%)#9 |
| 6. | Arlington | 768 | 27,480(2.79%)#6 | 165,080(0.47%)#19 |
| 7. | Killeen | 588 | 27,480(2.14%)#7 | 165,080(0.36%)#34 |
| 8. | Dallas | 483 | 27,480(1.76%)#8 | 165,080(0.29%)#48 |
| 9. | Lewisville | 470 | 27,480(1.71%)#9 | 165,080(0.28%)#50 |
| 10. | Bedford | 454 | 27,480(1.65%)#10 | 165,080(0.28%)#55 |
| 11. | Grand Prairie | 404 | 27,480(1.47%)#11 | 165,080(0.24%)#67 |
| 12. | Round Rock | 379 | 27,480(1.38%)#12 | 165,080(0.23%)#74 |
| 13. | Plano | 375 | 27,480(1.36%)#13 | 165,080(0.23%)#78 |
| 14. | Mckinney | 363 | 27,480(1.32%)#14 | 165,080(0.22%)#81 |
| 15. | Denton | 321 | 27,480(1.17%)#15 | 165,080(0.19%)#90 |
| 16. | Carrollton | 249 | 27,480(0.91%)#16 | 165,080(0.15%)#121 |
| 17. | Cedar Park | 243 | 27,480(0.88%)#17 | 165,080(0.15%)#127 |
| 18. | Abilene | 235 | 27,480(0.86%)#18 | 165,080(0.14%)#131 |
| 19. | San Antonio | 233 | 27,480(0.85%)#19 | 165,080(0.14%)#132 |
| 20. | Haltom City | 233 | 27,480(0.85%)#20 | 165,080(0.14%)#134 |
| 21. | North Richland Hills | 232 | 27,480(0.84%)#21 | 165,080(0.14%)#138 |
| 22. | Wells Branch | 220 | 27,480(0.80%)#22 | 165,080(0.13%)#148 |
| 23. | Wylie | 218 | 27,480(0.79%)#23 | 165,080(0.13%)#150 |
| 24. | Farmers Branch | 211 | 27,480(0.77%)#24 | 165,080(0.13%)#157 |
| 25. | Lubbock | 203 | 27,480(0.74%)#25 | 165,080(0.12%)#162 |
| 26. | Flower Mound | 192 | 27,480(0.70%)#26 | 165,080(0.12%)#176 |
| 27. | Longview | 191 | 27,480(0.70%)#27 | 165,080(0.12%)#178 |
| 28. | Waco | 179 | 27,480(0.65%)#28 | 165,080(0.11%)#194 |
| 29. | Frisco | 159 | 27,480(0.58%)#29 | 165,080(0.10%)#214 |
| 30. | Grapevine | 148 | 27,480(0.54%)#30 | 165,080(0.09%)#234 |
| 31. | Rockwall | 147 | 27,480(0.53%)#31 | 165,080(0.09%)#236 |
| 32. | Coppell | 127 | 27,480(0.46%)#32 | 165,080(0.08%)#261 |
| 33. | College Station | 125 | 27,480(0.45%)#33 | 165,080(0.08%)#262 |
| 34. | Edinburg | 124 | 27,480(0.45%)#34 | 165,080(0.08%)#266 |
| 35. | Princeton | 115 | 27,480(0.42%)#35 | 165,080(0.07%)#288 |
| 36. | Pearland | 97 | 27,480(0.35%)#36 | 165,080(0.06%)#334 |
| 37. | Richardson | 97 | 27,480(0.35%)#37 | 165,080(0.06%)#335 |
| 38. | Burkburnett | 93 | 27,480(0.34%)#38 | 165,080(0.06%)#356 |
| 39. | El Paso | 85 | 27,480(0.31%)#39 | 165,080(0.05%)#376 |
| 40. | Conroe | 84 | 27,480(0.31%)#40 | 165,080(0.05%)#380 |
| 41. | Leander | 81 | 27,480(0.29%)#41 | 165,080(0.05%)#394 |
| 42. | Addison | 80 | 27,480(0.29%)#42 | 165,080(0.05%)#401 |
| 43. | Sherman | 78 | 27,480(0.28%)#43 | 165,080(0.05%)#406 |
| 44. | Bee Cave | 77 | 27,480(0.28%)#44 | 165,080(0.05%)#413 |
| 45. | Atascocita | 74 | 27,480(0.27%)#45 | 165,080(0.04%)#422 |
| 46. | Corinth | 71 | 27,480(0.26%)#46 | 165,080(0.04%)#442 |
| 47. | Georgetown | 66 | 27,480(0.24%)#47 | 165,080(0.04%)#462 |
| 48. | Mabank | 66 | 27,480(0.24%)#48 | 165,080(0.04%)#468 |
| 49. | Wichita Falls | 65 | 27,480(0.24%)#49 | 165,080(0.04%)#470 |
| 50. | Hurst | 59 | 27,480(0.21%)#50 | 165,080(0.04%)#501 |
| 51. | Stephenville | 59 | 27,480(0.21%)#51 | 165,080(0.04%)#505 |
| 52. | Manor | 59 | 27,480(0.21%)#52 | 165,080(0.04%)#506 |
| 53. | Hillsboro | 59 | 27,480(0.21%)#53 | 165,080(0.04%)#507 |
| 54. | Four Corners | 58 | 27,480(0.21%)#54 | 165,080(0.04%)#517 |
| 55. | Whitesboro | 57 | 27,480(0.21%)#55 | 165,080(0.03%)#522 |
| 56. | Hutto | 55 | 27,480(0.20%)#56 | 165,080(0.03%)#530 |
| 57. | Bellaire | 55 | 27,480(0.20%)#57 | 165,080(0.03%)#532 |
| 58. | Missouri City | 54 | 27,480(0.20%)#58 | 165,080(0.03%)#534 |
| 59. | Prosper | 51 | 27,480(0.19%)#59 | 165,080(0.03%)#551 |
| 60. | Dalworthington Gardens | 50 | 27,480(0.18%)#60 | 165,080(0.03%)#559 |
| 61. | Pflugerville | 49 | 27,480(0.18%)#61 | 165,080(0.03%)#561 |
| 62. | Plainview | 48 | 27,480(0.17%)#62 | 165,080(0.03%)#572 |
| 63. | Saginaw | 47 | 27,480(0.17%)#63 | 165,080(0.03%)#579 |
| 64. | Keller | 37 | 27,480(0.13%)#64 | 165,080(0.02%)#656 |
| 65. | Hackberry | 36 | 27,480(0.13%)#65 | 165,080(0.02%)#668 |
| 66. | Texarkana | 34 | 27,480(0.12%)#66 | 165,080(0.02%)#688 |
| 67. | Harker Heights | 33 | 27,480(0.12%)#67 | 165,080(0.02%)#696 |
| 68. | Galveston | 31 | 27,480(0.11%)#68 | 165,080(0.02%)#715 |
| 69. | San Angelo | 30 | 27,480(0.11%)#69 | 165,080(0.02%)#731 |
| 70. | Rowlett | 26 | 27,480(0.09%)#70 | 165,080(0.02%)#790 |
| 71. | Fort Hood | 25 | 27,480(0.09%)#71 | 165,080(0.02%)#802 |
| 72. | Anna | 24 | 27,480(0.09%)#72 | 165,080(0.01%)#813 |
| 73. | Garland | 23 | 27,480(0.08%)#73 | 165,080(0.01%)#823 |
| 74. | Sachse | 23 | 27,480(0.08%)#74 | 165,080(0.01%)#831 |
| 75. | Runaway Bay | 23 | 27,480(0.08%)#75 | 165,080(0.01%)#842 |
| 76. | Benbrook | 22 | 27,480(0.08%)#76 | 165,080(0.01%)#849 |
| 77. | Watauga | 22 | 27,480(0.08%)#77 | 165,080(0.01%)#850 |
| 78. | Tyler | 20 | 27,480(0.07%)#78 | 165,080(0.01%)#869 |
| 79. | San Marcos | 20 | 27,480(0.07%)#79 | 165,080(0.01%)#872 |
| 80. | Odessa | 19 | 27,480(0.07%)#80 | 165,080(0.01%)#887 |
| 81. | Sugar Land | 18 | 27,480(0.07%)#81 | 165,080(0.01%)#904 |
| 82. | Crowley | 14 | 27,480(0.05%)#82 | 165,080(0.01%)#988 |
| 83. | Schertz | 13 | 27,480(0.05%)#83 | 165,080(0.01%)#1,000 |
| 84. | Mineola | 13 | 27,480(0.05%)#84 | 165,080(0.01%)#1,014 |
| 85. | Beaumont | 11 | 27,480(0.04%)#85 | 165,080(0.01%)#1,045 |
| 86. | Roanoke | 11 | 27,480(0.04%)#86 | 165,080(0.01%)#1,064 |
| 87. | Naples | 11 | 27,480(0.04%)#87 | 165,080(0.01%)#1,069 |
| 88. | Mcallen | 8 | 27,480(0.03%)#88 | 165,080(0.00%)#1,108 |
| 89. | Brownsville | 7 | 27,480(0.03%)#89 | 165,080(0.00%)#1,131 |
| 90. | Mansfield | 7 | 27,480(0.03%)#90 | 165,080(0.00%)#1,135 |
| 91. | Nacogdoches | 7 | 27,480(0.03%)#91 | 165,080(0.00%)#1,141 |
| 92. | Azle | 6 | 27,480(0.02%)#92 | 165,080(0.00%)#1,171 |
| 93. | Katy | 5 | 27,480(0.02%)#93 | 165,080(0.00%)#1,185 |
| 94. | The Colony | 4 | 27,480(0.01%)#94 | 165,080(0.00%)#1,204 |
| 95. | Pleasant Valley | 2 | 27,480(0.01%)#95 | 165,080(0.00%)#1,254 |
| 96. | Pantego | 1 | 27,480(0.00%)#96 | 165,080(0.00%)#1,261 |
Common Questions
What are the Top 10 Cities with the Most Immigrants from Nepal in Texas?
Top 10 Cities with the Most Immigrants from Nepal in Texas are:
#1
4,994
#2
3,817
#3
1,363
#4
1,334
#5
1,332
#6
768
#7
588
#8
483
#9
470
#10
454
What city has the Most Immigrants from Nepal in Texas?
Irving has the Most Immigrants from Nepal in Texas with 4,994.
What is the Total Immigrants from Nepal in the State of Texas?
Total Immigrants from Nepal in Texas is 27,480.
What is the Total Immigrants from Nepal in the United States?
Total Immigrants from Nepal in the United States is 165,080.