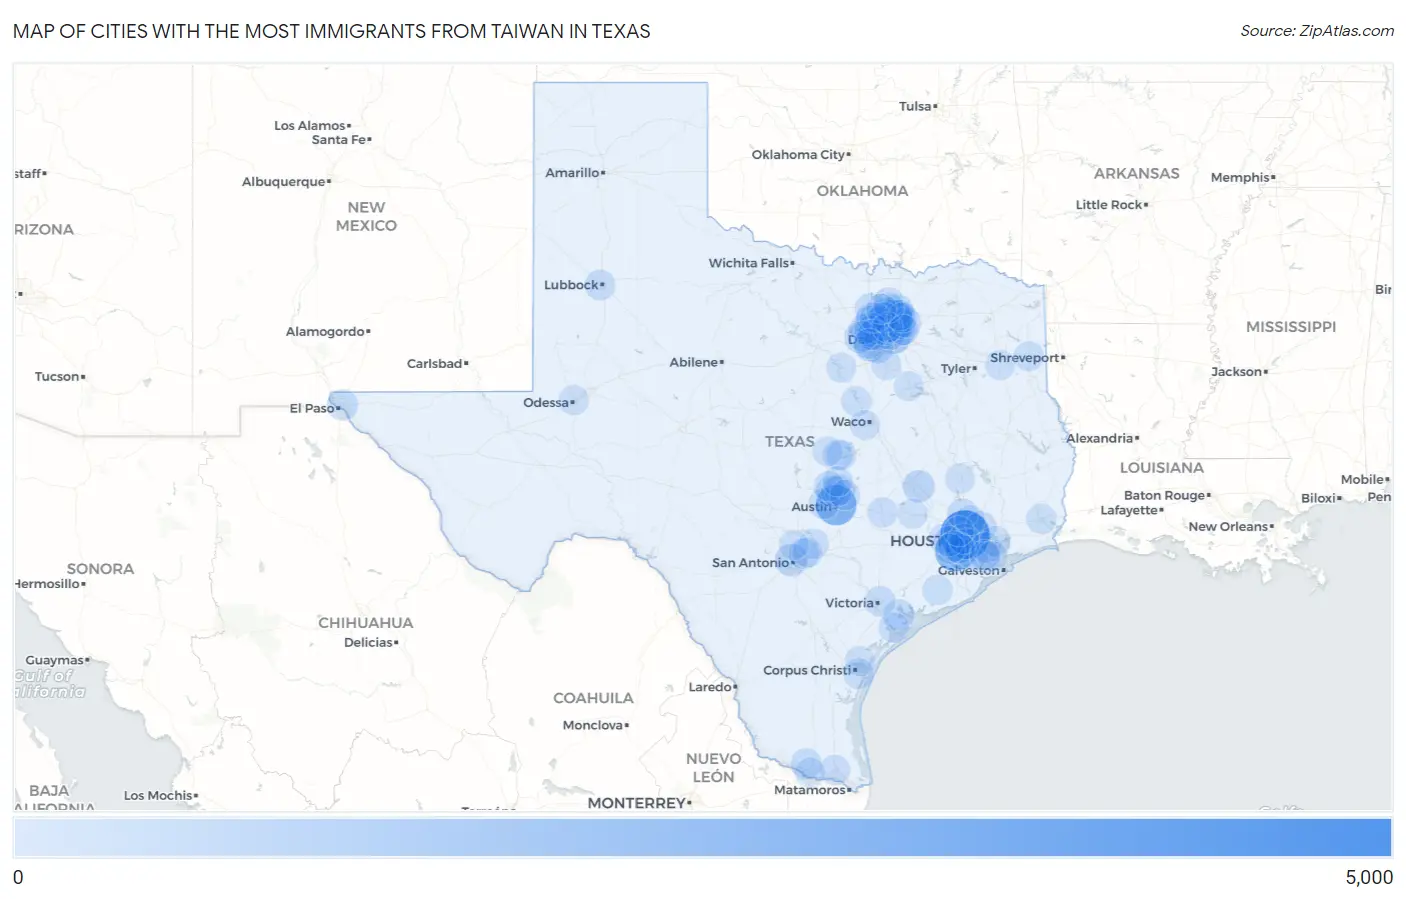
Cities with the Most Immigrants from Taiwan in Texas
RELATED REPORTS & OPTIONS
Taiwan
Texas
Compare Cities
Map of Cities with the Most Immigrants from Taiwan in Texas
0
5,000
Cities with the Most Immigrants from Taiwan in Texas
| City | Taiwan | vs State | vs National | |
| 1. | Houston | 4,210 | 27,844(15.12%)#1 | 376,336(1.12%)#12 |
| 2. | Austin | 2,241 | 27,844(8.05%)#2 | 376,336(0.60%)#20 |
| 3. | Sugar Land | 2,162 | 27,844(7.76%)#3 | 376,336(0.57%)#22 |
| 4. | Plano | 2,050 | 27,844(7.36%)#4 | 376,336(0.54%)#25 |
| 5. | Dallas | 1,056 | 27,844(3.79%)#5 | 376,336(0.28%)#49 |
| 6. | Irving | 685 | 27,844(2.46%)#6 | 376,336(0.18%)#78 |
| 7. | Richardson | 655 | 27,844(2.35%)#7 | 376,336(0.17%)#86 |
| 8. | Allen | 597 | 27,844(2.14%)#8 | 376,336(0.16%)#94 |
| 9. | Arlington | 585 | 27,844(2.10%)#9 | 376,336(0.16%)#95 |
| 10. | Frisco | 536 | 27,844(1.93%)#10 | 376,336(0.14%)#103 |
| 11. | San Antonio | 485 | 27,844(1.74%)#11 | 376,336(0.13%)#116 |
| 12. | College Station | 456 | 27,844(1.64%)#12 | 376,336(0.12%)#122 |
| 13. | Garland | 386 | 27,844(1.39%)#13 | 376,336(0.10%)#147 |
| 14. | Grand Prairie | 338 | 27,844(1.21%)#14 | 376,336(0.09%)#160 |
| 15. | Mckinney | 306 | 27,844(1.10%)#15 | 376,336(0.08%)#179 |
| 16. | Fort Worth | 304 | 27,844(1.09%)#16 | 376,336(0.08%)#180 |
| 17. | Port Lavaca | 276 | 27,844(0.99%)#17 | 376,336(0.07%)#201 |
| 18. | West University Place | 242 | 27,844(0.87%)#18 | 376,336(0.06%)#225 |
| 19. | Missouri City | 230 | 27,844(0.83%)#19 | 376,336(0.06%)#237 |
| 20. | Pearland | 222 | 27,844(0.80%)#20 | 376,336(0.06%)#247 |
| 21. | El Paso | 214 | 27,844(0.77%)#21 | 376,336(0.06%)#256 |
| 22. | Carrollton | 194 | 27,844(0.70%)#22 | 376,336(0.05%)#280 |
| 23. | Mcallen | 189 | 27,844(0.68%)#23 | 376,336(0.05%)#283 |
| 24. | Denton | 187 | 27,844(0.67%)#24 | 376,336(0.05%)#286 |
| 25. | Cedar Park | 182 | 27,844(0.65%)#25 | 376,336(0.05%)#292 |
| 26. | Southlake | 163 | 27,844(0.59%)#26 | 376,336(0.04%)#330 |
| 27. | Lewisville | 155 | 27,844(0.56%)#27 | 376,336(0.04%)#340 |
| 28. | Meadows Place | 155 | 27,844(0.56%)#28 | 376,336(0.04%)#341 |
| 29. | League City | 147 | 27,844(0.53%)#29 | 376,336(0.04%)#352 |
| 30. | Bellaire | 132 | 27,844(0.47%)#30 | 376,336(0.04%)#397 |
| 31. | Bee Cave | 122 | 27,844(0.44%)#31 | 376,336(0.03%)#426 |
| 32. | Victoria | 119 | 27,844(0.43%)#32 | 376,336(0.03%)#435 |
| 33. | Round Rock | 118 | 27,844(0.42%)#33 | 376,336(0.03%)#439 |
| 34. | Lubbock | 114 | 27,844(0.41%)#34 | 376,336(0.03%)#448 |
| 35. | The Woodlands | 113 | 27,844(0.41%)#35 | 376,336(0.03%)#453 |
| 36. | Brushy Creek | 107 | 27,844(0.38%)#36 | 376,336(0.03%)#472 |
| 37. | Corpus Christi | 106 | 27,844(0.38%)#37 | 376,336(0.03%)#473 |
| 38. | Flower Mound | 88 | 27,844(0.32%)#38 | 376,336(0.02%)#540 |
| 39. | Coppell | 88 | 27,844(0.32%)#39 | 376,336(0.02%)#542 |
| 40. | Killeen | 86 | 27,844(0.31%)#40 | 376,336(0.02%)#556 |
| 41. | Harker Heights | 85 | 27,844(0.31%)#41 | 376,336(0.02%)#563 |
| 42. | Katy | 85 | 27,844(0.31%)#42 | 376,336(0.02%)#564 |
| 43. | Grapevine | 81 | 27,844(0.29%)#43 | 376,336(0.02%)#587 |
| 44. | Atascocita | 80 | 27,844(0.29%)#44 | 376,336(0.02%)#601 |
| 45. | Colleyville | 79 | 27,844(0.28%)#45 | 376,336(0.02%)#613 |
| 46. | Palm Valley | 75 | 27,844(0.27%)#46 | 376,336(0.02%)#640 |
| 47. | University Park | 73 | 27,844(0.26%)#47 | 376,336(0.02%)#653 |
| 48. | Bedford | 72 | 27,844(0.26%)#48 | 376,336(0.02%)#656 |
| 49. | Pasadena | 70 | 27,844(0.25%)#49 | 376,336(0.02%)#674 |
| 50. | Murphy | 70 | 27,844(0.25%)#50 | 376,336(0.02%)#679 |
| 51. | Seadrift | 68 | 27,844(0.24%)#51 | 376,336(0.02%)#704 |
| 52. | Universal City | 66 | 27,844(0.24%)#52 | 376,336(0.02%)#713 |
| 53. | Giddings | 62 | 27,844(0.22%)#53 | 376,336(0.02%)#759 |
| 54. | Four Corners | 59 | 27,844(0.21%)#54 | 376,336(0.02%)#782 |
| 55. | Stafford | 57 | 27,844(0.20%)#55 | 376,336(0.02%)#800 |
| 56. | Wylie | 56 | 27,844(0.20%)#56 | 376,336(0.01%)#807 |
| 57. | Bay City | 55 | 27,844(0.20%)#57 | 376,336(0.01%)#820 |
| 58. | Leander | 53 | 27,844(0.19%)#58 | 376,336(0.01%)#843 |
| 59. | Celina | 53 | 27,844(0.19%)#59 | 376,336(0.01%)#845 |
| 60. | Baytown | 52 | 27,844(0.19%)#60 | 376,336(0.01%)#853 |
| 61. | Keller | 51 | 27,844(0.18%)#61 | 376,336(0.01%)#869 |
| 62. | Beaumont | 46 | 27,844(0.17%)#62 | 376,336(0.01%)#919 |
| 63. | Lantana | 46 | 27,844(0.17%)#63 | 376,336(0.01%)#927 |
| 64. | Cinco Ranch | 42 | 27,844(0.15%)#64 | 376,336(0.01%)#974 |
| 65. | The Colony | 41 | 27,844(0.15%)#65 | 376,336(0.01%)#990 |
| 66. | Fairview | 40 | 27,844(0.14%)#66 | 376,336(0.01%)#1,017 |
| 67. | Marshall | 39 | 27,844(0.14%)#67 | 376,336(0.01%)#1,024 |
| 68. | Pflugerville | 36 | 27,844(0.13%)#68 | 376,336(0.01%)#1,075 |
| 69. | Farmers Branch | 34 | 27,844(0.12%)#69 | 376,336(0.01%)#1,120 |
| 70. | Euless | 33 | 27,844(0.12%)#70 | 376,336(0.01%)#1,139 |
| 71. | Georgetown | 32 | 27,844(0.11%)#71 | 376,336(0.01%)#1,164 |
| 72. | Portland | 31 | 27,844(0.11%)#72 | 376,336(0.01%)#1,194 |
| 73. | Kilgore | 31 | 27,844(0.11%)#73 | 376,336(0.01%)#1,197 |
| 74. | Bacliff | 31 | 27,844(0.11%)#74 | 376,336(0.01%)#1,200 |
| 75. | Laguna Park | 31 | 27,844(0.11%)#75 | 376,336(0.01%)#1,209 |
| 76. | Corsicana | 30 | 27,844(0.11%)#76 | 376,336(0.01%)#1,221 |
| 77. | Waxahachie | 28 | 27,844(0.10%)#77 | 376,336(0.01%)#1,262 |
| 78. | Spring Valley Village | 28 | 27,844(0.10%)#78 | 376,336(0.01%)#1,280 |
| 79. | New Braunfels | 27 | 27,844(0.10%)#79 | 376,336(0.01%)#1,286 |
| 80. | Pharr | 27 | 27,844(0.10%)#80 | 376,336(0.01%)#1,288 |
| 81. | Rowlett | 27 | 27,844(0.10%)#81 | 376,336(0.01%)#1,291 |
| 82. | Webster | 27 | 27,844(0.10%)#82 | 376,336(0.01%)#1,305 |
| 83. | Pecan Grove | 26 | 27,844(0.09%)#83 | 376,336(0.01%)#1,323 |
| 84. | Copperas Cove | 25 | 27,844(0.09%)#84 | 376,336(0.01%)#1,349 |
| 85. | Woodway | 25 | 27,844(0.09%)#85 | 376,336(0.01%)#1,362 |
| 86. | Odessa | 24 | 27,844(0.09%)#86 | 376,336(0.01%)#1,372 |
| 87. | Jersey Village | 22 | 27,844(0.08%)#87 | 376,336(0.01%)#1,448 |
| 88. | Haltom City | 21 | 27,844(0.08%)#88 | 376,336(0.01%)#1,467 |
| 89. | Schertz | 21 | 27,844(0.08%)#89 | 376,336(0.01%)#1,471 |
| 90. | Addison | 21 | 27,844(0.08%)#90 | 376,336(0.01%)#1,478 |
| 91. | Prosper | 19 | 27,844(0.07%)#91 | 376,336(0.01%)#1,560 |
| 92. | Spring | 18 | 27,844(0.06%)#92 | 376,336(0.00%)#1,593 |
| 93. | Timberwood Park | 18 | 27,844(0.06%)#93 | 376,336(0.00%)#1,602 |
| 94. | Brenham | 18 | 27,844(0.06%)#94 | 376,336(0.00%)#1,609 |
| 95. | Highland Village | 17 | 27,844(0.06%)#95 | 376,336(0.00%)#1,657 |
| 96. | Pecan Plantation | 17 | 27,844(0.06%)#96 | 376,336(0.00%)#1,669 |
| 97. | Lucas | 16 | 27,844(0.06%)#97 | 376,336(0.00%)#1,723 |
| 98. | Paloma Creek | 16 | 27,844(0.06%)#98 | 376,336(0.00%)#1,729 |
| 99. | Pantego | 16 | 27,844(0.06%)#99 | 376,336(0.00%)#1,730 |
| 100. | Huntsville | 15 | 27,844(0.05%)#100 | 376,336(0.00%)#1,743 |
Common Questions
What are the Top 10 Cities with the Most Immigrants from Taiwan in Texas?
Top 10 Cities with the Most Immigrants from Taiwan in Texas are:
#1
4,210
#2
2,241
#3
2,162
#4
2,050
#5
1,056
#6
685
#7
655
#8
597
#9
585
#10
536
What city has the Most Immigrants from Taiwan in Texas?
Houston has the Most Immigrants from Taiwan in Texas with 4,210.
What is the Total Immigrants from Taiwan in the State of Texas?
Total Immigrants from Taiwan in Texas is 27,844.
What is the Total Immigrants from Taiwan in the United States?
Total Immigrants from Taiwan in the United States is 376,336.