Cut and Shoot, TX
Cut and Shoot Map
Cut and Shoot Overview
1,003
TOTAL POPULATION
502
MALE POPULATION
501
FEMALE POPULATION
100.20
MALES / 100 FEMALES
99.80
FEMALES / 100 MALES
40.3
MEDIAN AGE
3.5
AVG FAMILY SIZE
2.9
AVG HOUSEHOLD SIZE
$29,687
PER CAPITA INCOME
$97,375
AVG FAMILY INCOME
$69,667
AVG HOUSEHOLD INCOME
29.4%
WAGE / INCOME GAP [ % ]
70.6¢/ $1
WAGE / INCOME GAP [ $ ]
0.36
INEQUALITY / GINI INDEX
467
LABOR FORCE [ PEOPLE ]
58.3%
PERCENT IN LABOR FORCE
1.9%
UNEMPLOYMENT RATE
Cut and Shoot Area Codes
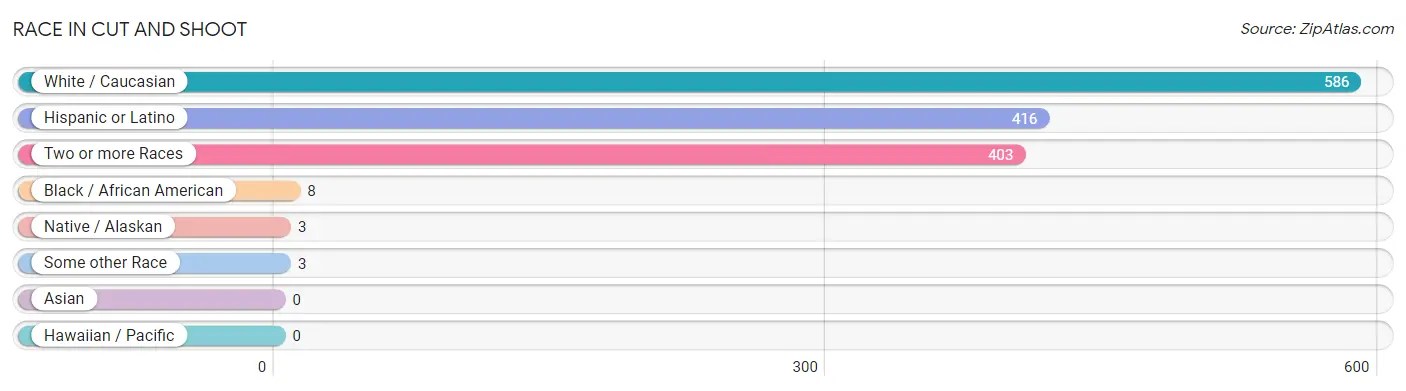
Race in Cut and Shoot
The most populous races in Cut and Shoot are White / Caucasian (586 | 58.4%), Hispanic or Latino (416 | 41.5%), and Two or more Races (403 | 40.2%).
| Race | # Population | % Population |
| Asian | 0 | 0.0% |
| Black / African American | 8 | 0.8% |
| Hawaiian / Pacific | 0 | 0.0% |
| Hispanic or Latino | 416 | 41.5% |
| Native / Alaskan | 3 | 0.3% |
| White / Caucasian | 586 | 58.4% |
| Two or more Races | 403 | 40.2% |
| Some other Race | 3 | 0.3% |
| Total | 1,003 | 100.0% |
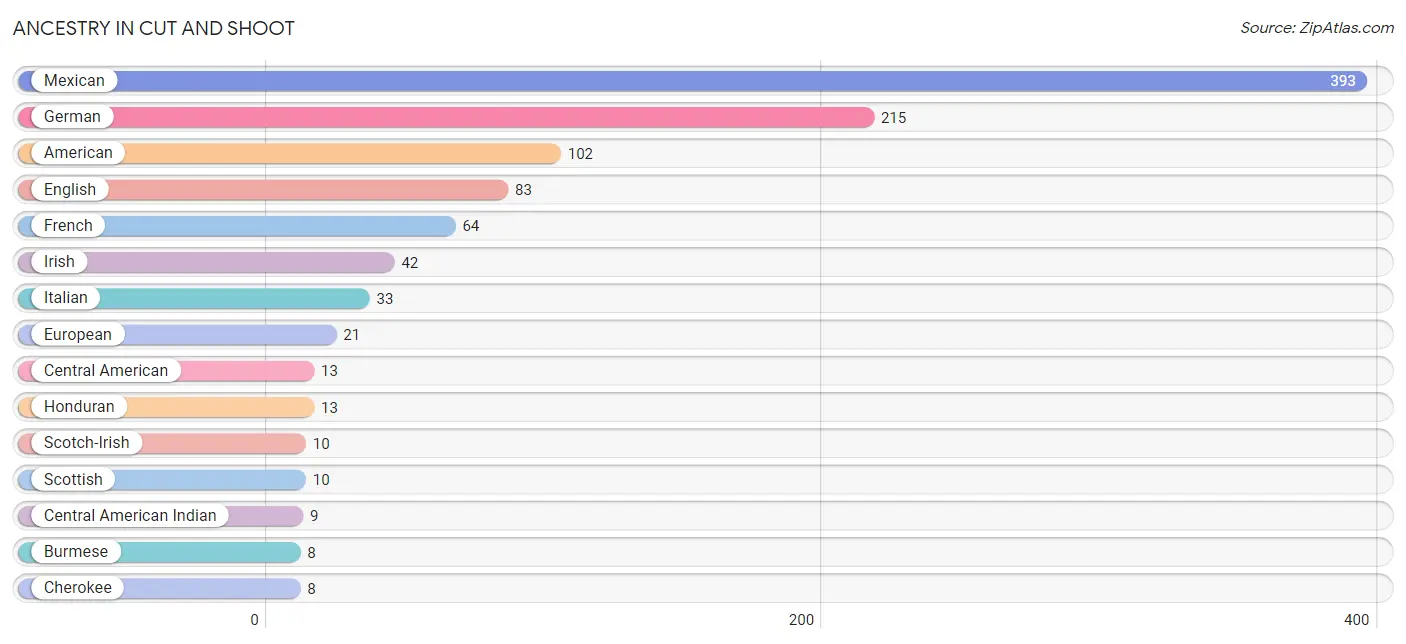
Ancestry in Cut and Shoot
The most populous ancestries reported in Cut and Shoot are Mexican (393 | 39.2%), German (215 | 21.4%), American (102 | 10.2%), English (83 | 8.3%), and French (64 | 6.4%), together accounting for 85.4% of all Cut and Shoot residents.
| Ancestry | # Population | % Population |
| American | 102 | 10.2% |
| Blackfeet | 6 | 0.6% |
| Burmese | 8 | 0.8% |
| Central American | 13 | 1.3% |
| Central American Indian | 9 | 0.9% |
| Cherokee | 8 | 0.8% |
| Cuban | 7 | 0.7% |
| Danish | 3 | 0.3% |
| Dutch | 8 | 0.8% |
| Eastern European | 5 | 0.5% |
| English | 83 | 8.3% |
| European | 21 | 2.1% |
| French | 64 | 6.4% |
| German | 215 | 21.4% |
| Honduran | 13 | 1.3% |
| Irish | 42 | 4.2% |
| Italian | 33 | 3.3% |
| Mexican | 393 | 39.2% |
| Native Hawaiian | 1 | 0.1% |
| Polish | 7 | 0.7% |
| Scotch-Irish | 10 | 1.0% |
| Scottish | 10 | 1.0% |
| Spanish | 3 | 0.3% | View All 23 Rows |
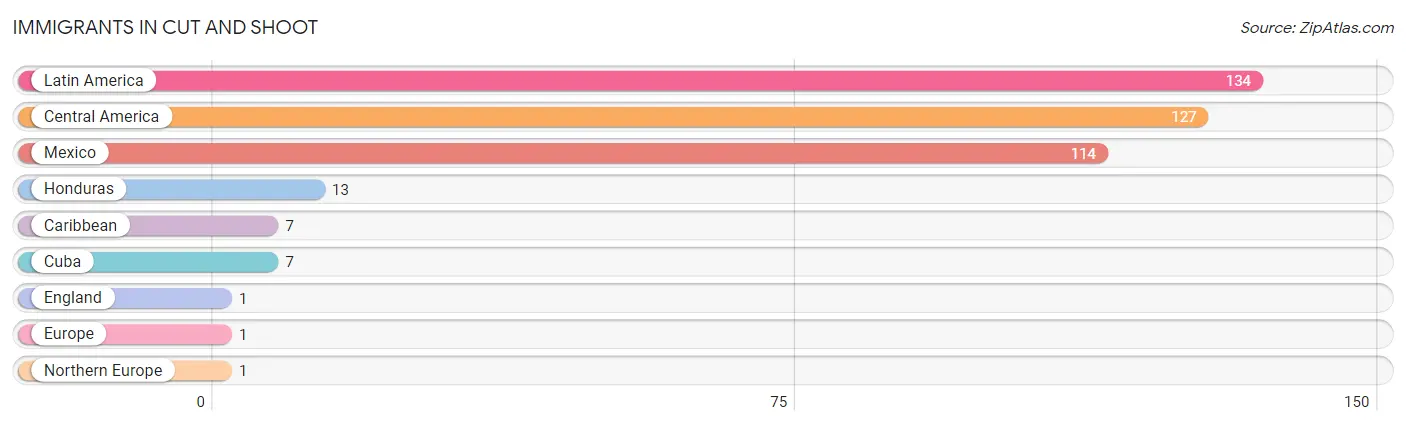
Immigrants in Cut and Shoot
The most numerous immigrant groups reported in Cut and Shoot came from Latin America (134 | 13.4%), Central America (127 | 12.7%), Mexico (114 | 11.4%), Honduras (13 | 1.3%), and Caribbean (7 | 0.7%), together accounting for 39.4% of all Cut and Shoot residents.
| Immigration Origin | # Population | % Population |
| Caribbean | 7 | 0.7% |
| Central America | 127 | 12.7% |
| Cuba | 7 | 0.7% |
| England | 1 | 0.1% |
| Europe | 1 | 0.1% |
| Honduras | 13 | 1.3% |
| Latin America | 134 | 13.4% |
| Mexico | 114 | 11.4% |
| Northern Europe | 1 | 0.1% | View All 9 Rows |
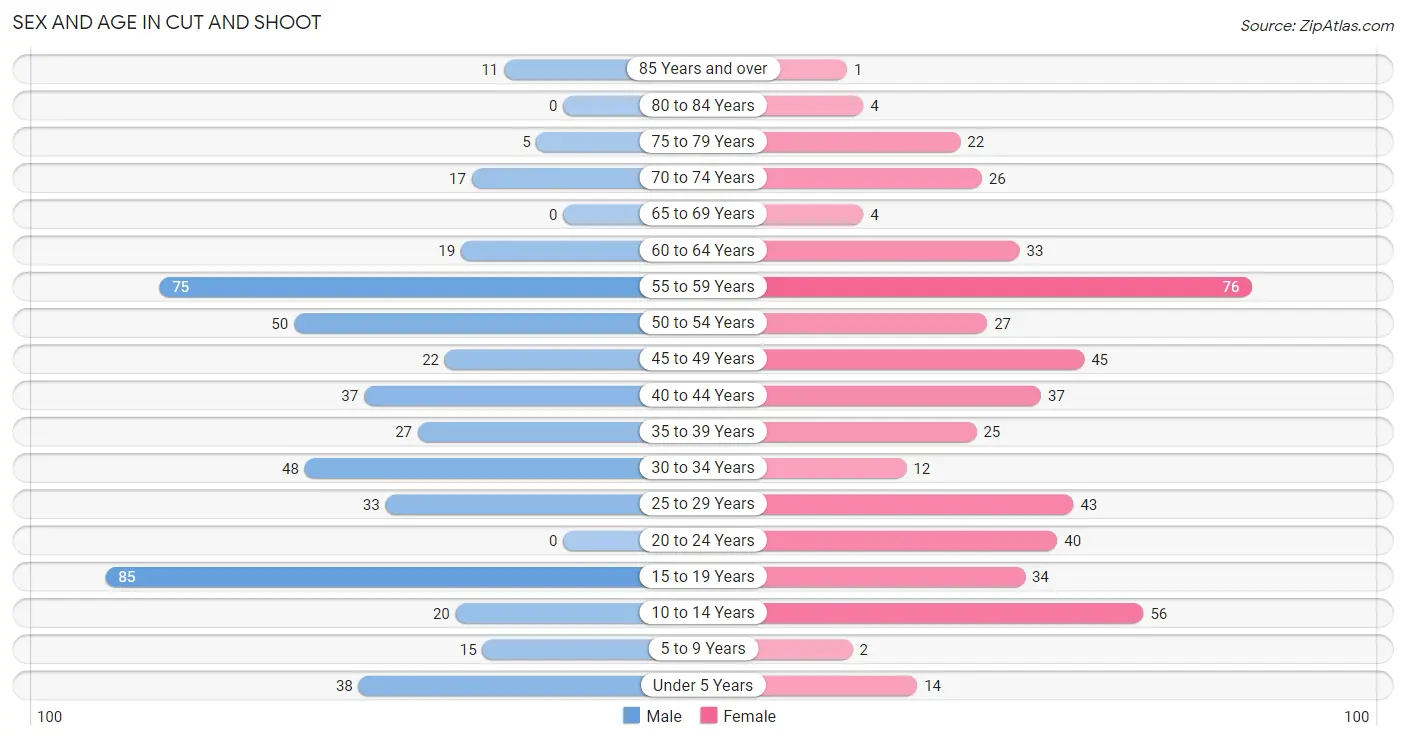
Sex and Age in Cut and Shoot
Sex and Age in Cut and Shoot
The most populous age groups in Cut and Shoot are 15 to 19 Years (85 | 16.9%) for men and 55 to 59 Years (76 | 15.2%) for women.
| Age Bracket | Male | Female |
| Under 5 Years | 38 (7.6%) | 14 (2.8%) |
| 5 to 9 Years | 15 (3.0%) | 2 (0.4%) |
| 10 to 14 Years | 20 (4.0%) | 56 (11.2%) |
| 15 to 19 Years | 85 (16.9%) | 34 (6.8%) |
| 20 to 24 Years | 0 (0.0%) | 40 (8.0%) |
| 25 to 29 Years | 33 (6.6%) | 43 (8.6%) |
| 30 to 34 Years | 48 (9.6%) | 12 (2.4%) |
| 35 to 39 Years | 27 (5.4%) | 25 (5.0%) |
| 40 to 44 Years | 37 (7.4%) | 37 (7.4%) |
| 45 to 49 Years | 22 (4.4%) | 45 (9.0%) |
| 50 to 54 Years | 50 (10.0%) | 27 (5.4%) |
| 55 to 59 Years | 75 (14.9%) | 76 (15.2%) |
| 60 to 64 Years | 19 (3.8%) | 33 (6.6%) |
| 65 to 69 Years | 0 (0.0%) | 4 (0.8%) |
| 70 to 74 Years | 17 (3.4%) | 26 (5.2%) |
| 75 to 79 Years | 5 (1.0%) | 22 (4.4%) |
| 80 to 84 Years | 0 (0.0%) | 4 (0.8%) |
| 85 Years and over | 11 (2.2%) | 1 (0.2%) |
| Total | 502 (100.0%) | 501 (100.0%) |
Families and Households in Cut and Shoot
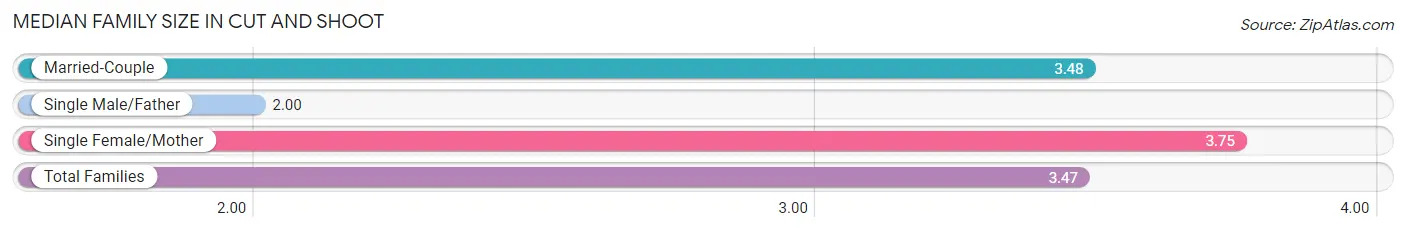
Median Family Size in Cut and Shoot
The median family size in Cut and Shoot is 3.47 persons per family, with single female/mother families (12 | 4.7%) accounting for the largest median family size of 3.75 persons per family. On the other hand, single male/father families (5 | 1.9%) represent the smallest median family size with 2.00 persons per family.
| Family Type | # Families | Family Size |
| Married-Couple | 240 (93.4%) | 3.48 |
| Single Male/Father | 5 (1.9%) | 2.00 |
| Single Female/Mother | 12 (4.7%) | 3.75 |
| Total Families | 257 (100.0%) | 3.47 |
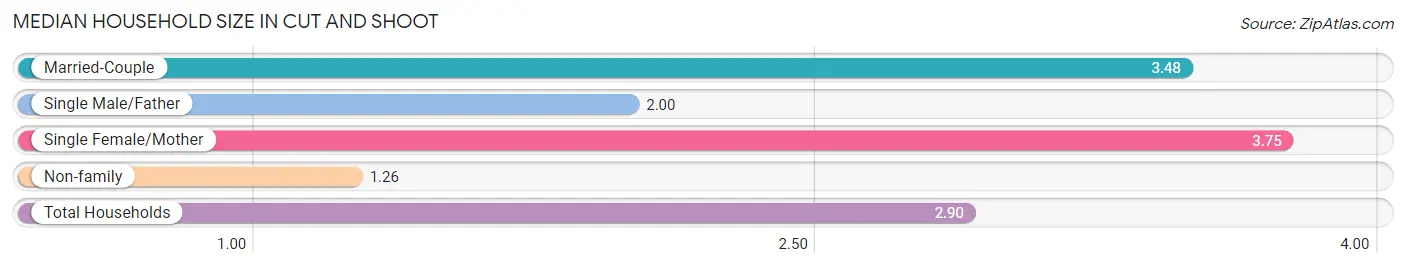
Median Household Size in Cut and Shoot
The median household size in Cut and Shoot is 2.90 persons per household, with single female/mother households (12 | 3.5%) accounting for the largest median household size of 3.75 persons per household. non-family households (89 | 25.7%) represent the smallest median household size with 1.26 persons per household.
| Household Type | # Households | Household Size |
| Married-Couple | 240 (69.4%) | 3.48 |
| Single Male/Father | 5 (1.5%) | 2.00 |
| Single Female/Mother | 12 (3.5%) | 3.75 |
| Non-family | 89 (25.7%) | 1.26 |
| Total Households | 346 (100.0%) | 2.90 |
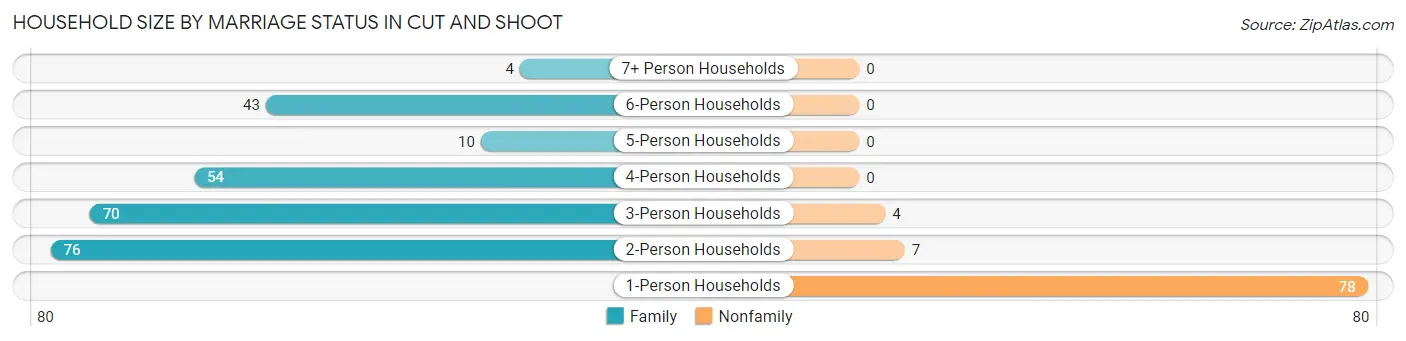
Household Size by Marriage Status in Cut and Shoot
Out of a total of 346 households in Cut and Shoot, 257 (74.3%) are family households, while 89 (25.7%) are nonfamily households. The most numerous type of family households are 2-person households, comprising 76, and the most common type of nonfamily households are 1-person households, comprising 78.
| Household Size | Family Households | Nonfamily Households |
| 1-Person Households | - | 78 (22.5%) |
| 2-Person Households | 76 (22.0%) | 7 (2.0%) |
| 3-Person Households | 70 (20.2%) | 4 (1.2%) |
| 4-Person Households | 54 (15.6%) | 0 (0.0%) |
| 5-Person Households | 10 (2.9%) | 0 (0.0%) |
| 6-Person Households | 43 (12.4%) | 0 (0.0%) |
| 7+ Person Households | 4 (1.2%) | 0 (0.0%) |
| Total | 257 (74.3%) | 89 (25.7%) |
Female Fertility in Cut and Shoot
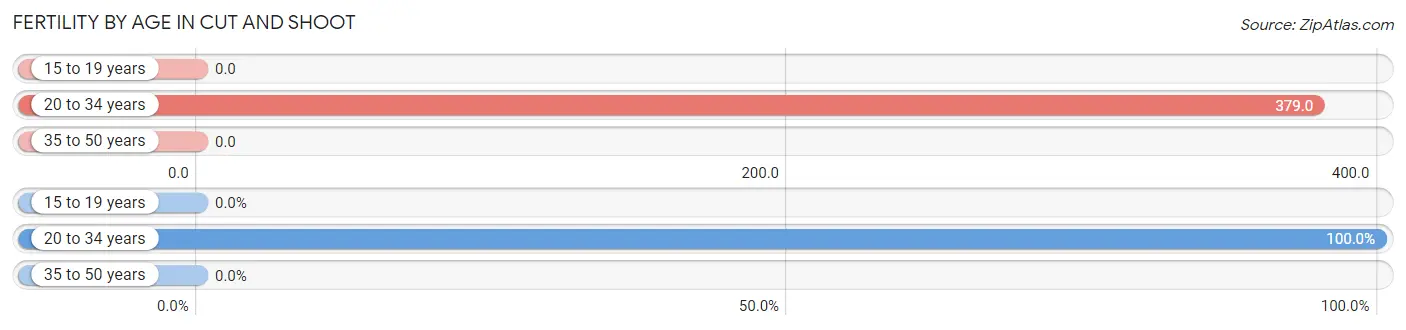
Fertility by Age in Cut and Shoot
Average fertility rate in Cut and Shoot is 147.0 births per 1,000 women. Women in the age bracket of 20 to 34 years have the highest fertility rate with 379.0 births per 1,000 women. Women in the age bracket of 20 to 34 years acount for 100.0% of all women with births.
| Age Bracket | Women with Births | Births / 1,000 Women |
| 15 to 19 years | 0 (0.0%) | 0.0 |
| 20 to 34 years | 36 (100.0%) | 379.0 |
| 35 to 50 years | 0 (0.0%) | 0.0 |
| Total | 36 (100.0%) | 147.0 |
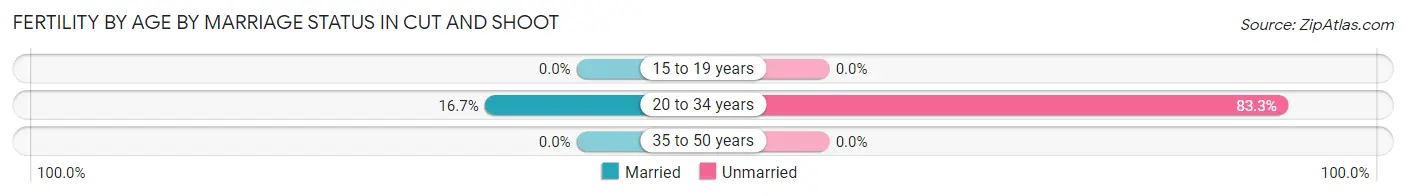
Fertility by Age by Marriage Status in Cut and Shoot
16.7% of women with births (36) in Cut and Shoot are married. The highest percentage of unmarried women with births falls into 20 to 34 years age bracket with 83.3% of them unmarried at the time of birth, while the lowest percentage of unmarried women with births belong to 20 to 34 years age bracket with 83.3% of them unmarried.
| Age Bracket | Married | Unmarried |
| 15 to 19 years | 0 (0.0%) | 0 (0.0%) |
| 20 to 34 years | 6 (16.7%) | 30 (83.3%) |
| 35 to 50 years | 0 (0.0%) | 0 (0.0%) |
| Total | 6 (16.7%) | 30 (83.3%) |
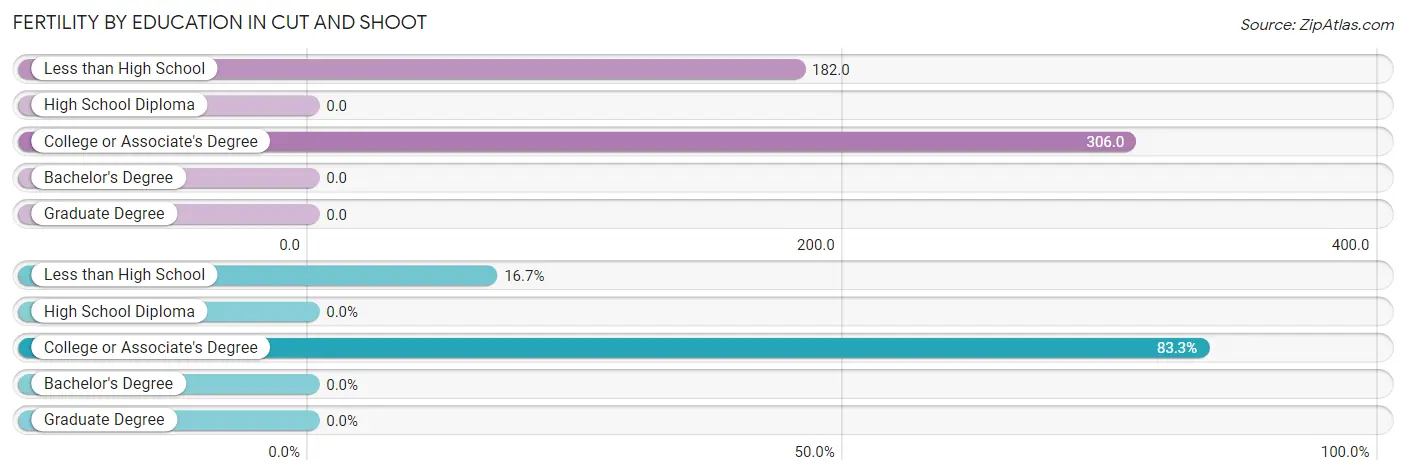
Fertility by Education in Cut and Shoot
| Educational Attainment | Women with Births | Births / 1,000 Women |
| Less than High School | 6 (16.7%) | 182.0 |
| High School Diploma | 0 (0.0%) | 0.0 |
| College or Associate's Degree | 30 (83.3%) | 306.0 |
| Bachelor's Degree | 0 (0.0%) | 0.0 |
| Graduate Degree | 0 (0.0%) | 0.0 |
| Total | 36 (100.0%) | 147.0 |
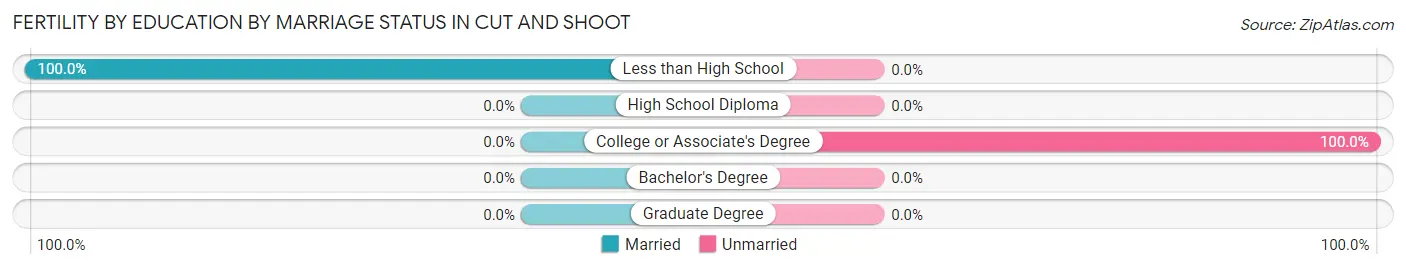
Fertility by Education by Marriage Status in Cut and Shoot
83.3% of women with births in Cut and Shoot are unmarried. Women with the educational attainment of less than high school are most likely to be married with 100.0% of them married at childbirth, while women with the educational attainment of college or associate's degree are least likely to be married with 100.0% of them unmarried at childbirth.
| Educational Attainment | Married | Unmarried |
| Less than High School | 6 (100.0%) | 0 (0.0%) |
| High School Diploma | 0 (0.0%) | 0 (0.0%) |
| College or Associate's Degree | 0 (0.0%) | 30 (100.0%) |
| Bachelor's Degree | 0 (0.0%) | 0 (0.0%) |
| Graduate Degree | 0 (0.0%) | 0 (0.0%) |
| Total | 6 (16.7%) | 30 (83.3%) |
Income in Cut and Shoot
Income Overview in Cut and Shoot
Per Capita Income in Cut and Shoot is $29,687, while median incomes of families and households are $97,375 and $69,667 respectively.
| Characteristic | Number | Measure |
| Per Capita Income | 1,003 | $29,687 |
| Median Family Income | 257 | $97,375 |
| Mean Family Income | 257 | $104,782 |
| Median Household Income | 346 | $69,667 |
| Mean Household Income | 346 | $85,941 |
| Income Deficit | 257 | $0 |
| Wage / Income Gap (%) | 1,003 | 29.43% |
| Wage / Income Gap ($) | 1,003 | 70.57¢ per $1 |
| Gini / Inequality Index | 1,003 | 0.36 |
Earnings by Sex in Cut and Shoot
Average Earnings in Cut and Shoot are $40,170, $50,833 for men and $35,871 for women, a difference of 29.4%.
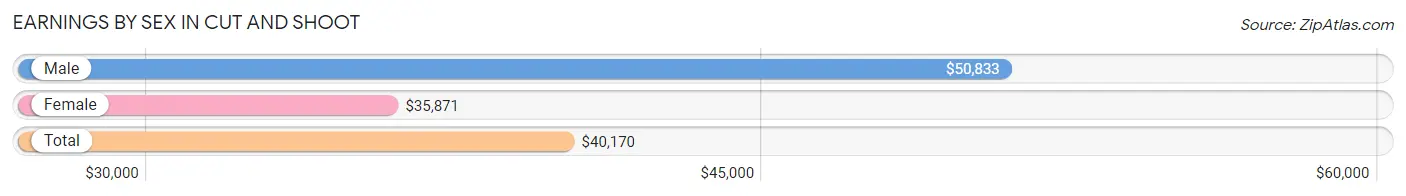
| Sex | Number | Average Earnings |
| Male | 260 (49.3%) | $50,833 |
| Female | 267 (50.7%) | $35,871 |
| Total | 527 (100.0%) | $40,170 |
Earnings by Sex by Income Bracket in Cut and Shoot
The most common earnings brackets in Cut and Shoot are $100,000+ for men (62 | 23.8%) and $45,000 to $49,999 for women (39 | 14.6%).
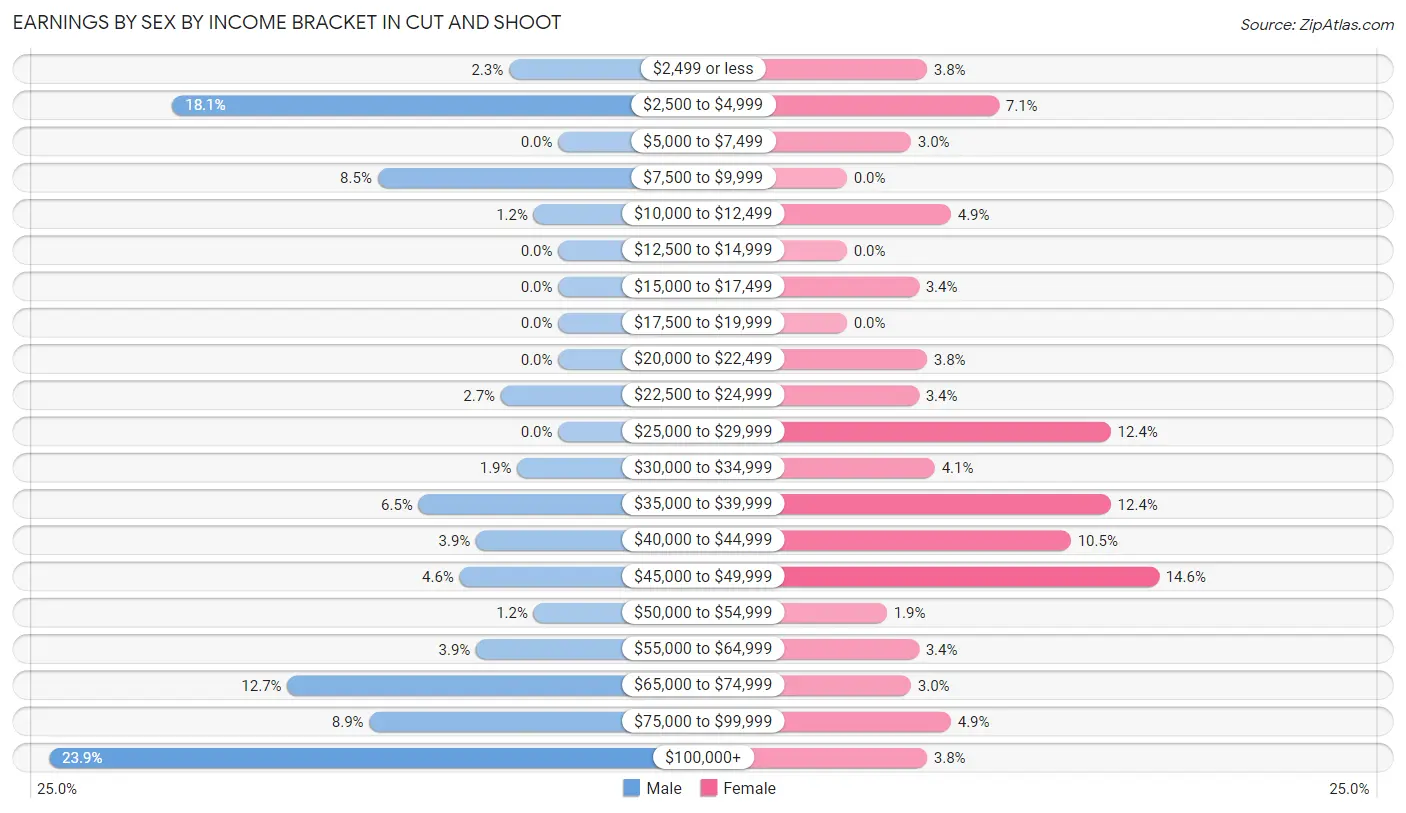
| Income | Male | Female |
| $2,499 or less | 6 (2.3%) | 10 (3.7%) |
| $2,500 to $4,999 | 47 (18.1%) | 19 (7.1%) |
| $5,000 to $7,499 | 0 (0.0%) | 8 (3.0%) |
| $7,500 to $9,999 | 22 (8.5%) | 0 (0.0%) |
| $10,000 to $12,499 | 3 (1.1%) | 13 (4.9%) |
| $12,500 to $14,999 | 0 (0.0%) | 0 (0.0%) |
| $15,000 to $17,499 | 0 (0.0%) | 9 (3.4%) |
| $17,500 to $19,999 | 0 (0.0%) | 0 (0.0%) |
| $20,000 to $22,499 | 0 (0.0%) | 10 (3.7%) |
| $22,500 to $24,999 | 7 (2.7%) | 9 (3.4%) |
| $25,000 to $29,999 | 0 (0.0%) | 33 (12.4%) |
| $30,000 to $34,999 | 5 (1.9%) | 11 (4.1%) |
| $35,000 to $39,999 | 17 (6.5%) | 33 (12.4%) |
| $40,000 to $44,999 | 10 (3.8%) | 28 (10.5%) |
| $45,000 to $49,999 | 12 (4.6%) | 39 (14.6%) |
| $50,000 to $54,999 | 3 (1.1%) | 5 (1.9%) |
| $55,000 to $64,999 | 10 (3.8%) | 9 (3.4%) |
| $65,000 to $74,999 | 33 (12.7%) | 8 (3.0%) |
| $75,000 to $99,999 | 23 (8.8%) | 13 (4.9%) |
| $100,000+ | 62 (23.8%) | 10 (3.7%) |
| Total | 260 (100.0%) | 267 (100.0%) |
Earnings by Sex by Educational Attainment in Cut and Shoot
Average earnings in Cut and Shoot are $50,833 for men and $35,568 for women, a difference of 30.0%. Men with an educational attainment of high school diploma enjoy the highest average annual earnings of $72,159, while those with less than high school education earn the least with $46,389. Women with an educational attainment of bachelor's degree earn the most with the average annual earnings of $61,750, while those with college or associate's degree education have the smallest earnings of $27,277.
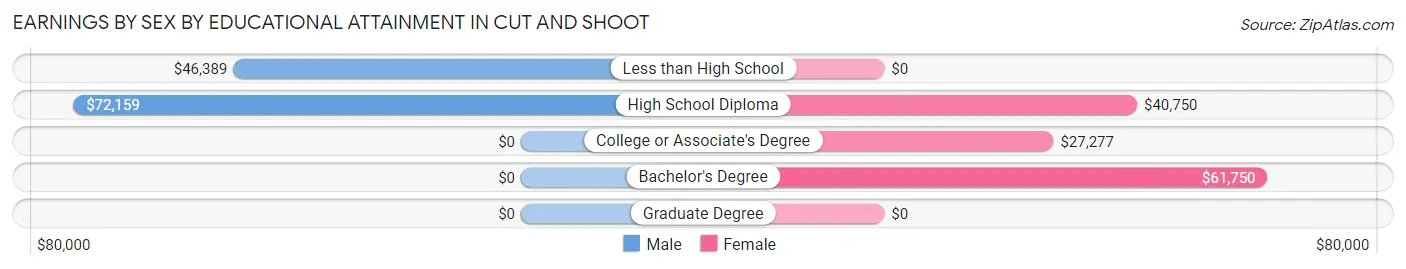
| Educational Attainment | Male Income | Female Income |
| Less than High School | $46,389 | $0 |
| High School Diploma | $72,159 | $40,750 |
| College or Associate's Degree | - | - |
| Bachelor's Degree | - | - |
| Graduate Degree | - | - |
| Total | $50,833 | $35,568 |
Family Income in Cut and Shoot
Family Income Brackets in Cut and Shoot
According to the Cut and Shoot family income data, there are 87 families falling into the $50,000 to $74,999 income range, which is the most common income bracket and makes up 33.9% of all families.
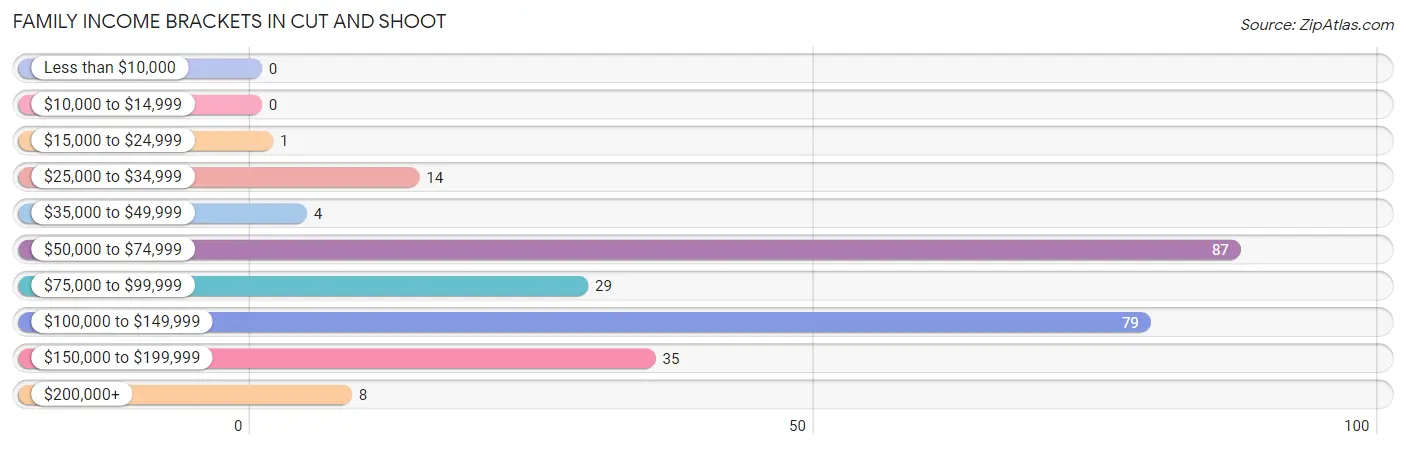
| Income Bracket | # Families | % Families |
| Less than $10,000 | 0 | 0.0% |
| $10,000 to $14,999 | 0 | 0.0% |
| $15,000 to $24,999 | 1 | 0.4% |
| $25,000 to $34,999 | 14 | 5.4% |
| $35,000 to $49,999 | 4 | 1.6% |
| $50,000 to $74,999 | 87 | 33.9% |
| $75,000 to $99,999 | 29 | 11.3% |
| $100,000 to $149,999 | 79 | 30.7% |
| $150,000 to $199,999 | 35 | 13.6% |
| $200,000+ | 8 | 3.1% |
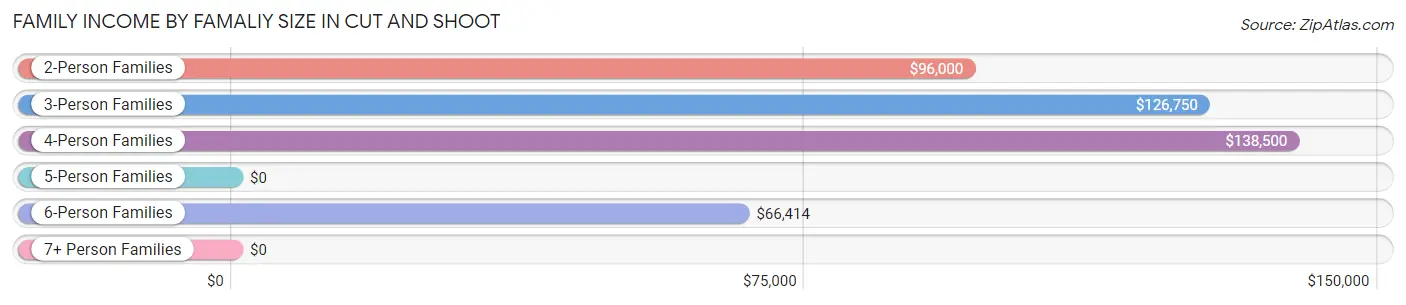
Family Income by Famaliy Size in Cut and Shoot
4-person families (54 | 21.0%) account for the highest median family income in Cut and Shoot with $138,500 per family, while 2-person families (76 | 29.6%) have the highest median income of $48,000 per family member.
| Income Bracket | # Families | Median Income |
| 2-Person Families | 76 (29.6%) | $96,000 |
| 3-Person Families | 70 (27.2%) | $126,750 |
| 4-Person Families | 54 (21.0%) | $138,500 |
| 5-Person Families | 10 (3.9%) | $0 |
| 6-Person Families | 43 (16.7%) | $66,414 |
| 7+ Person Families | 4 (1.6%) | $0 |
| Total | 257 (100.0%) | $97,375 |
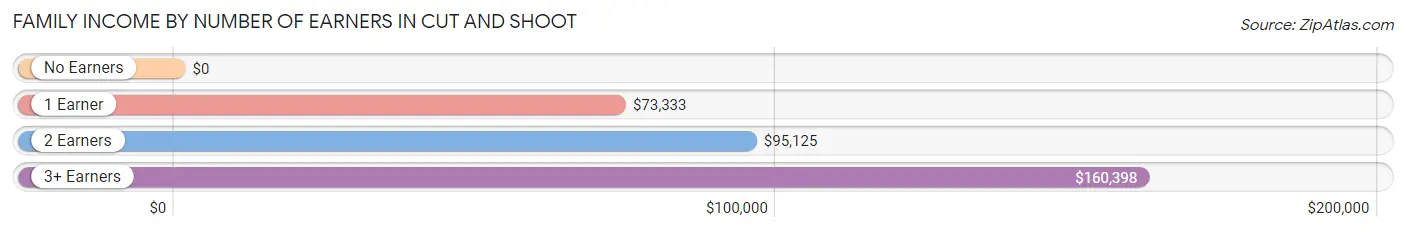
Family Income by Number of Earners in Cut and Shoot
| Number of Earners | # Families | Median Income |
| No Earners | 17 (6.6%) | $0 |
| 1 Earner | 48 (18.7%) | $73,333 |
| 2 Earners | 145 (56.4%) | $95,125 |
| 3+ Earners | 47 (18.3%) | $160,398 |
| Total | 257 (100.0%) | $97,375 |
Household Income in Cut and Shoot
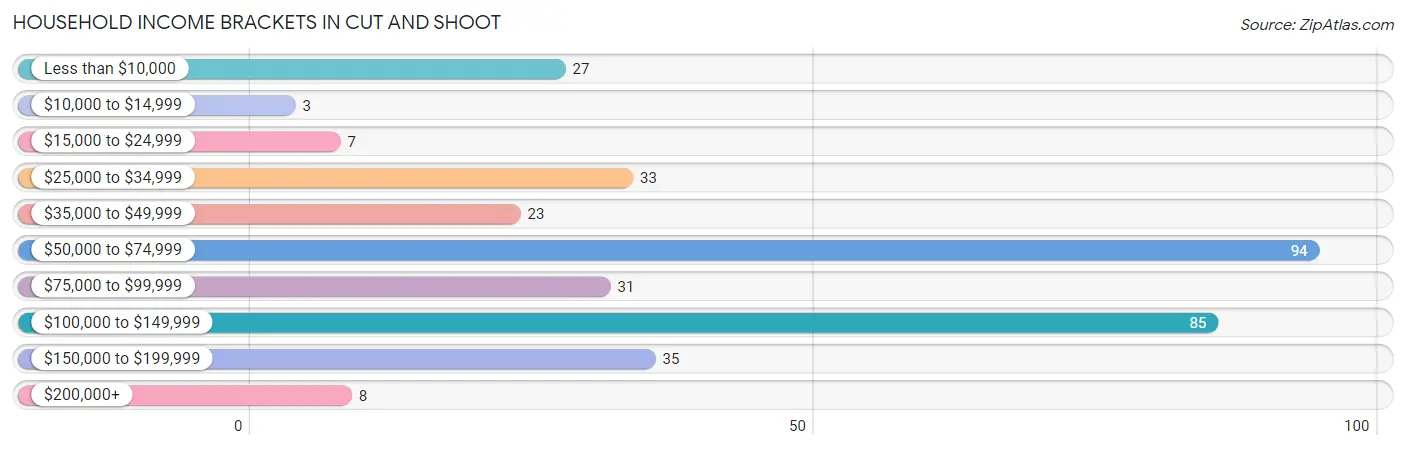
Household Income Brackets in Cut and Shoot
With 94 households falling in the category, the $50,000 to $74,999 income range is the most frequent in Cut and Shoot, accounting for 27.2% of all households. In contrast, only 3 households (0.9%) fall into the $10,000 to $14,999 income bracket, making it the least populous group.
| Income Bracket | # Households | % Households |
| Less than $10,000 | 27 | 7.8% |
| $10,000 to $14,999 | 3 | 0.9% |
| $15,000 to $24,999 | 7 | 2.0% |
| $25,000 to $34,999 | 33 | 9.5% |
| $35,000 to $49,999 | 23 | 6.6% |
| $50,000 to $74,999 | 94 | 27.2% |
| $75,000 to $99,999 | 31 | 9.0% |
| $100,000 to $149,999 | 85 | 24.6% |
| $150,000 to $199,999 | 35 | 10.1% |
| $200,000+ | 8 | 2.3% |
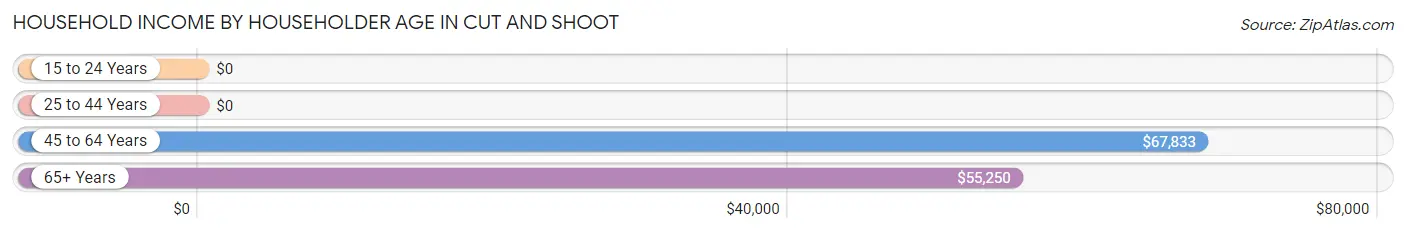
Household Income by Householder Age in Cut and Shoot
The median household income in Cut and Shoot is $69,667, with the highest median household income of $67,833 found in the 45 to 64 years age bracket for the primary householder. A total of 200 households (57.8%) fall into this category.
| Income Bracket | # Households | Median Income |
| 15 to 24 Years | 0 (0.0%) | $0 |
| 25 to 44 Years | 90 (26.0%) | $0 |
| 45 to 64 Years | 200 (57.8%) | $67,833 |
| 65+ Years | 56 (16.2%) | $55,250 |
| Total | 346 (100.0%) | $69,667 |
Poverty in Cut and Shoot
Income Below Poverty by Sex and Age in Cut and Shoot
With 5.4% poverty level for males and 8.2% for females among the residents of Cut and Shoot, 65 to 74 year old males and 16 and 17 year old females are the most vulnerable to poverty, with 3 males (17.6%) and 15 females (68.2%) in their respective age groups living below the poverty level.
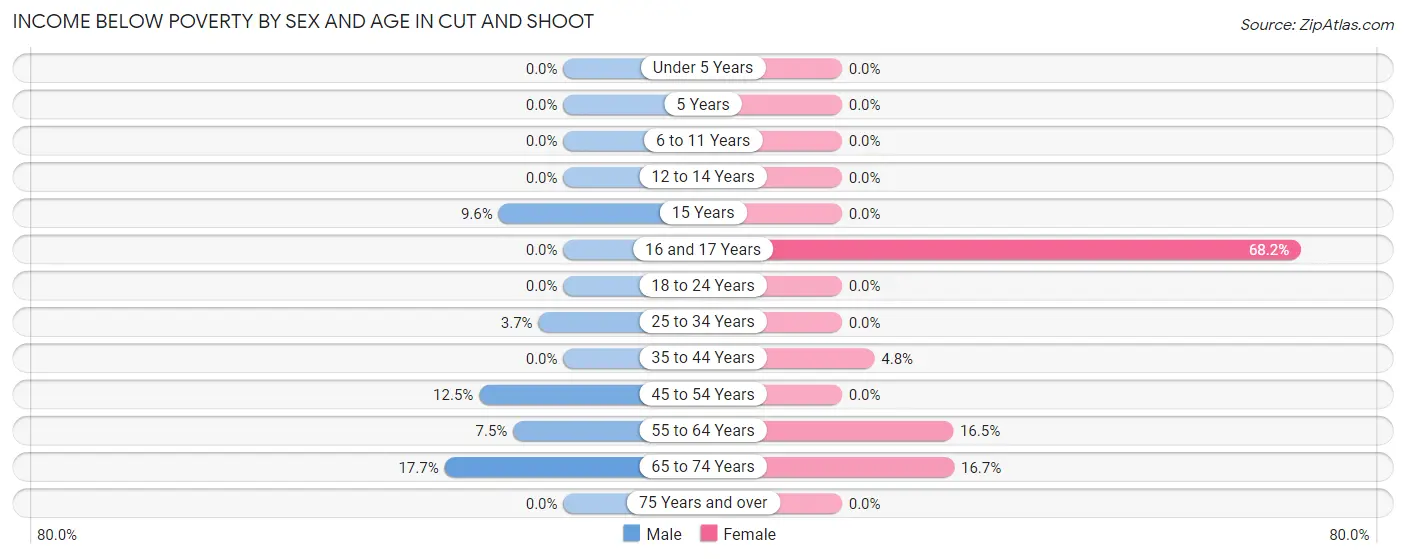
| Age Bracket | Male | Female |
| Under 5 Years | 0 (0.0%) | 0 (0.0%) |
| 5 Years | 0 (0.0%) | 0 (0.0%) |
| 6 to 11 Years | 0 (0.0%) | 0 (0.0%) |
| 12 to 14 Years | 0 (0.0%) | 0 (0.0%) |
| 15 Years | 5 (9.6%) | 0 (0.0%) |
| 16 and 17 Years | 0 (0.0%) | 15 (68.2%) |
| 18 to 24 Years | 0 (0.0%) | 0 (0.0%) |
| 25 to 34 Years | 3 (3.7%) | 0 (0.0%) |
| 35 to 44 Years | 0 (0.0%) | 3 (4.8%) |
| 45 to 54 Years | 9 (12.5%) | 0 (0.0%) |
| 55 to 64 Years | 7 (7.4%) | 18 (16.5%) |
| 65 to 74 Years | 3 (17.6%) | 5 (16.7%) |
| 75 Years and over | 0 (0.0%) | 0 (0.0%) |
| Total | 27 (5.4%) | 41 (8.2%) |
Income Above Poverty by Sex and Age in Cut and Shoot
According to the poverty statistics in Cut and Shoot, males aged under 5 years and females aged under 5 years are the age groups that are most secure financially, with 100.0% of males and 100.0% of females in these age groups living above the poverty line.
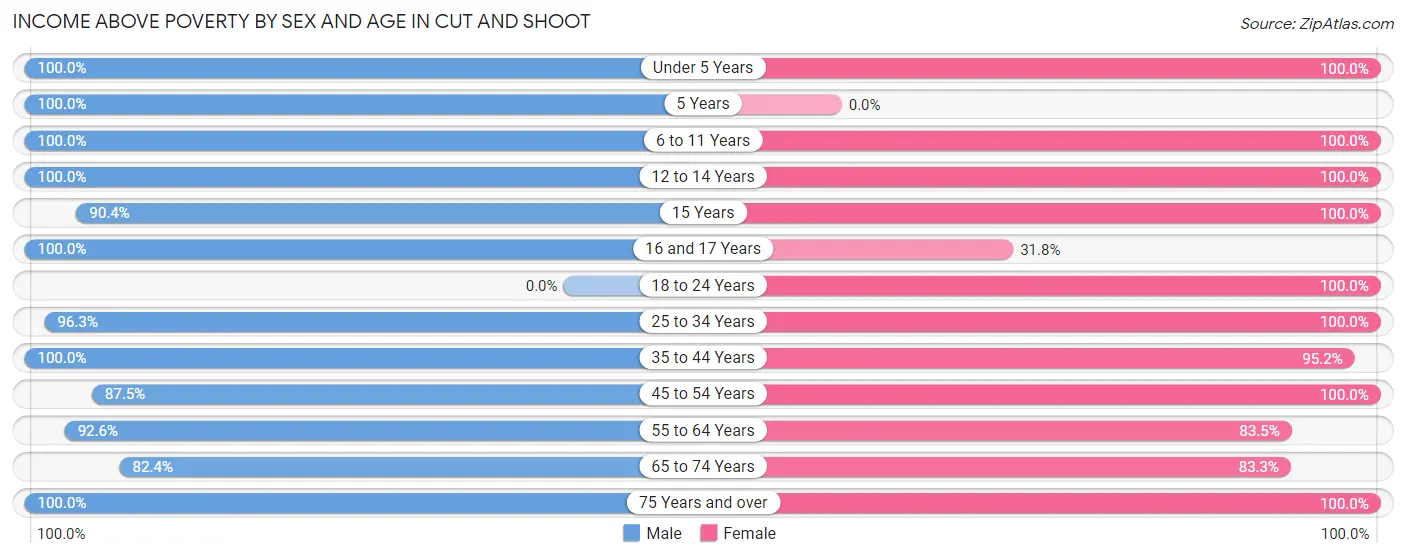
| Age Bracket | Male | Female |
| Under 5 Years | 38 (100.0%) | 14 (100.0%) |
| 5 Years | 5 (100.0%) | 0 (0.0%) |
| 6 to 11 Years | 15 (100.0%) | 16 (100.0%) |
| 12 to 14 Years | 15 (100.0%) | 42 (100.0%) |
| 15 Years | 47 (90.4%) | 5 (100.0%) |
| 16 and 17 Years | 33 (100.0%) | 7 (31.8%) |
| 18 to 24 Years | 0 (0.0%) | 47 (100.0%) |
| 25 to 34 Years | 78 (96.3%) | 55 (100.0%) |
| 35 to 44 Years | 64 (100.0%) | 59 (95.2%) |
| 45 to 54 Years | 63 (87.5%) | 72 (100.0%) |
| 55 to 64 Years | 87 (92.5%) | 91 (83.5%) |
| 65 to 74 Years | 14 (82.4%) | 25 (83.3%) |
| 75 Years and over | 16 (100.0%) | 27 (100.0%) |
| Total | 475 (94.6%) | 460 (91.8%) |
Income Below Poverty Among Married-Couple Families in Cut and Shoot
The poverty statistics for married-couple families in Cut and Shoot show that 2.1% or 5 of the total 240 families live below the poverty line. Families with 1 or 2 children have the highest poverty rate of 3.9%, comprising of 5 families. On the other hand, families with no children have the lowest poverty rate of 0.0%, which includes 0 families.
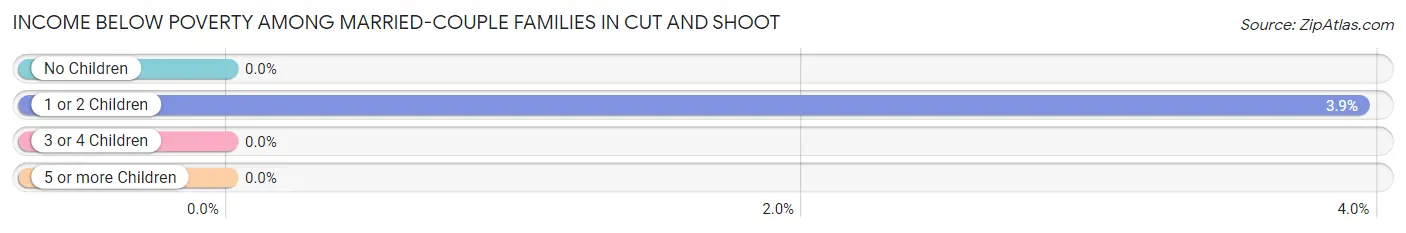
| Children | Above Poverty | Below Poverty |
| No Children | 109 (100.0%) | 0 (0.0%) |
| 1 or 2 Children | 122 (96.1%) | 5 (3.9%) |
| 3 or 4 Children | 0 (0.0%) | 0 (0.0%) |
| 5 or more Children | 4 (100.0%) | 0 (0.0%) |
| Total | 235 (97.9%) | 5 (2.1%) |
Income Below Poverty Among Single-Parent Households in Cut and Shoot
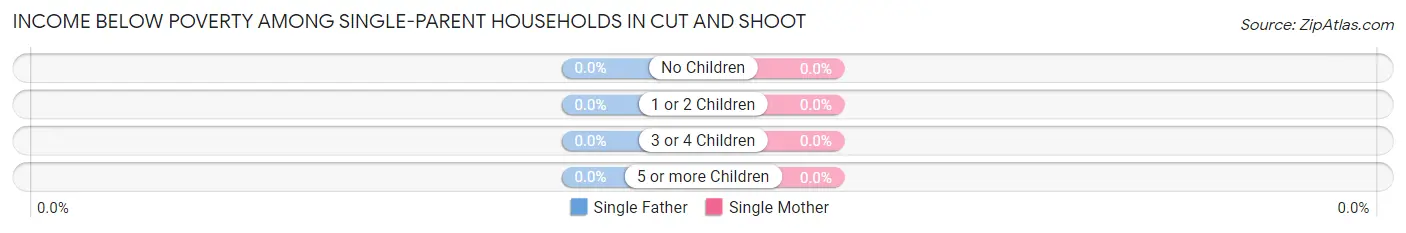
| Children | Single Father | Single Mother |
| No Children | 0 (0.0%) | 0 (0.0%) |
| 1 or 2 Children | 0 (0.0%) | 0 (0.0%) |
| 3 or 4 Children | 0 (0.0%) | 0 (0.0%) |
| 5 or more Children | 0 (0.0%) | 0 (0.0%) |
| Total | 0 (0.0%) | 0 (0.0%) |
Income Below Poverty Among Married-Couple vs Single-Parent Households in Cut and Shoot
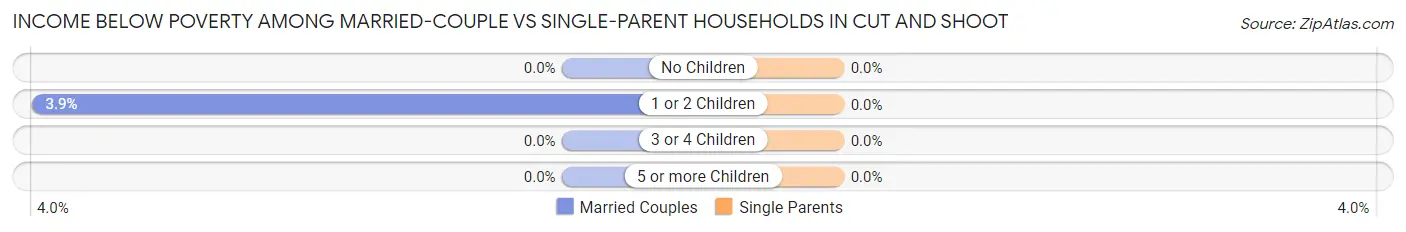
| Children | Married-Couple Families | Single-Parent Households |
| No Children | 0 (0.0%) | 0 (0.0%) |
| 1 or 2 Children | 5 (3.9%) | 0 (0.0%) |
| 3 or 4 Children | 0 (0.0%) | 0 (0.0%) |
| 5 or more Children | 0 (0.0%) | 0 (0.0%) |
| Total | 5 (2.1%) | 0 (0.0%) |
Employment Characteristics in Cut and Shoot
Employment by Class of Employer in Cut and Shoot
Among the 454 employed individuals in Cut and Shoot, private company employees (259 | 57.1%), not-for-profit organizations (87 | 19.2%), and self-employed (not incorporated) (36 | 7.9%) make up the most common classes of employment.
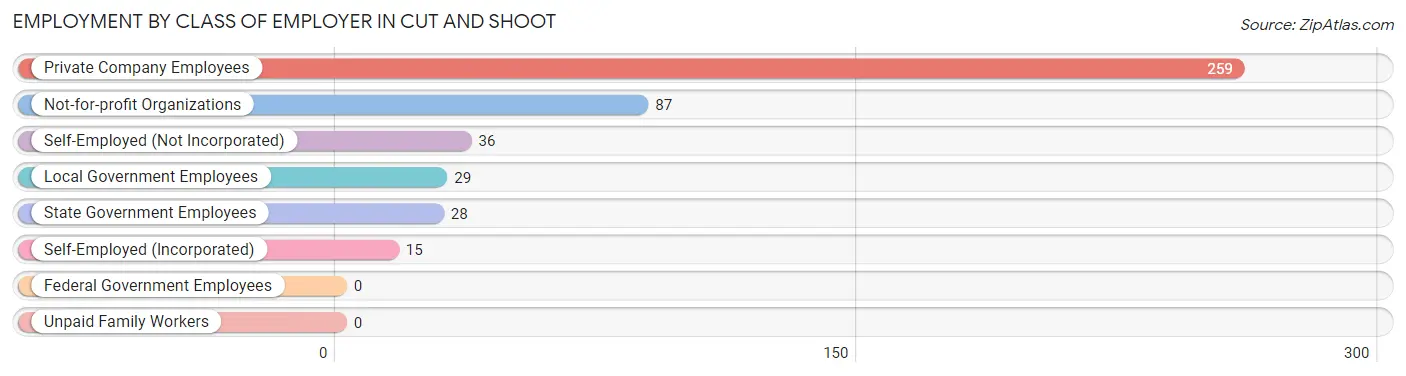
| Employer Class | # Employees | % Employees |
| Private Company Employees | 259 | 57.1% |
| Self-Employed (Incorporated) | 15 | 3.3% |
| Self-Employed (Not Incorporated) | 36 | 7.9% |
| Not-for-profit Organizations | 87 | 19.2% |
| Local Government Employees | 29 | 6.4% |
| State Government Employees | 28 | 6.2% |
| Federal Government Employees | 0 | 0.0% |
| Unpaid Family Workers | 0 | 0.0% |
| Total | 454 | 100.0% |
Employment Status by Age in Cut and Shoot
According to the labor force statistics for Cut and Shoot, out of the total population over 16 years of age (801), 58.3% or 467 individuals are in the labor force, with 1.9% or 9 of them unemployed. The age group with the highest labor force participation rate is 35 to 44 years, with 90.5% or 114 individuals in the labor force. Within the labor force, the 45 to 54 years age range has the highest percentage of unemployed individuals, with 7.3% or 9 of them being unemployed.
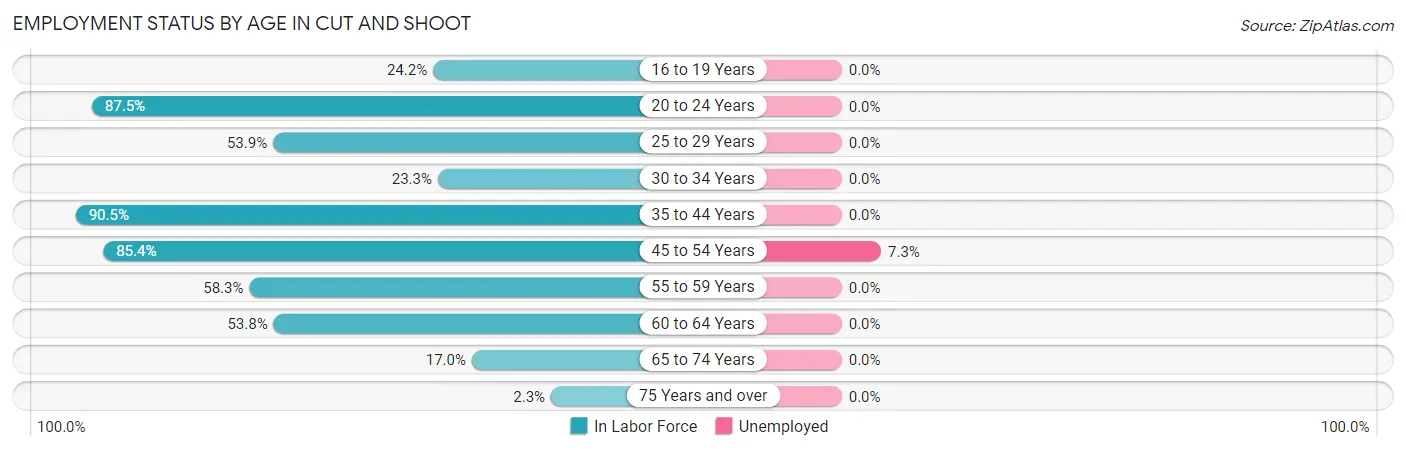
| Age Bracket | In Labor Force | Unemployed |
| 16 to 19 Years | 15 (24.2%) | 0 (0.0%) |
| 20 to 24 Years | 35 (87.5%) | 0 (0.0%) |
| 25 to 29 Years | 41 (53.9%) | 0 (0.0%) |
| 30 to 34 Years | 14 (23.3%) | 0 (0.0%) |
| 35 to 44 Years | 114 (90.5%) | 0 (0.0%) |
| 45 to 54 Years | 123 (85.4%) | 9 (7.3%) |
| 55 to 59 Years | 88 (58.3%) | 0 (0.0%) |
| 60 to 64 Years | 28 (53.8%) | 0 (0.0%) |
| 65 to 74 Years | 8 (17.0%) | 0 (0.0%) |
| 75 Years and over | 1 (2.3%) | 0 (0.0%) |
| Total | 467 (58.3%) | 9 (1.9%) |
Employment Status by Educational Attainment in Cut and Shoot
According to labor force statistics for Cut and Shoot, 67.0% of individuals (408) out of the total population between 25 and 64 years of age (609) are in the labor force, with 2.2% or 9 of them being unemployed. The group with the highest labor force participation rate are those with the educational attainment of college / associate degree, with 83.3% or 174 individuals in the labor force. Within the labor force, individuals with less than high school education have the highest percentage of unemployment, with 39.1% or 9 of them being unemployed.
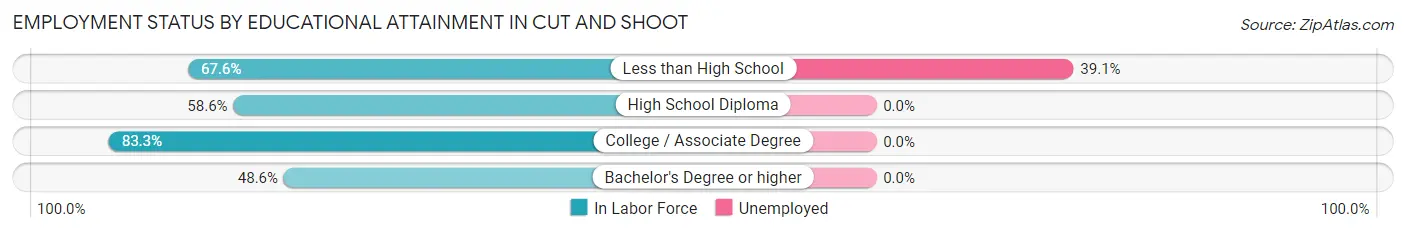
| Educational Attainment | In Labor Force | Unemployed |
| Less than High School | 23 (67.6%) | 13 (39.1%) |
| High School Diploma | 194 (58.6%) | 0 (0.0%) |
| College / Associate Degree | 174 (83.3%) | 0 (0.0%) |
| Bachelor's Degree or higher | 17 (48.6%) | 0 (0.0%) |
| Total | 408 (67.0%) | 13 (2.2%) |
Employment Occupations by Sex in Cut and Shoot
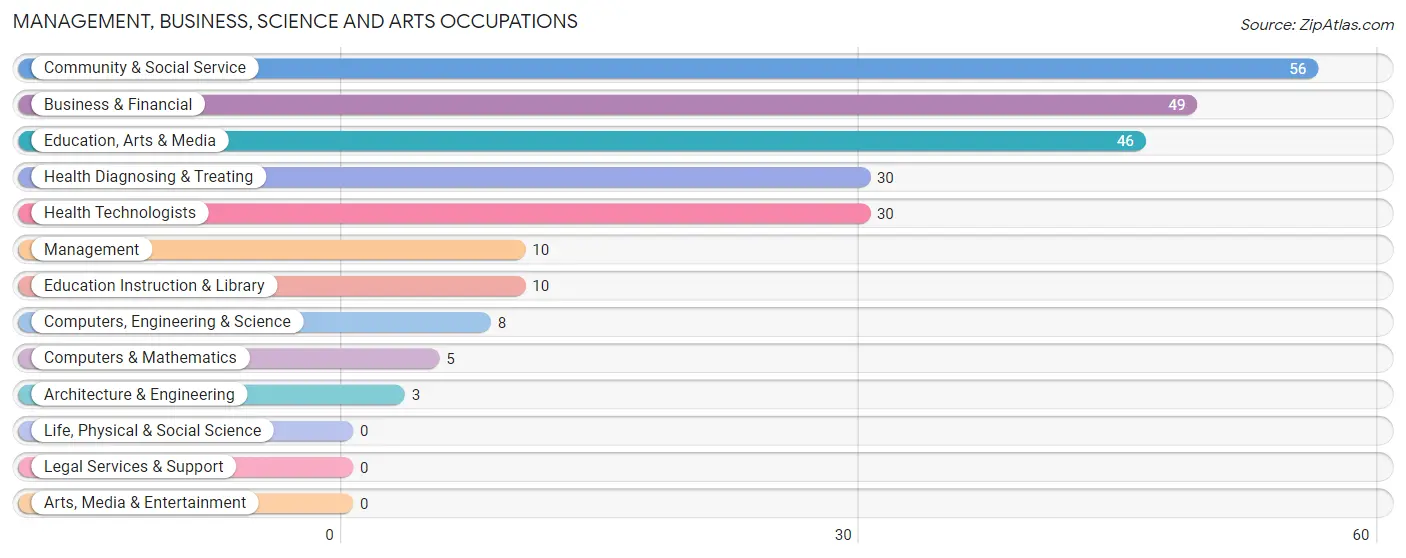
Management, Business, Science and Arts Occupations
The most common Management, Business, Science and Arts occupations in Cut and Shoot are Community & Social Service (56 | 12.2%), Business & Financial (49 | 10.7%), Education, Arts & Media (46 | 10.0%), Health Diagnosing & Treating (30 | 6.6%), and Health Technologists (30 | 6.6%).
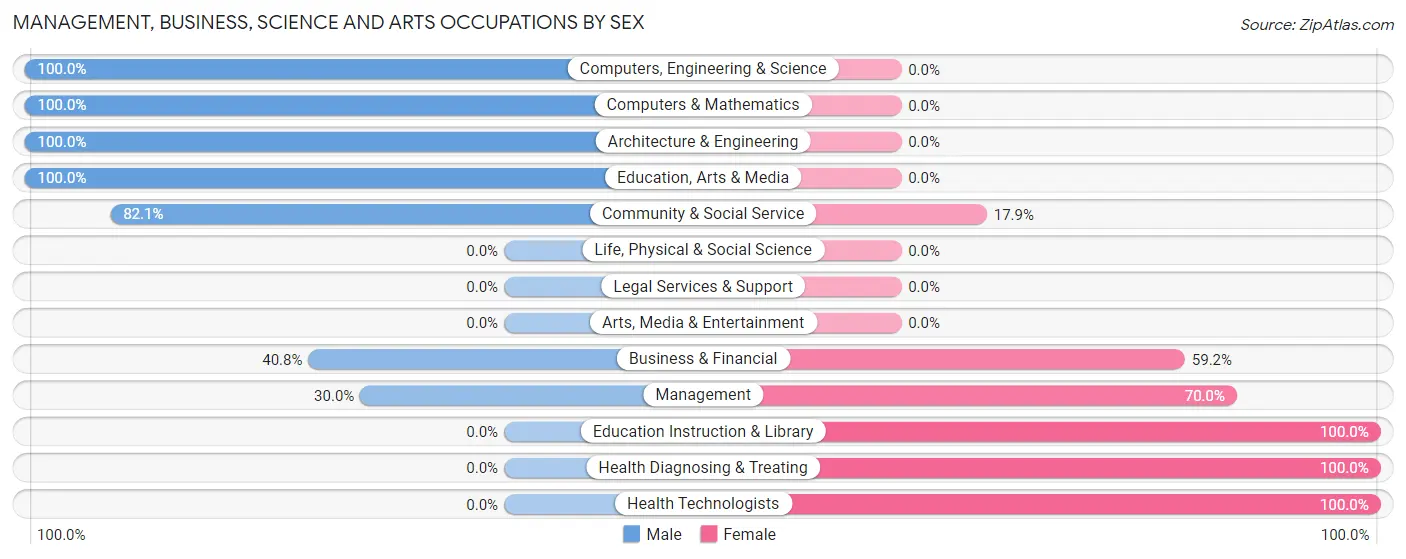
Management, Business, Science and Arts Occupations by Sex
Within the Management, Business, Science and Arts occupations in Cut and Shoot, the most male-oriented occupations are Computers, Engineering & Science (100.0%), Computers & Mathematics (100.0%), and Architecture & Engineering (100.0%), while the most female-oriented occupations are Education Instruction & Library (100.0%), Health Diagnosing & Treating (100.0%), and Health Technologists (100.0%).
| Occupation | Male | Female |
| Management | 3 (30.0%) | 7 (70.0%) |
| Business & Financial | 20 (40.8%) | 29 (59.2%) |
| Computers, Engineering & Science | 8 (100.0%) | 0 (0.0%) |
| Computers & Mathematics | 5 (100.0%) | 0 (0.0%) |
| Architecture & Engineering | 3 (100.0%) | 0 (0.0%) |
| Life, Physical & Social Science | 0 (0.0%) | 0 (0.0%) |
| Community & Social Service | 46 (82.1%) | 10 (17.9%) |
| Education, Arts & Media | 46 (100.0%) | 0 (0.0%) |
| Legal Services & Support | 0 (0.0%) | 0 (0.0%) |
| Education Instruction & Library | 0 (0.0%) | 10 (100.0%) |
| Arts, Media & Entertainment | 0 (0.0%) | 0 (0.0%) |
| Health Diagnosing & Treating | 0 (0.0%) | 30 (100.0%) |
| Health Technologists | 0 (0.0%) | 30 (100.0%) |
| Total (Category) | 77 (50.3%) | 76 (49.7%) |
| Total (Overall) | 224 (48.9%) | 234 (51.1%) |
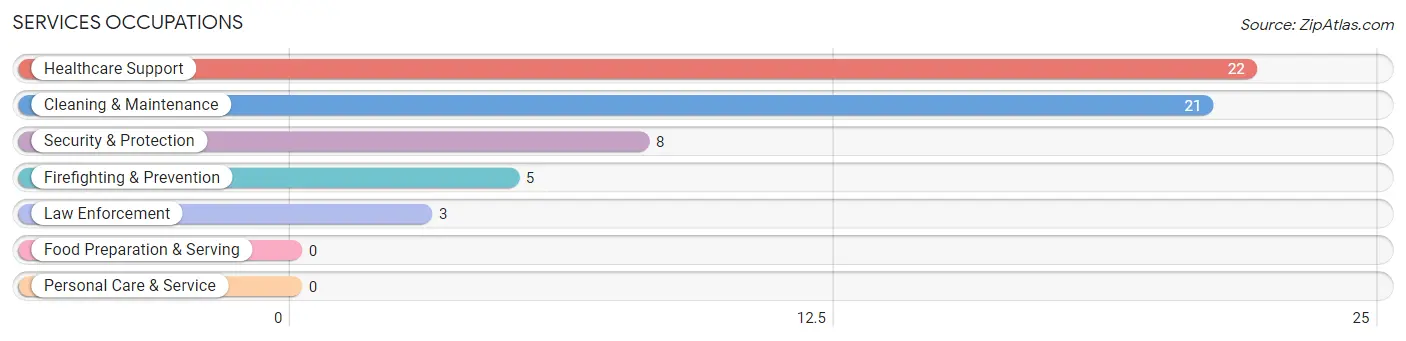
Services Occupations
The most common Services occupations in Cut and Shoot are Healthcare Support (22 | 4.8%), Cleaning & Maintenance (21 | 4.6%), Security & Protection (8 | 1.8%), Firefighting & Prevention (5 | 1.1%), and Law Enforcement (3 | 0.7%).
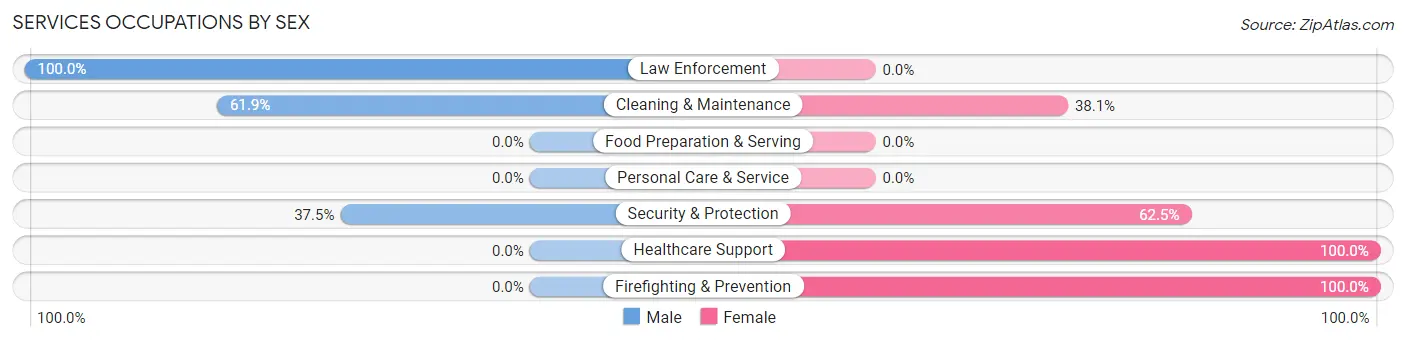
Services Occupations by Sex
Within the Services occupations in Cut and Shoot, the most male-oriented occupations are Law Enforcement (100.0%), Cleaning & Maintenance (61.9%), and Security & Protection (37.5%), while the most female-oriented occupations are Healthcare Support (100.0%), Firefighting & Prevention (100.0%), and Security & Protection (62.5%).
| Occupation | Male | Female |
| Healthcare Support | 0 (0.0%) | 22 (100.0%) |
| Security & Protection | 3 (37.5%) | 5 (62.5%) |
| Firefighting & Prevention | 0 (0.0%) | 5 (100.0%) |
| Law Enforcement | 3 (100.0%) | 0 (0.0%) |
| Food Preparation & Serving | 0 (0.0%) | 0 (0.0%) |
| Cleaning & Maintenance | 13 (61.9%) | 8 (38.1%) |
| Personal Care & Service | 0 (0.0%) | 0 (0.0%) |
| Total (Category) | 16 (31.4%) | 35 (68.6%) |
| Total (Overall) | 224 (48.9%) | 234 (51.1%) |
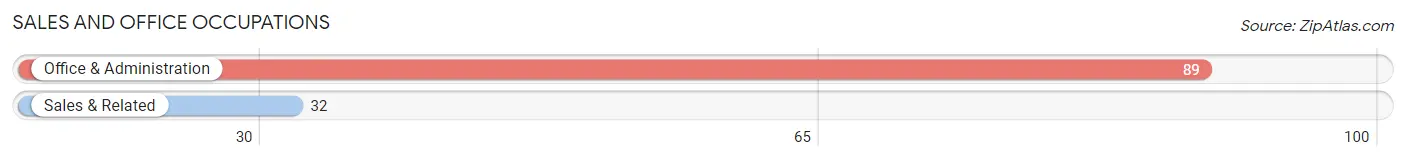
Sales and Office Occupations
The most common Sales and Office occupations in Cut and Shoot are Office & Administration (89 | 19.4%), and Sales & Related (32 | 7.0%).
Sales and Office Occupations by Sex
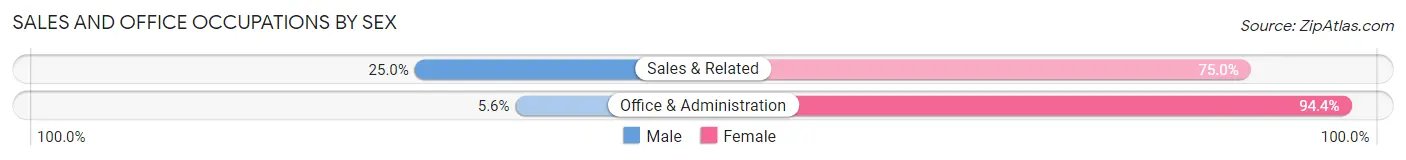
| Occupation | Male | Female |
| Sales & Related | 8 (25.0%) | 24 (75.0%) |
| Office & Administration | 5 (5.6%) | 84 (94.4%) |
| Total (Category) | 13 (10.7%) | 108 (89.3%) |
| Total (Overall) | 224 (48.9%) | 234 (51.1%) |
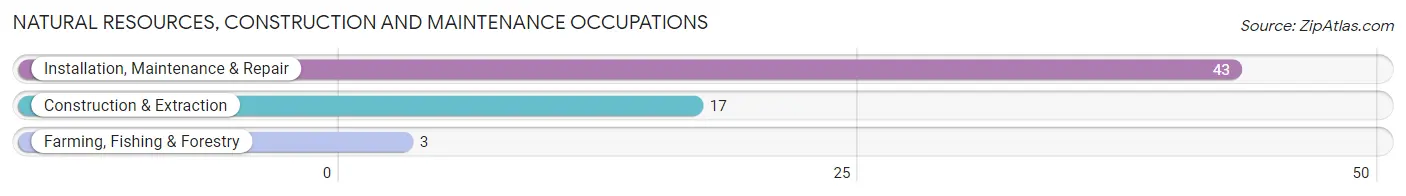
Natural Resources, Construction and Maintenance Occupations
The most common Natural Resources, Construction and Maintenance occupations in Cut and Shoot are Installation, Maintenance & Repair (43 | 9.4%), Construction & Extraction (17 | 3.7%), and Farming, Fishing & Forestry (3 | 0.7%).
Natural Resources, Construction and Maintenance Occupations by Sex
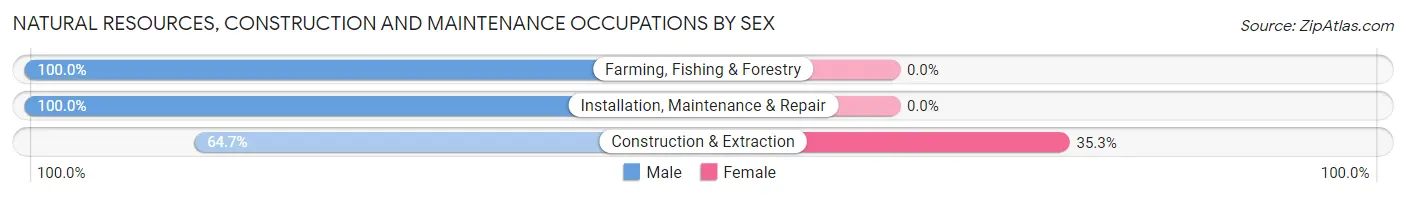
| Occupation | Male | Female |
| Farming, Fishing & Forestry | 3 (100.0%) | 0 (0.0%) |
| Construction & Extraction | 11 (64.7%) | 6 (35.3%) |
| Installation, Maintenance & Repair | 43 (100.0%) | 0 (0.0%) |
| Total (Category) | 57 (90.5%) | 6 (9.5%) |
| Total (Overall) | 224 (48.9%) | 234 (51.1%) |
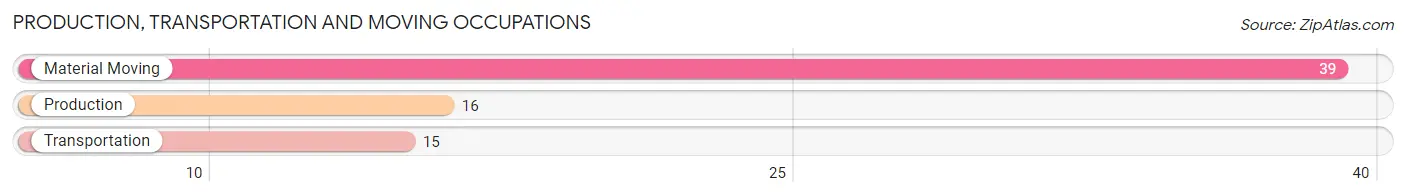
Production, Transportation and Moving Occupations
The most common Production, Transportation and Moving occupations in Cut and Shoot are Material Moving (39 | 8.5%), Production (16 | 3.5%), and Transportation (15 | 3.3%).
Production, Transportation and Moving Occupations by Sex
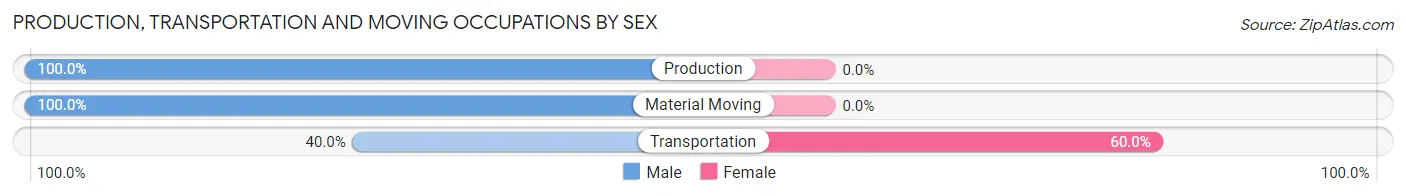
| Occupation | Male | Female |
| Production | 16 (100.0%) | 0 (0.0%) |
| Transportation | 6 (40.0%) | 9 (60.0%) |
| Material Moving | 39 (100.0%) | 0 (0.0%) |
| Total (Category) | 61 (87.1%) | 9 (12.9%) |
| Total (Overall) | 224 (48.9%) | 234 (51.1%) |
Employment Industries by Sex in Cut and Shoot
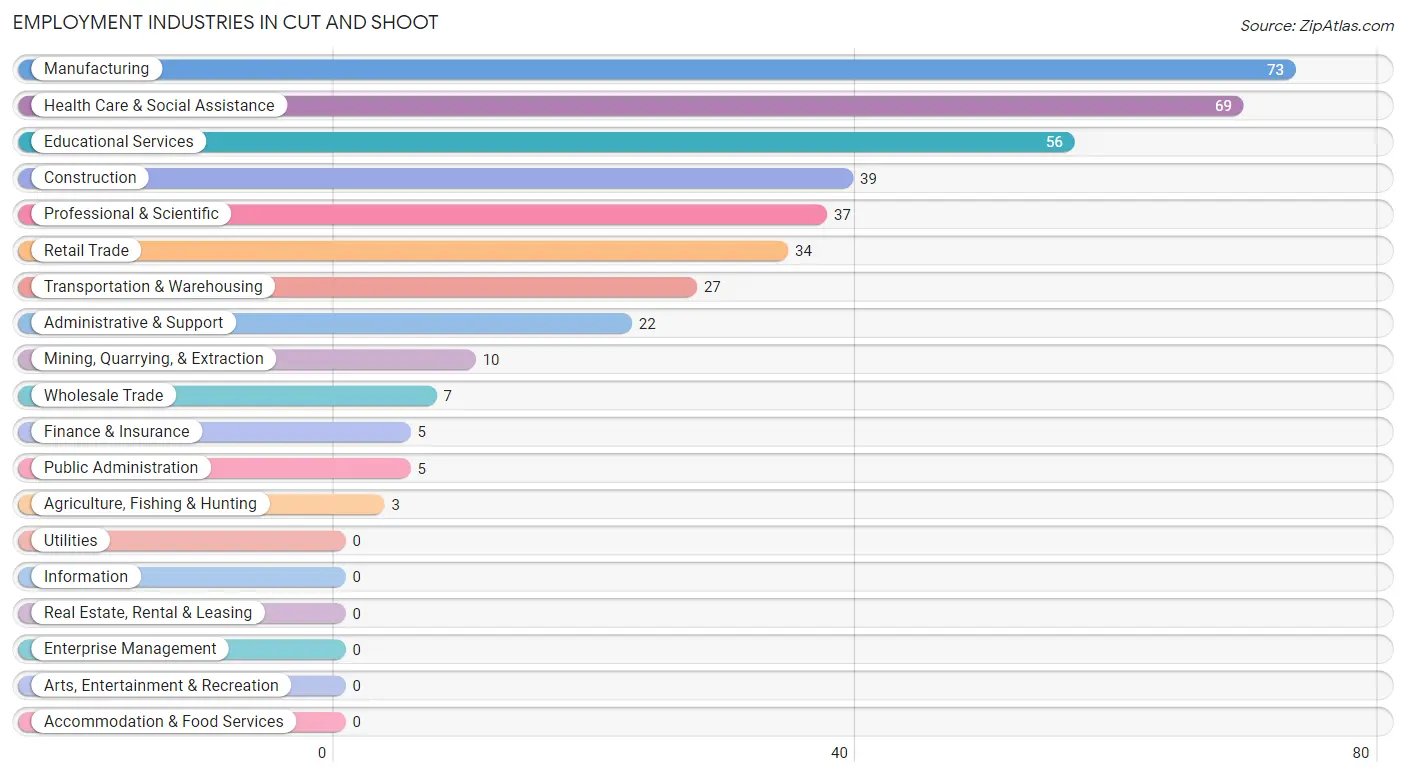
Employment Industries in Cut and Shoot
The major employment industries in Cut and Shoot include Manufacturing (73 | 15.9%), Health Care & Social Assistance (69 | 15.1%), Educational Services (56 | 12.2%), Construction (39 | 8.5%), and Professional & Scientific (37 | 8.1%).
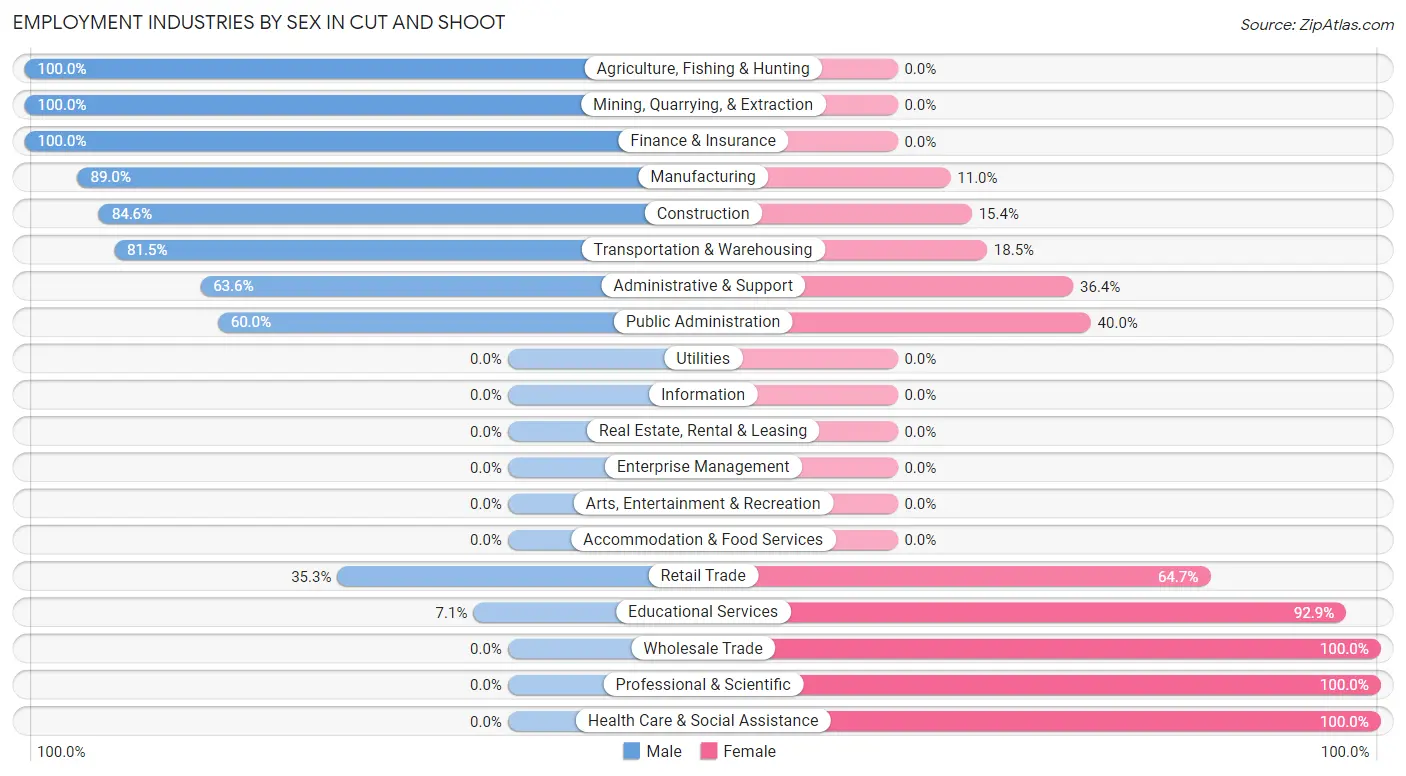
Employment Industries by Sex in Cut and Shoot
The Cut and Shoot industries that see more men than women are Agriculture, Fishing & Hunting (100.0%), Mining, Quarrying, & Extraction (100.0%), and Finance & Insurance (100.0%), whereas the industries that tend to have a higher number of women are Wholesale Trade (100.0%), Professional & Scientific (100.0%), and Health Care & Social Assistance (100.0%).
| Industry | Male | Female |
| Agriculture, Fishing & Hunting | 3 (100.0%) | 0 (0.0%) |
| Mining, Quarrying, & Extraction | 10 (100.0%) | 0 (0.0%) |
| Construction | 33 (84.6%) | 6 (15.4%) |
| Manufacturing | 65 (89.0%) | 8 (11.0%) |
| Wholesale Trade | 0 (0.0%) | 7 (100.0%) |
| Retail Trade | 12 (35.3%) | 22 (64.7%) |
| Transportation & Warehousing | 22 (81.5%) | 5 (18.5%) |
| Utilities | 0 (0.0%) | 0 (0.0%) |
| Information | 0 (0.0%) | 0 (0.0%) |
| Finance & Insurance | 5 (100.0%) | 0 (0.0%) |
| Real Estate, Rental & Leasing | 0 (0.0%) | 0 (0.0%) |
| Professional & Scientific | 0 (0.0%) | 37 (100.0%) |
| Enterprise Management | 0 (0.0%) | 0 (0.0%) |
| Administrative & Support | 14 (63.6%) | 8 (36.4%) |
| Educational Services | 4 (7.1%) | 52 (92.9%) |
| Health Care & Social Assistance | 0 (0.0%) | 69 (100.0%) |
| Arts, Entertainment & Recreation | 0 (0.0%) | 0 (0.0%) |
| Accommodation & Food Services | 0 (0.0%) | 0 (0.0%) |
| Public Administration | 3 (60.0%) | 2 (40.0%) |
| Total | 224 (48.9%) | 234 (51.1%) |
Education in Cut and Shoot
School Enrollment in Cut and Shoot
The most common levels of schooling among the 189 students in Cut and Shoot are high school (109 | 57.7%), middle school (36 | 19.1%), and college / undergraduate (20 | 10.6%).
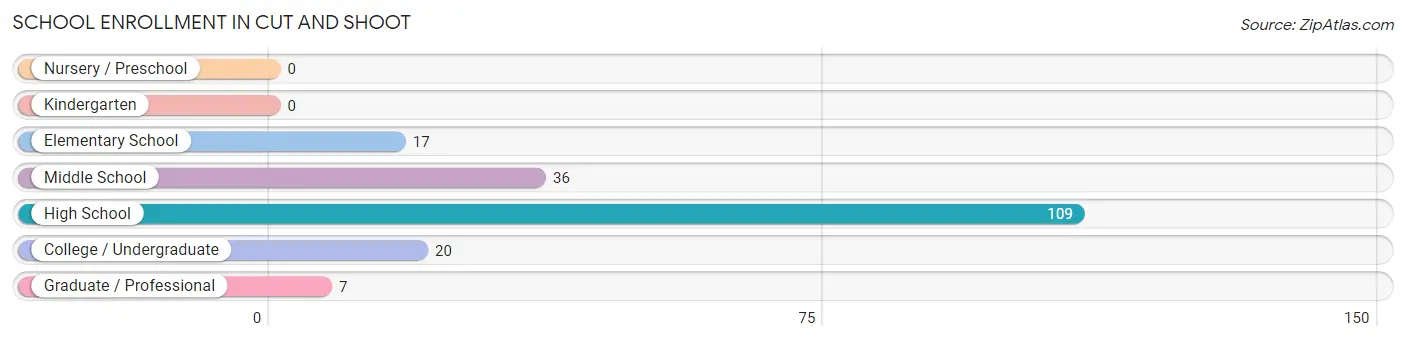
| School Level | # Students | % Students |
| Nursery / Preschool | 0 | 0.0% |
| Kindergarten | 0 | 0.0% |
| Elementary School | 17 | 9.0% |
| Middle School | 36 | 19.1% |
| High School | 109 | 57.7% |
| College / Undergraduate | 20 | 10.6% |
| Graduate / Professional | 7 | 3.7% |
| Total | 189 | 100.0% |
School Enrollment by Age by Funding Source in Cut and Shoot
Out of a total of 189 students who are enrolled in schools in Cut and Shoot, 18 (9.5%) attend a private institution, while the remaining 171 (90.5%) are enrolled in public schools. The age group of 5 to 9 year old has the highest likelihood of being enrolled in private schools, with 7 (58.3% in the age bracket) enrolled. Conversely, the age group of 18 to 19 year olds has the lowest likelihood of being enrolled in a private school, with 7 (100.0% in the age bracket) attending a public institution.
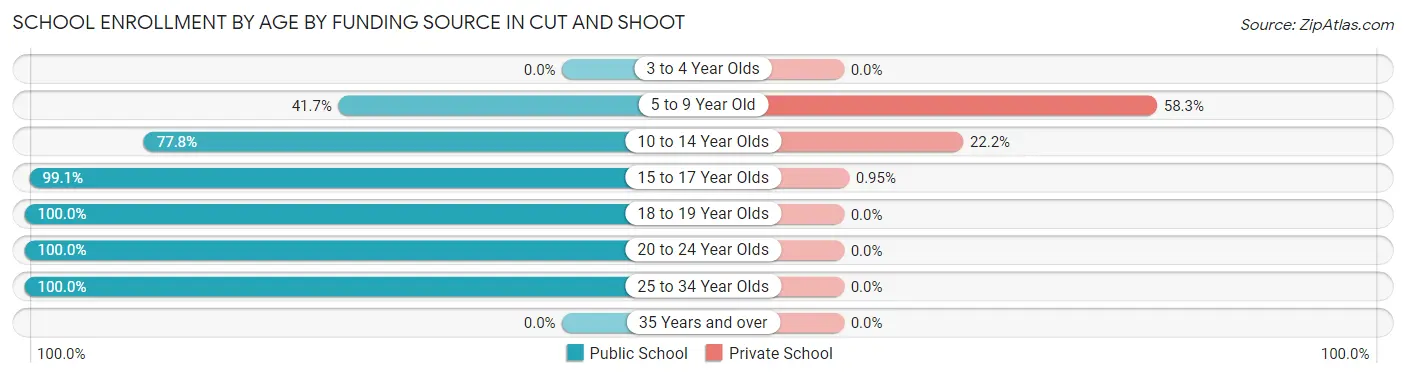
| Age Bracket | Public School | Private School |
| 3 to 4 Year Olds | 0 (0.0%) | 0 (0.0%) |
| 5 to 9 Year Old | 5 (41.7%) | 7 (58.3%) |
| 10 to 14 Year Olds | 35 (77.8%) | 10 (22.2%) |
| 15 to 17 Year Olds | 104 (99.1%) | 1 (0.9%) |
| 18 to 19 Year Olds | 7 (100.0%) | 0 (0.0%) |
| 20 to 24 Year Olds | 5 (100.0%) | 0 (0.0%) |
| 25 to 34 Year Olds | 15 (100.0%) | 0 (0.0%) |
| 35 Years and over | 0 (0.0%) | 0 (0.0%) |
| Total | 171 (90.5%) | 18 (9.5%) |
Educational Attainment by Field of Study in Cut and Shoot
Science & technology (14 | 36.8%), education (11 | 28.9%), multidisciplinary studies (5 | 13.2%), visual & performing arts (4 | 10.5%), and social sciences (2 | 5.3%) are the most common fields of study among 38 individuals in Cut and Shoot who have obtained a bachelor's degree or higher.
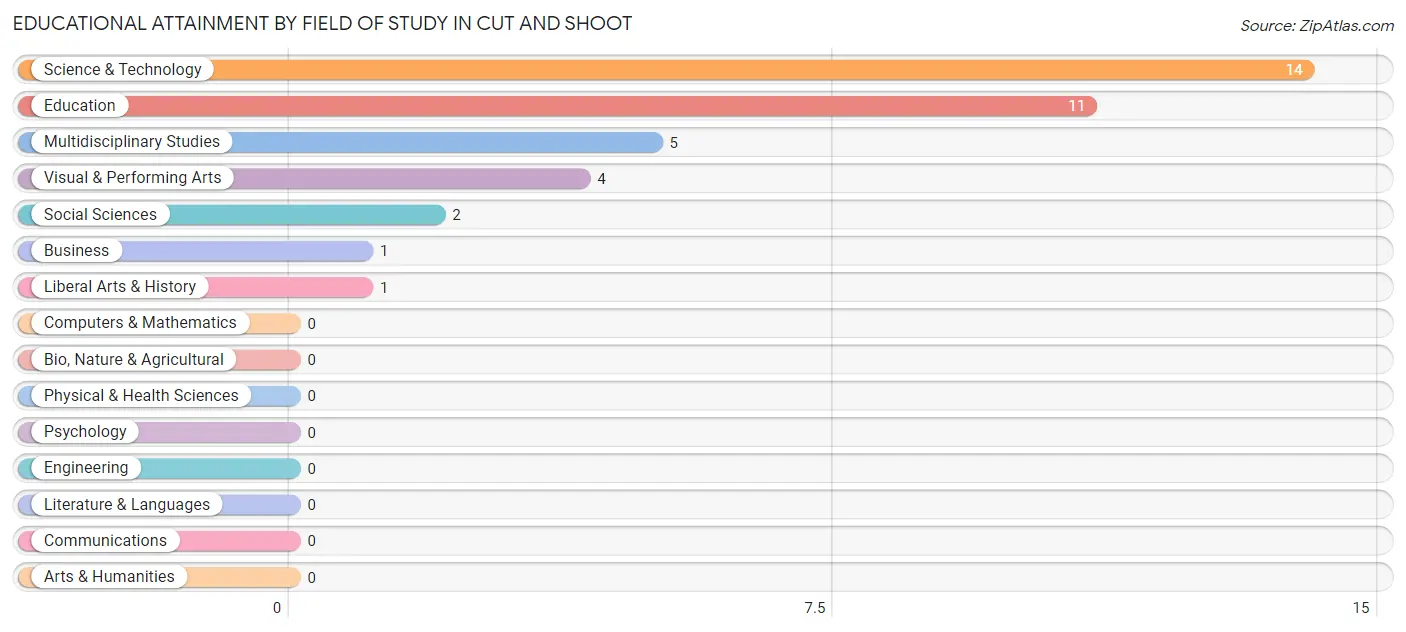
| Field of Study | # Graduates | % Graduates |
| Computers & Mathematics | 0 | 0.0% |
| Bio, Nature & Agricultural | 0 | 0.0% |
| Physical & Health Sciences | 0 | 0.0% |
| Psychology | 0 | 0.0% |
| Social Sciences | 2 | 5.3% |
| Engineering | 0 | 0.0% |
| Multidisciplinary Studies | 5 | 13.2% |
| Science & Technology | 14 | 36.8% |
| Business | 1 | 2.6% |
| Education | 11 | 28.9% |
| Literature & Languages | 0 | 0.0% |
| Liberal Arts & History | 1 | 2.6% |
| Visual & Performing Arts | 4 | 10.5% |
| Communications | 0 | 0.0% |
| Arts & Humanities | 0 | 0.0% |
| Total | 38 | 100.0% |
Transportation & Commute in Cut and Shoot
Vehicle Availability by Sex in Cut and Shoot
The most prevalent vehicle ownership categories in Cut and Shoot are males with 2 vehicles (102, accounting for 45.5%) and females with 2 vehicles (66, making up 44.4%).
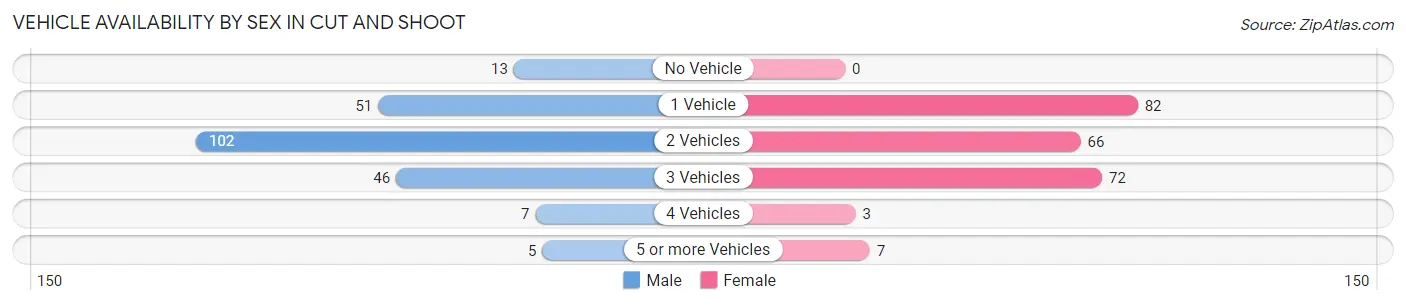
| Vehicles Available | Male | Female |
| No Vehicle | 13 (5.8%) | 0 (0.0%) |
| 1 Vehicle | 51 (22.8%) | 82 (35.6%) |
| 2 Vehicles | 102 (45.5%) | 66 (28.7%) |
| 3 Vehicles | 46 (20.5%) | 72 (31.3%) |
| 4 Vehicles | 7 (3.1%) | 3 (1.3%) |
| 5 or more Vehicles | 5 (2.2%) | 7 (3.0%) |
| Total | 224 (100.0%) | 230 (100.0%) |
Commute Time in Cut and Shoot
The most frequently occuring commute durations in Cut and Shoot are 5 to 9 minutes (73 commuters, 16.4%), 30 to 34 minutes (68 commuters, 15.3%), and 60 to 89 minutes (58 commuters, 13.1%).
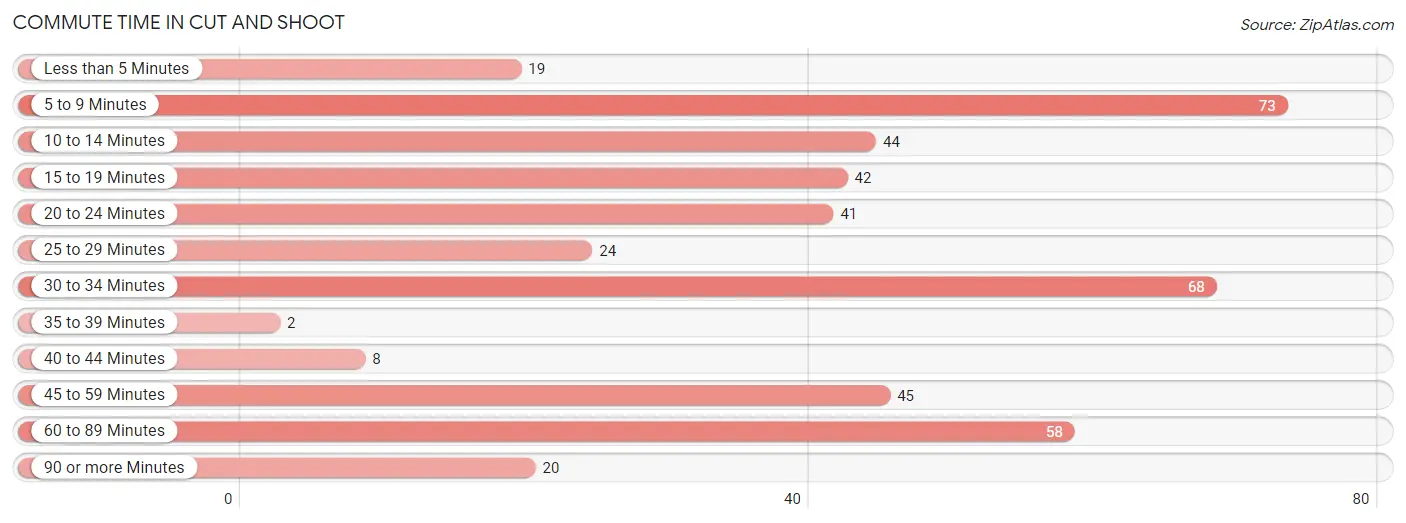
| Commute Time | # Commuters | % Commuters |
| Less than 5 Minutes | 19 | 4.3% |
| 5 to 9 Minutes | 73 | 16.4% |
| 10 to 14 Minutes | 44 | 9.9% |
| 15 to 19 Minutes | 42 | 9.5% |
| 20 to 24 Minutes | 41 | 9.2% |
| 25 to 29 Minutes | 24 | 5.4% |
| 30 to 34 Minutes | 68 | 15.3% |
| 35 to 39 Minutes | 2 | 0.4% |
| 40 to 44 Minutes | 8 | 1.8% |
| 45 to 59 Minutes | 45 | 10.1% |
| 60 to 89 Minutes | 58 | 13.1% |
| 90 or more Minutes | 20 | 4.5% |
Commute Time by Sex in Cut and Shoot
The most common commute times in Cut and Shoot are 10 to 14 minutes (39 commuters, 17.6%) for males and 30 to 34 minutes (58 commuters, 26.0%) for females.
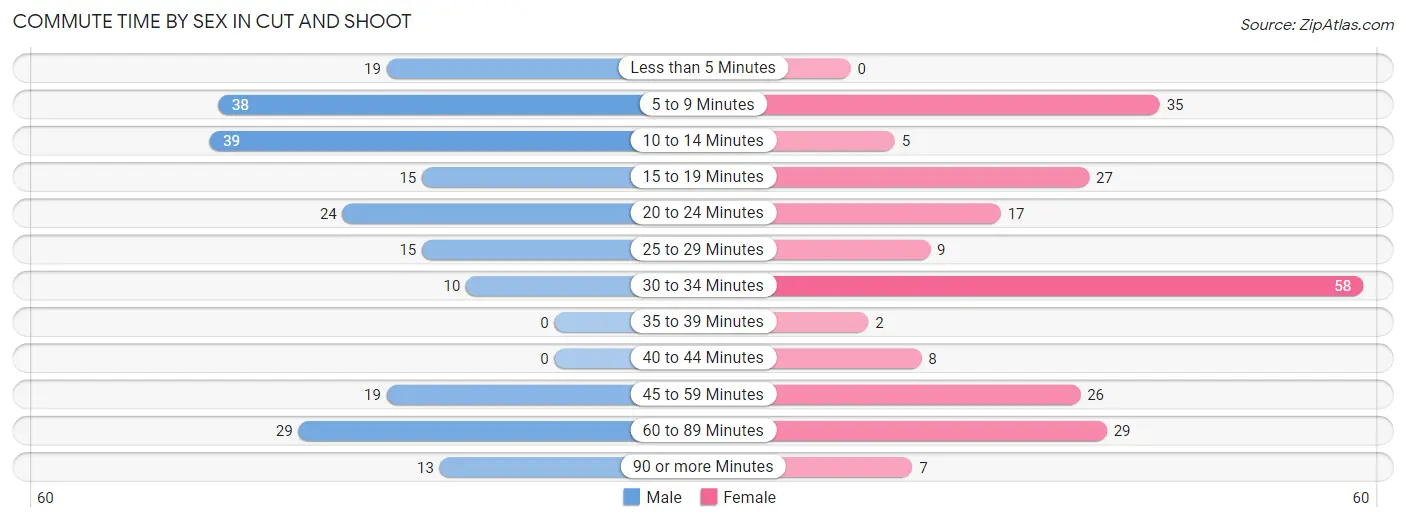
| Commute Time | Male | Female |
| Less than 5 Minutes | 19 (8.6%) | 0 (0.0%) |
| 5 to 9 Minutes | 38 (17.2%) | 35 (15.7%) |
| 10 to 14 Minutes | 39 (17.6%) | 5 (2.2%) |
| 15 to 19 Minutes | 15 (6.8%) | 27 (12.1%) |
| 20 to 24 Minutes | 24 (10.9%) | 17 (7.6%) |
| 25 to 29 Minutes | 15 (6.8%) | 9 (4.0%) |
| 30 to 34 Minutes | 10 (4.5%) | 58 (26.0%) |
| 35 to 39 Minutes | 0 (0.0%) | 2 (0.9%) |
| 40 to 44 Minutes | 0 (0.0%) | 8 (3.6%) |
| 45 to 59 Minutes | 19 (8.6%) | 26 (11.7%) |
| 60 to 89 Minutes | 29 (13.1%) | 29 (13.0%) |
| 90 or more Minutes | 13 (5.9%) | 7 (3.1%) |
Time of Departure to Work by Sex in Cut and Shoot
The most frequent times of departure to work in Cut and Shoot are 6:30 AM to 6:59 AM (47, 21.3%) for males and 8:00 AM to 8:29 AM (69, 30.9%) for females.
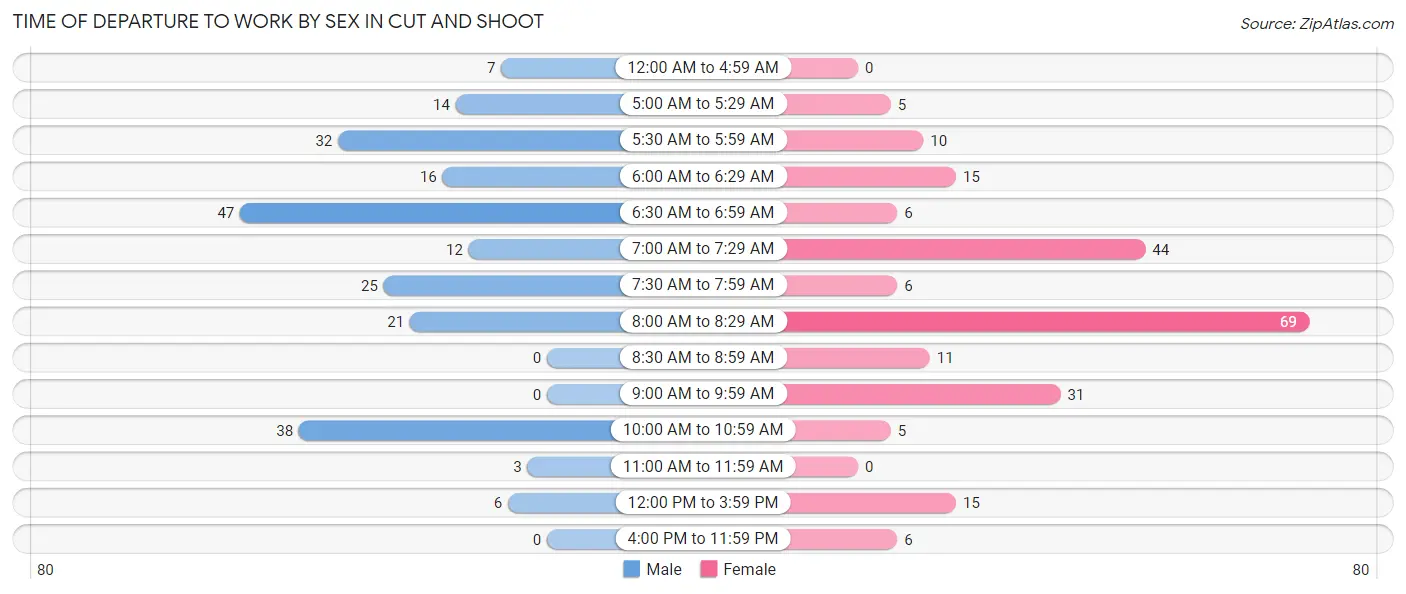
| Time of Departure | Male | Female |
| 12:00 AM to 4:59 AM | 7 (3.2%) | 0 (0.0%) |
| 5:00 AM to 5:29 AM | 14 (6.3%) | 5 (2.2%) |
| 5:30 AM to 5:59 AM | 32 (14.5%) | 10 (4.5%) |
| 6:00 AM to 6:29 AM | 16 (7.2%) | 15 (6.7%) |
| 6:30 AM to 6:59 AM | 47 (21.3%) | 6 (2.7%) |
| 7:00 AM to 7:29 AM | 12 (5.4%) | 44 (19.7%) |
| 7:30 AM to 7:59 AM | 25 (11.3%) | 6 (2.7%) |
| 8:00 AM to 8:29 AM | 21 (9.5%) | 69 (30.9%) |
| 8:30 AM to 8:59 AM | 0 (0.0%) | 11 (4.9%) |
| 9:00 AM to 9:59 AM | 0 (0.0%) | 31 (13.9%) |
| 10:00 AM to 10:59 AM | 38 (17.2%) | 5 (2.2%) |
| 11:00 AM to 11:59 AM | 3 (1.4%) | 0 (0.0%) |
| 12:00 PM to 3:59 PM | 6 (2.7%) | 15 (6.7%) |
| 4:00 PM to 11:59 PM | 0 (0.0%) | 6 (2.7%) |
| Total | 221 (100.0%) | 223 (100.0%) |
Housing Occupancy in Cut and Shoot
Occupancy by Ownership in Cut and Shoot
Of the total 346 dwellings in Cut and Shoot, owner-occupied units account for 327 (94.5%), while renter-occupied units make up 19 (5.5%).
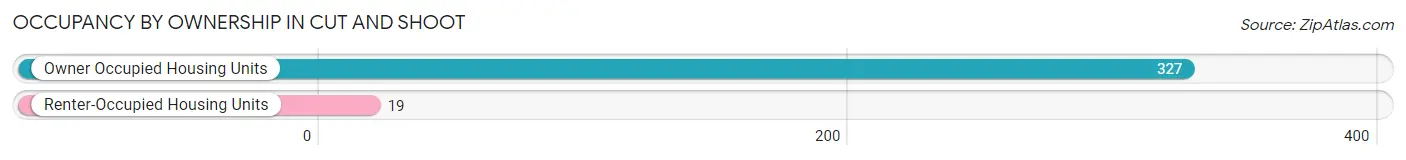
| Occupancy | # Housing Units | % Housing Units |
| Owner Occupied Housing Units | 327 | 94.5% |
| Renter-Occupied Housing Units | 19 | 5.5% |
| Total Occupied Housing Units | 346 | 100.0% |
Occupancy by Household Size in Cut and Shoot
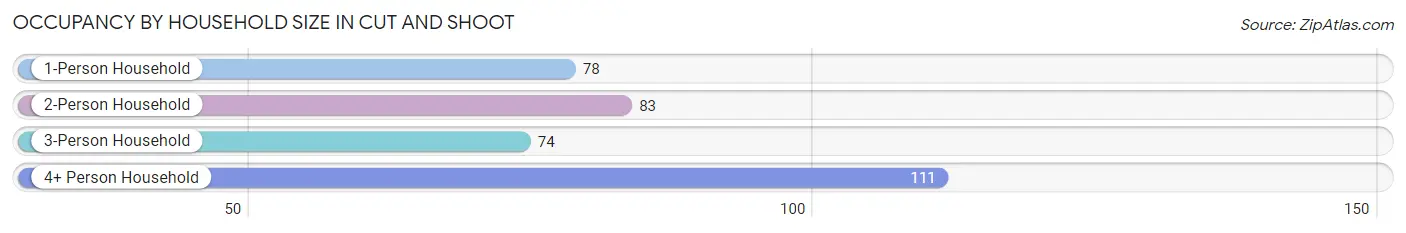
| Household Size | # Housing Units | % Housing Units |
| 1-Person Household | 78 | 22.5% |
| 2-Person Household | 83 | 24.0% |
| 3-Person Household | 74 | 21.4% |
| 4+ Person Household | 111 | 32.1% |
| Total Housing Units | 346 | 100.0% |
Occupancy by Ownership by Household Size in Cut and Shoot
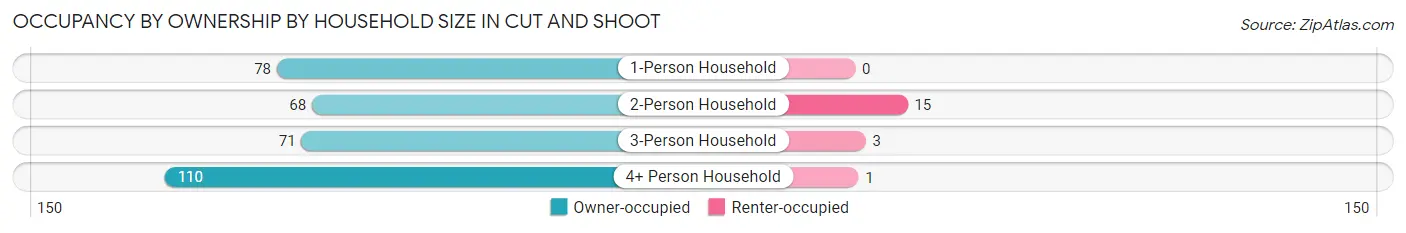
| Household Size | Owner-occupied | Renter-occupied |
| 1-Person Household | 78 (100.0%) | 0 (0.0%) |
| 2-Person Household | 68 (81.9%) | 15 (18.1%) |
| 3-Person Household | 71 (96.0%) | 3 (4.1%) |
| 4+ Person Household | 110 (99.1%) | 1 (0.9%) |
| Total Housing Units | 327 (94.5%) | 19 (5.5%) |
Occupancy by Educational Attainment in Cut and Shoot
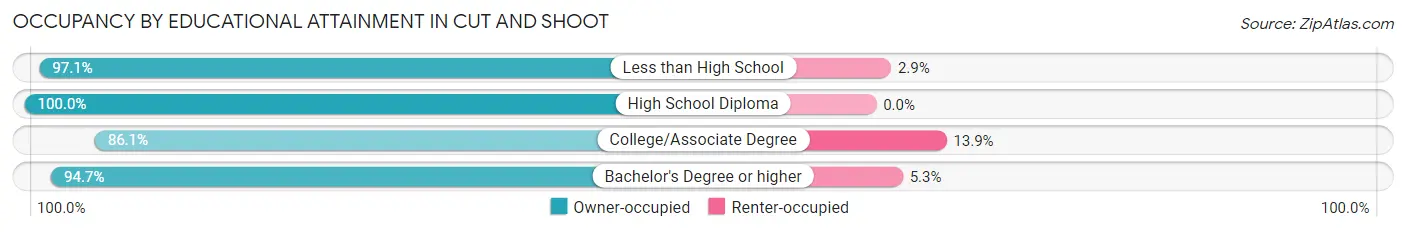
| Household Size | Owner-occupied | Renter-occupied |
| Less than High School | 33 (97.1%) | 1 (2.9%) |
| High School Diploma | 171 (100.0%) | 0 (0.0%) |
| College/Associate Degree | 105 (86.1%) | 17 (13.9%) |
| Bachelor's Degree or higher | 18 (94.7%) | 1 (5.3%) |
Occupancy by Age of Householder in Cut and Shoot
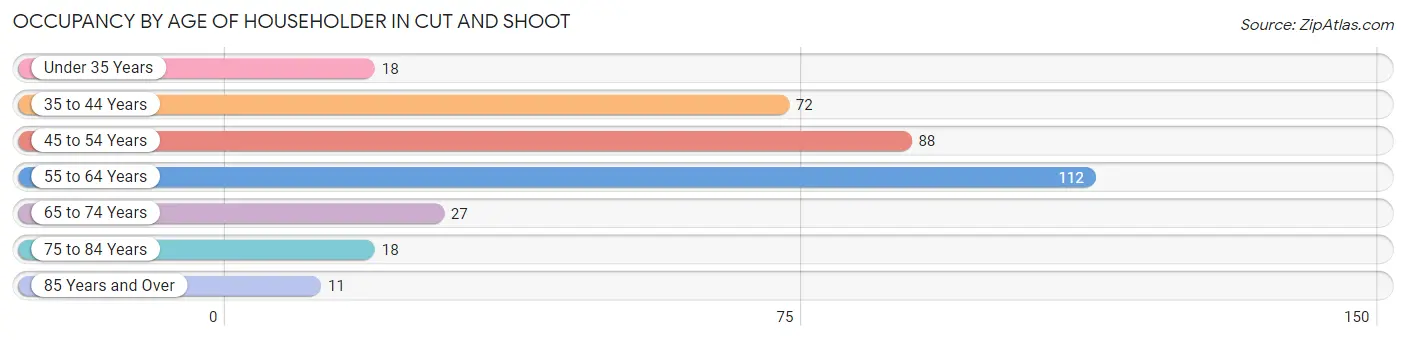
| Age Bracket | # Households | % Households |
| Under 35 Years | 18 | 5.2% |
| 35 to 44 Years | 72 | 20.8% |
| 45 to 54 Years | 88 | 25.4% |
| 55 to 64 Years | 112 | 32.4% |
| 65 to 74 Years | 27 | 7.8% |
| 75 to 84 Years | 18 | 5.2% |
| 85 Years and Over | 11 | 3.2% |
| Total | 346 | 100.0% |
Housing Finances in Cut and Shoot
Median Income by Occupancy in Cut and Shoot
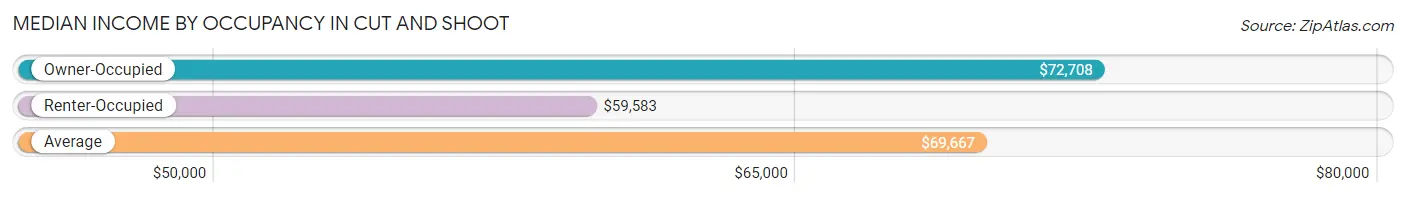
| Occupancy Type | # Households | Median Income |
| Owner-Occupied | 327 (94.5%) | $72,708 |
| Renter-Occupied | 19 (5.5%) | $59,583 |
| Average | 346 (100.0%) | $69,667 |
Occupancy by Householder Income Bracket in Cut and Shoot
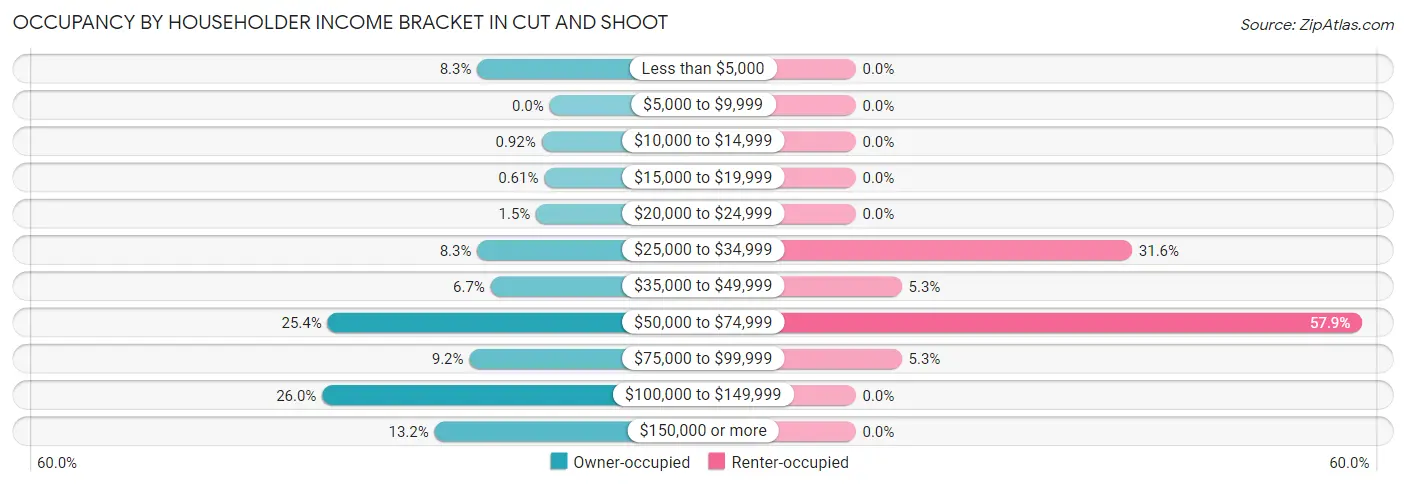
| Income Bracket | Owner-occupied | Renter-occupied |
| Less than $5,000 | 27 (8.3%) | 0 (0.0%) |
| $5,000 to $9,999 | 0 (0.0%) | 0 (0.0%) |
| $10,000 to $14,999 | 3 (0.9%) | 0 (0.0%) |
| $15,000 to $19,999 | 2 (0.6%) | 0 (0.0%) |
| $20,000 to $24,999 | 5 (1.5%) | 0 (0.0%) |
| $25,000 to $34,999 | 27 (8.3%) | 6 (31.6%) |
| $35,000 to $49,999 | 22 (6.7%) | 1 (5.3%) |
| $50,000 to $74,999 | 83 (25.4%) | 11 (57.9%) |
| $75,000 to $99,999 | 30 (9.2%) | 1 (5.3%) |
| $100,000 to $149,999 | 85 (26.0%) | 0 (0.0%) |
| $150,000 or more | 43 (13.2%) | 0 (0.0%) |
| Total | 327 (100.0%) | 19 (100.0%) |
Monthly Housing Cost Tiers in Cut and Shoot
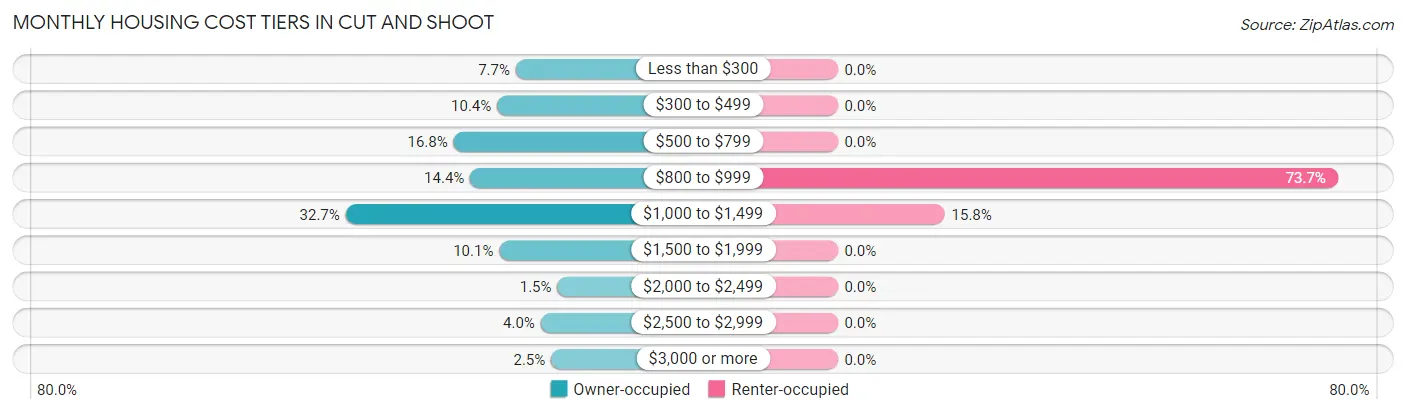
| Monthly Cost | Owner-occupied | Renter-occupied |
| Less than $300 | 25 (7.6%) | 0 (0.0%) |
| $300 to $499 | 34 (10.4%) | 0 (0.0%) |
| $500 to $799 | 55 (16.8%) | 0 (0.0%) |
| $800 to $999 | 47 (14.4%) | 14 (73.7%) |
| $1,000 to $1,499 | 107 (32.7%) | 3 (15.8%) |
| $1,500 to $1,999 | 33 (10.1%) | 0 (0.0%) |
| $2,000 to $2,499 | 5 (1.5%) | 0 (0.0%) |
| $2,500 to $2,999 | 13 (4.0%) | 0 (0.0%) |
| $3,000 or more | 8 (2.5%) | 0 (0.0%) |
| Total | 327 (100.0%) | 19 (100.0%) |
Physical Housing Characteristics in Cut and Shoot
Housing Structures in Cut and Shoot
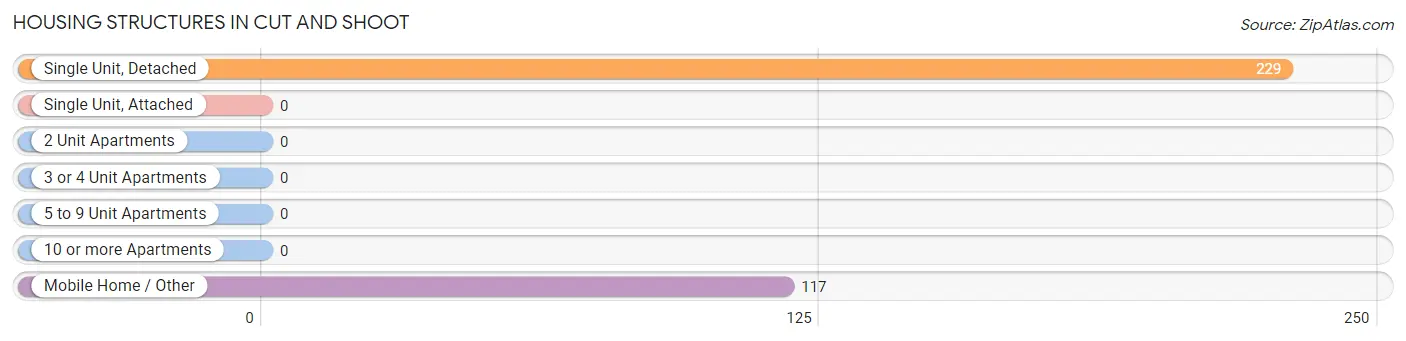
| Structure Type | # Housing Units | % Housing Units |
| Single Unit, Detached | 229 | 66.2% |
| Single Unit, Attached | 0 | 0.0% |
| 2 Unit Apartments | 0 | 0.0% |
| 3 or 4 Unit Apartments | 0 | 0.0% |
| 5 to 9 Unit Apartments | 0 | 0.0% |
| 10 or more Apartments | 0 | 0.0% |
| Mobile Home / Other | 117 | 33.8% |
| Total | 346 | 100.0% |
Housing Structures by Occupancy in Cut and Shoot
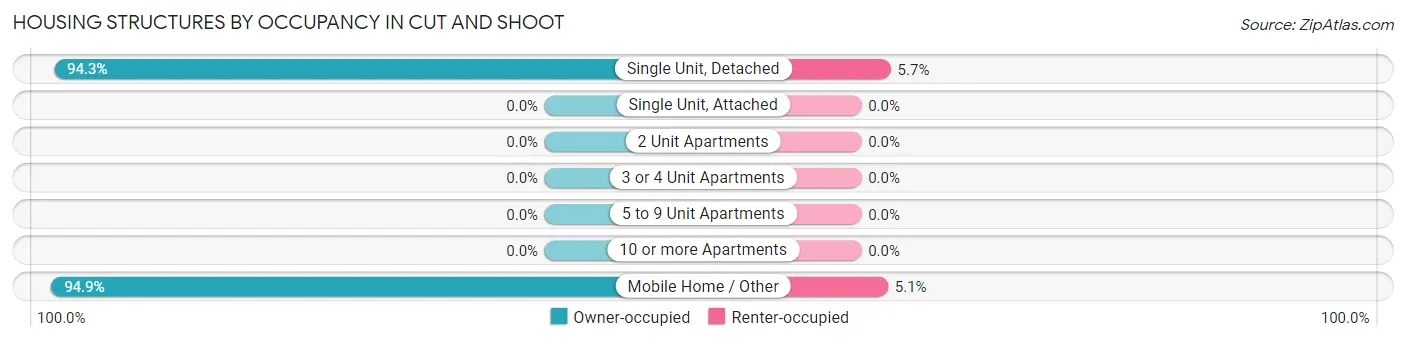
| Structure Type | Owner-occupied | Renter-occupied |
| Single Unit, Detached | 216 (94.3%) | 13 (5.7%) |
| Single Unit, Attached | 0 (0.0%) | 0 (0.0%) |
| 2 Unit Apartments | 0 (0.0%) | 0 (0.0%) |
| 3 or 4 Unit Apartments | 0 (0.0%) | 0 (0.0%) |
| 5 to 9 Unit Apartments | 0 (0.0%) | 0 (0.0%) |
| 10 or more Apartments | 0 (0.0%) | 0 (0.0%) |
| Mobile Home / Other | 111 (94.9%) | 6 (5.1%) |
| Total | 327 (94.5%) | 19 (5.5%) |
Housing Structures by Number of Rooms in Cut and Shoot
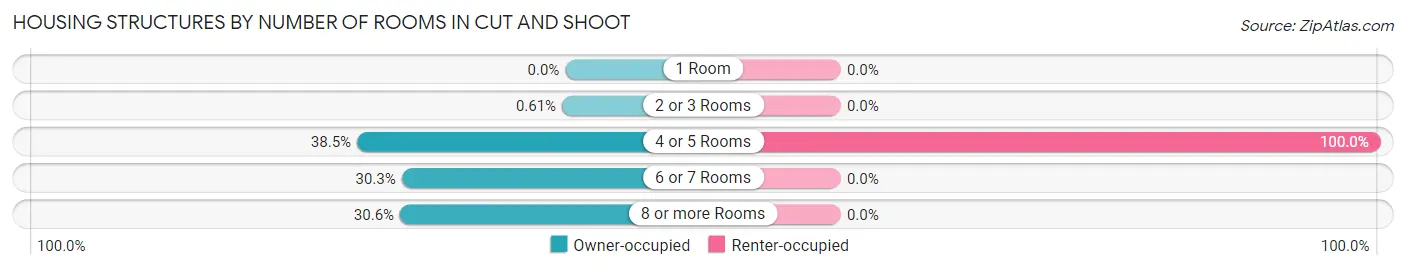
| Number of Rooms | Owner-occupied | Renter-occupied |
| 1 Room | 0 (0.0%) | 0 (0.0%) |
| 2 or 3 Rooms | 2 (0.6%) | 0 (0.0%) |
| 4 or 5 Rooms | 126 (38.5%) | 19 (100.0%) |
| 6 or 7 Rooms | 99 (30.3%) | 0 (0.0%) |
| 8 or more Rooms | 100 (30.6%) | 0 (0.0%) |
| Total | 327 (100.0%) | 19 (100.0%) |
Housing Structure by Heating Type in Cut and Shoot
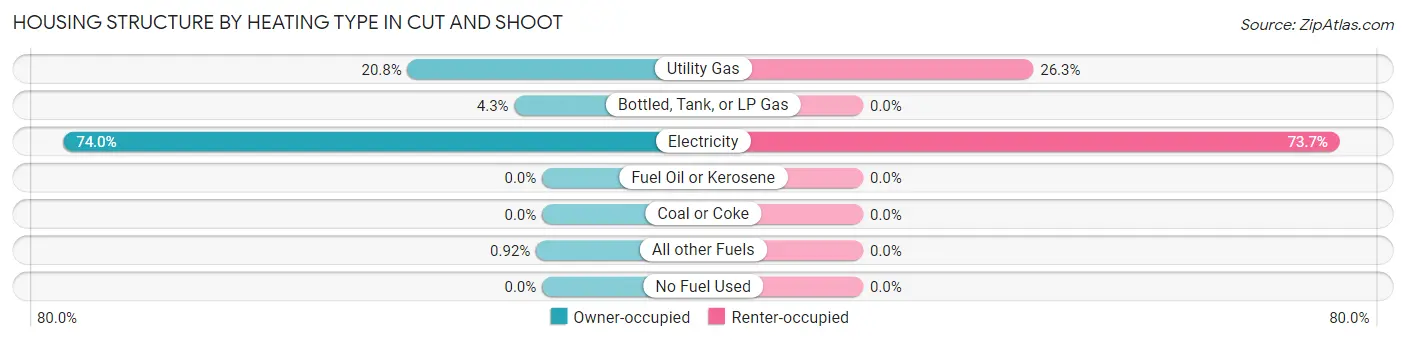
| Heating Type | Owner-occupied | Renter-occupied |
| Utility Gas | 68 (20.8%) | 5 (26.3%) |
| Bottled, Tank, or LP Gas | 14 (4.3%) | 0 (0.0%) |
| Electricity | 242 (74.0%) | 14 (73.7%) |
| Fuel Oil or Kerosene | 0 (0.0%) | 0 (0.0%) |
| Coal or Coke | 0 (0.0%) | 0 (0.0%) |
| All other Fuels | 3 (0.9%) | 0 (0.0%) |
| No Fuel Used | 0 (0.0%) | 0 (0.0%) |
| Total | 327 (100.0%) | 19 (100.0%) |
Household Vehicle Usage in Cut and Shoot
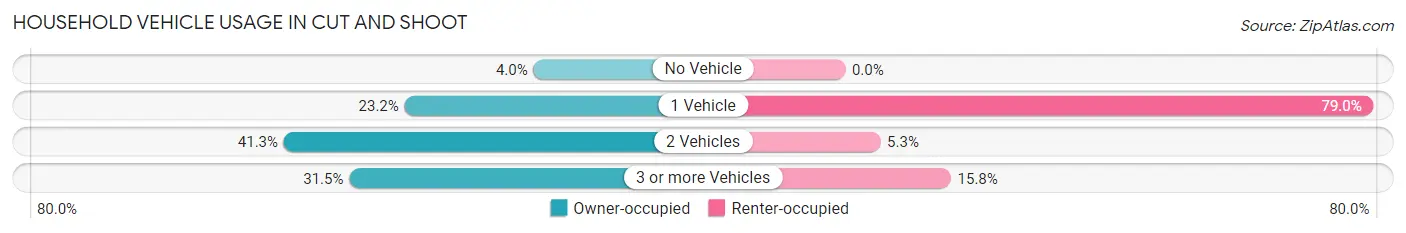
| Vehicles per Household | Owner-occupied | Renter-occupied |
| No Vehicle | 13 (4.0%) | 0 (0.0%) |
| 1 Vehicle | 76 (23.2%) | 15 (78.9%) |
| 2 Vehicles | 135 (41.3%) | 1 (5.3%) |
| 3 or more Vehicles | 103 (31.5%) | 3 (15.8%) |
| Total | 327 (100.0%) | 19 (100.0%) |
Real Estate & Mortgages in Cut and Shoot
Real Estate and Mortgage Overview in Cut and Shoot
| Characteristic | Without Mortgage | With Mortgage |
| Housing Units | 174 | 153 |
| Median Property Value | $233,300 | $155,400 |
| Median Household Income | $65,921 | $34 |
| Monthly Housing Costs | $684 | $5 |
| Real Estate Taxes | - | - |
Property Value by Mortgage Status in Cut and Shoot
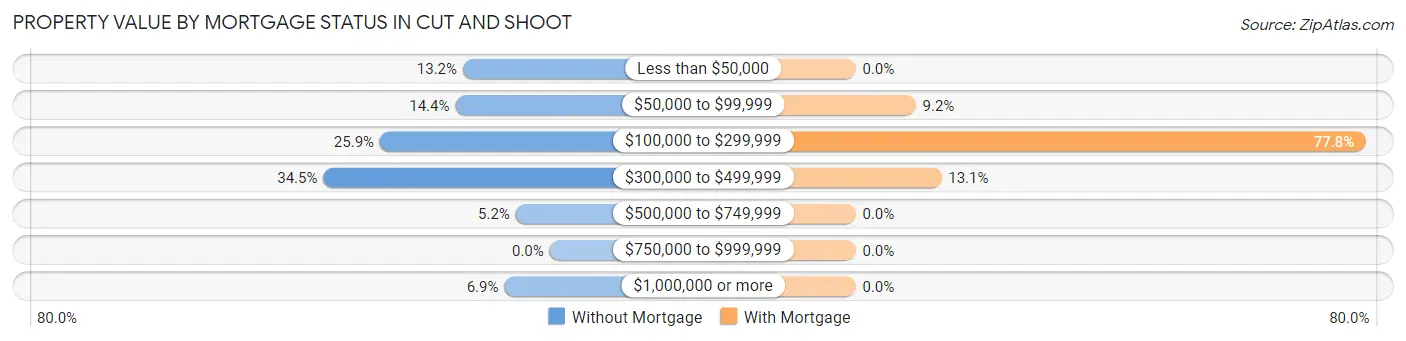
| Property Value | Without Mortgage | With Mortgage |
| Less than $50,000 | 23 (13.2%) | 0 (0.0%) |
| $50,000 to $99,999 | 25 (14.4%) | 14 (9.1%) |
| $100,000 to $299,999 | 45 (25.9%) | 119 (77.8%) |
| $300,000 to $499,999 | 60 (34.5%) | 20 (13.1%) |
| $500,000 to $749,999 | 9 (5.2%) | 0 (0.0%) |
| $750,000 to $999,999 | 0 (0.0%) | 0 (0.0%) |
| $1,000,000 or more | 12 (6.9%) | 0 (0.0%) |
| Total | 174 (100.0%) | 153 (100.0%) |
Household Income by Mortgage Status in Cut and Shoot
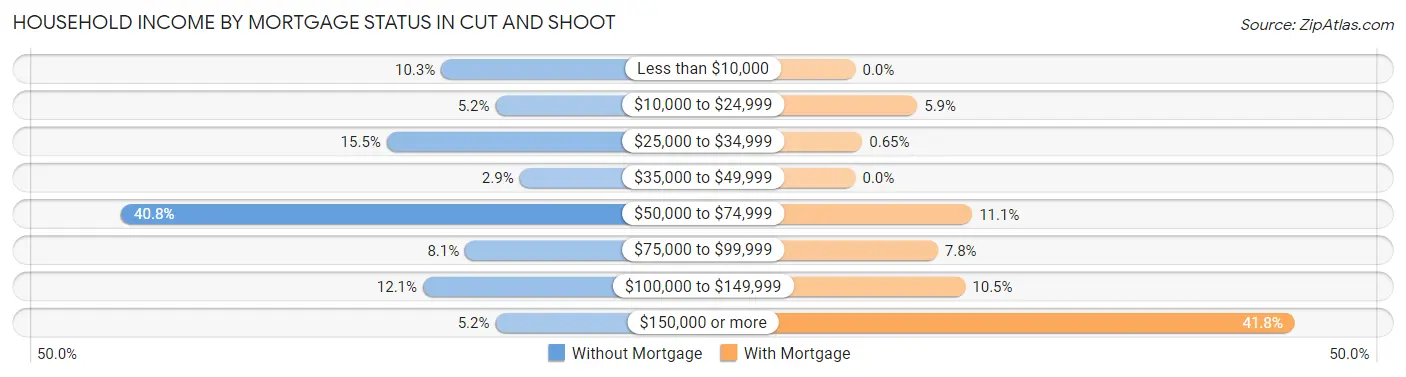
| Household Income | Without Mortgage | With Mortgage |
| Less than $10,000 | 18 (10.3%) | 0 (0.0%) |
| $10,000 to $24,999 | 9 (5.2%) | 9 (5.9%) |
| $25,000 to $34,999 | 27 (15.5%) | 1 (0.6%) |
| $35,000 to $49,999 | 5 (2.9%) | 0 (0.0%) |
| $50,000 to $74,999 | 71 (40.8%) | 17 (11.1%) |
| $75,000 to $99,999 | 14 (8.1%) | 12 (7.8%) |
| $100,000 to $149,999 | 21 (12.1%) | 16 (10.5%) |
| $150,000 or more | 9 (5.2%) | 64 (41.8%) |
| Total | 174 (100.0%) | 153 (100.0%) |
Property Value to Household Income Ratio in Cut and Shoot
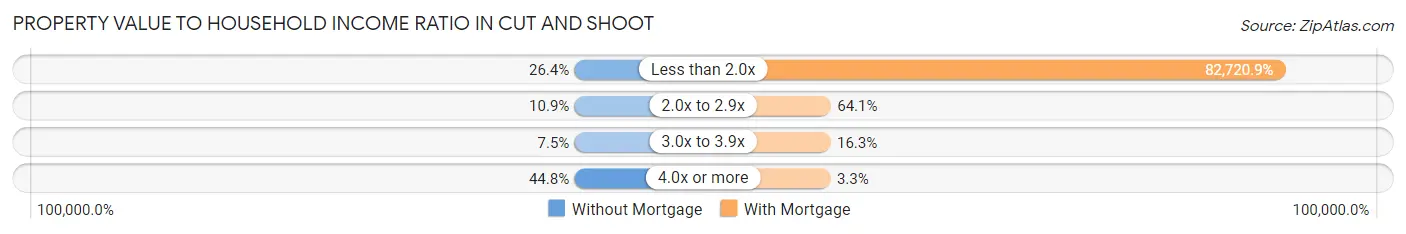
| Value-to-Income Ratio | Without Mortgage | With Mortgage |
| Less than 2.0x | 46 (26.4%) | 126,563 (82,720.9%) |
| 2.0x to 2.9x | 19 (10.9%) | 98 (64.0%) |
| 3.0x to 3.9x | 13 (7.5%) | 25 (16.3%) |
| 4.0x or more | 78 (44.8%) | 5 (3.3%) |
| Total | 174 (100.0%) | 153 (100.0%) |
Real Estate Taxes by Mortgage Status in Cut and Shoot
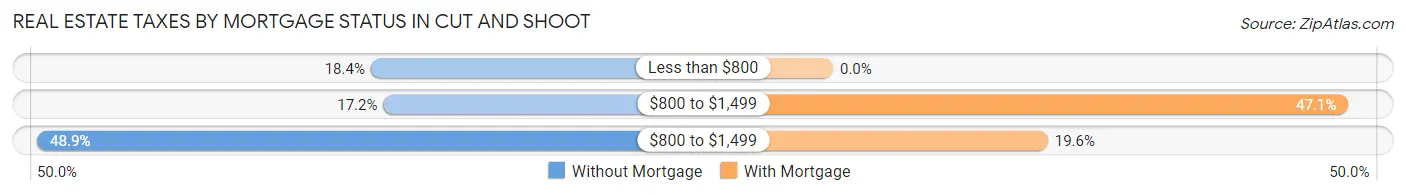
| Property Taxes | Without Mortgage | With Mortgage |
| Less than $800 | 32 (18.4%) | 0 (0.0%) |
| $800 to $1,499 | 30 (17.2%) | 72 (47.1%) |
| $800 to $1,499 | 85 (48.8%) | 30 (19.6%) |
| Total | 174 (100.0%) | 153 (100.0%) |
Health & Disability in Cut and Shoot
Health Insurance Coverage by Age in Cut and Shoot
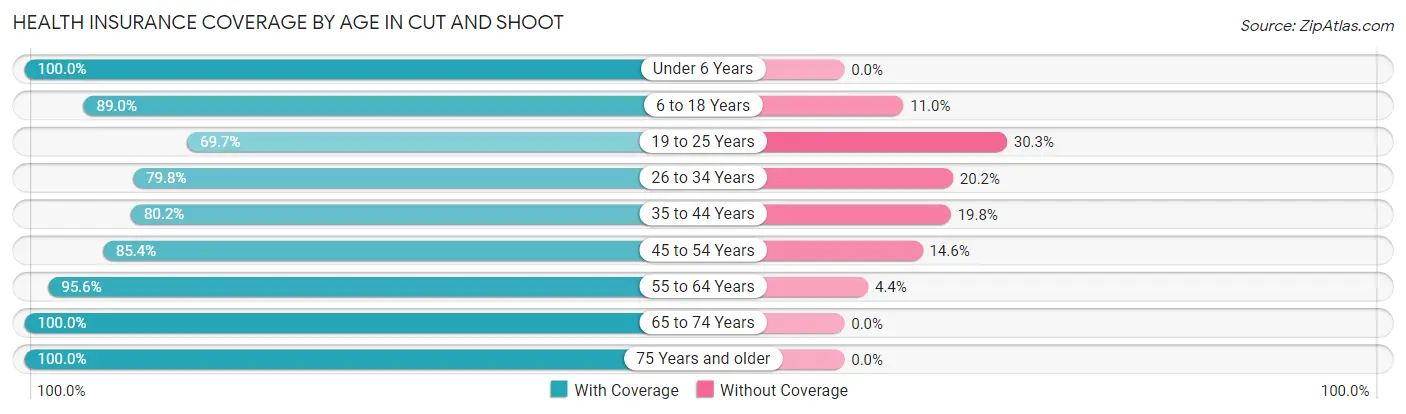
| Age Bracket | With Coverage | Without Coverage |
| Under 6 Years | 57 (100.0%) | 0 (0.0%) |
| 6 to 18 Years | 178 (89.0%) | 22 (11.0%) |
| 19 to 25 Years | 69 (69.7%) | 30 (30.3%) |
| 26 to 34 Years | 67 (79.8%) | 17 (20.2%) |
| 35 to 44 Years | 101 (80.2%) | 25 (19.8%) |
| 45 to 54 Years | 123 (85.4%) | 21 (14.6%) |
| 55 to 64 Years | 194 (95.6%) | 9 (4.4%) |
| 65 to 74 Years | 47 (100.0%) | 0 (0.0%) |
| 75 Years and older | 43 (100.0%) | 0 (0.0%) |
| Total | 879 (87.6%) | 124 (12.4%) |
Health Insurance Coverage by Citizenship Status in Cut and Shoot
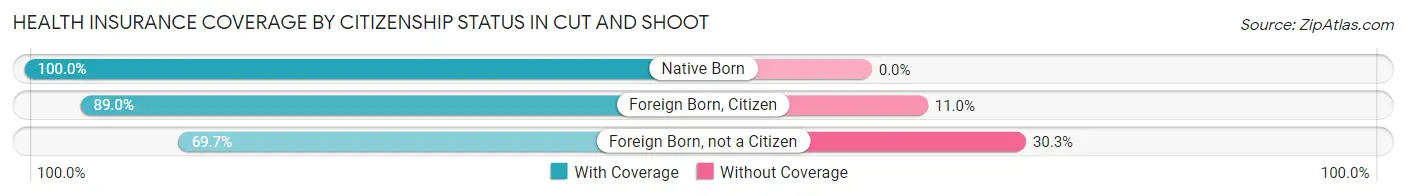
| Citizenship Status | With Coverage | Without Coverage |
| Native Born | 57 (100.0%) | 0 (0.0%) |
| Foreign Born, Citizen | 178 (89.0%) | 22 (11.0%) |
| Foreign Born, not a Citizen | 69 (69.7%) | 30 (30.3%) |
Health Insurance Coverage by Household Income in Cut and Shoot
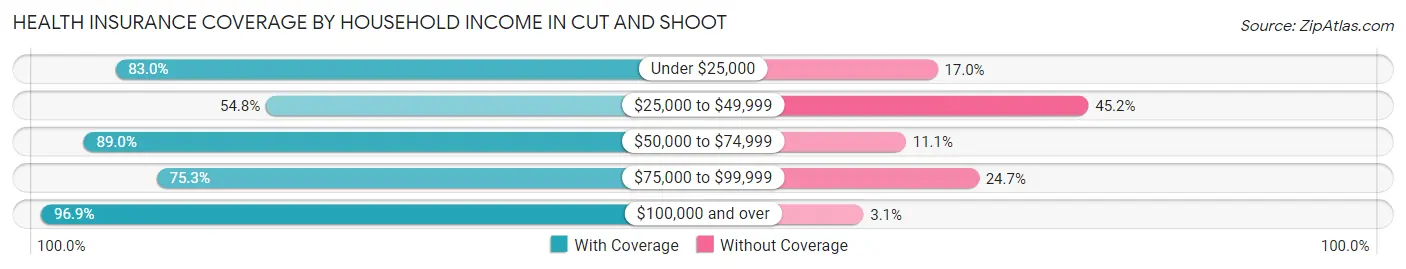
| Household Income | With Coverage | Without Coverage |
| Under $25,000 | 44 (83.0%) | 9 (17.0%) |
| $25,000 to $49,999 | 46 (54.8%) | 38 (45.2%) |
| $50,000 to $74,999 | 346 (88.9%) | 43 (11.1%) |
| $75,000 to $99,999 | 67 (75.3%) | 22 (24.7%) |
| $100,000 and over | 376 (96.9%) | 12 (3.1%) |
Public vs Private Health Insurance Coverage by Age in Cut and Shoot
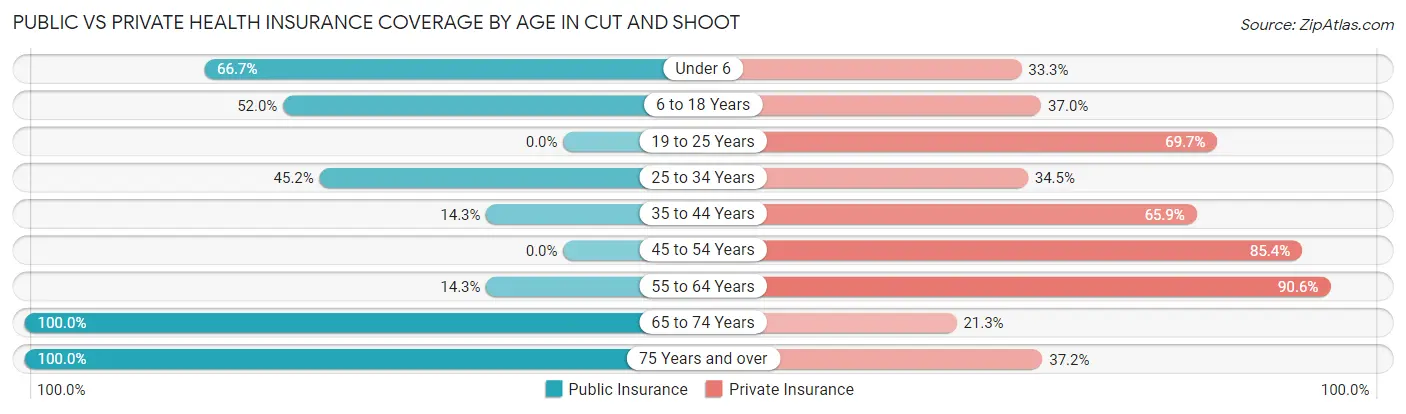
| Age Bracket | Public Insurance | Private Insurance |
| Under 6 | 38 (66.7%) | 19 (33.3%) |
| 6 to 18 Years | 104 (52.0%) | 74 (37.0%) |
| 19 to 25 Years | 0 (0.0%) | 69 (69.7%) |
| 25 to 34 Years | 38 (45.2%) | 29 (34.5%) |
| 35 to 44 Years | 18 (14.3%) | 83 (65.9%) |
| 45 to 54 Years | 0 (0.0%) | 123 (85.4%) |
| 55 to 64 Years | 29 (14.3%) | 184 (90.6%) |
| 65 to 74 Years | 47 (100.0%) | 10 (21.3%) |
| 75 Years and over | 43 (100.0%) | 16 (37.2%) |
| Total | 317 (31.6%) | 607 (60.5%) |
Disability Status by Sex by Age in Cut and Shoot
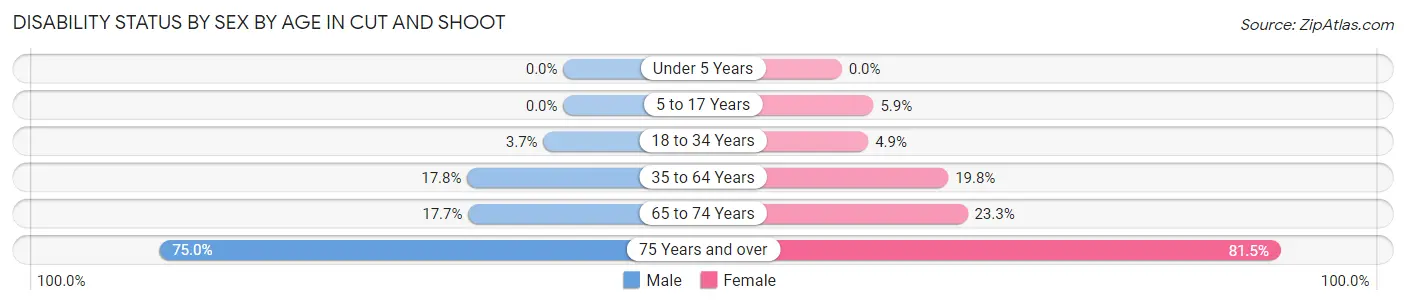
| Age Bracket | Male | Female |
| Under 5 Years | 0 (0.0%) | 0 (0.0%) |
| 5 to 17 Years | 0 (0.0%) | 5 (5.9%) |
| 18 to 34 Years | 3 (3.7%) | 5 (4.9%) |
| 35 to 64 Years | 41 (17.8%) | 48 (19.8%) |
| 65 to 74 Years | 3 (17.6%) | 7 (23.3%) |
| 75 Years and over | 12 (75.0%) | 22 (81.5%) |
Disability Class by Sex by Age in Cut and Shoot
Disability Class: Hearing Difficulty
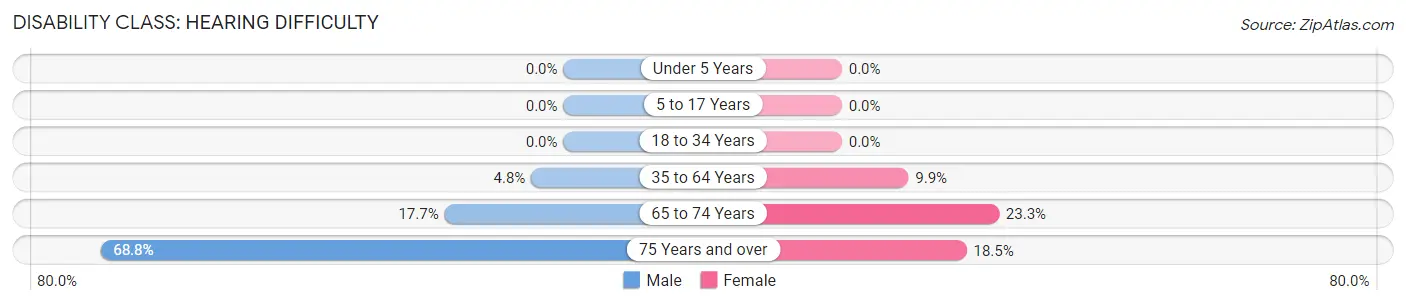
| Age Bracket | Male | Female |
| Under 5 Years | 0 (0.0%) | 0 (0.0%) |
| 5 to 17 Years | 0 (0.0%) | 0 (0.0%) |
| 18 to 34 Years | 0 (0.0%) | 0 (0.0%) |
| 35 to 64 Years | 11 (4.8%) | 24 (9.9%) |
| 65 to 74 Years | 3 (17.6%) | 7 (23.3%) |
| 75 Years and over | 11 (68.8%) | 5 (18.5%) |
Disability Class: Vision Difficulty
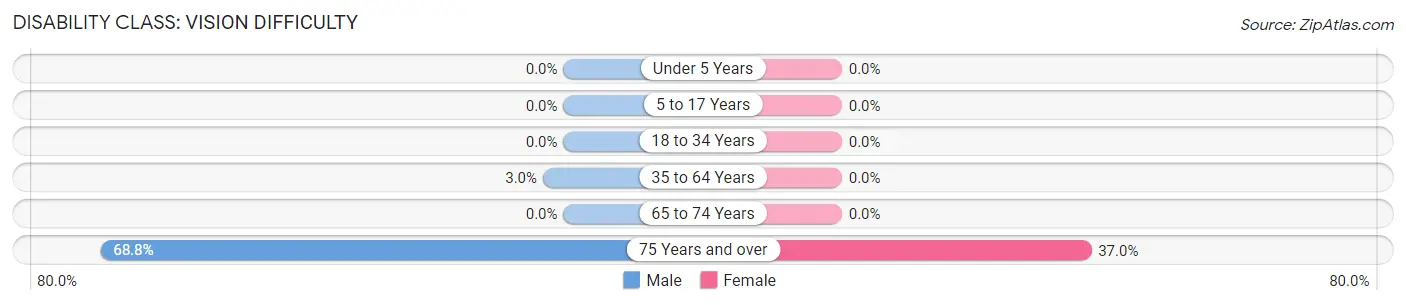
| Age Bracket | Male | Female |
| Under 5 Years | 0 (0.0%) | 0 (0.0%) |
| 5 to 17 Years | 0 (0.0%) | 0 (0.0%) |
| 18 to 34 Years | 0 (0.0%) | 0 (0.0%) |
| 35 to 64 Years | 7 (3.0%) | 0 (0.0%) |
| 65 to 74 Years | 0 (0.0%) | 0 (0.0%) |
| 75 Years and over | 11 (68.8%) | 10 (37.0%) |
Disability Class: Cognitive Difficulty
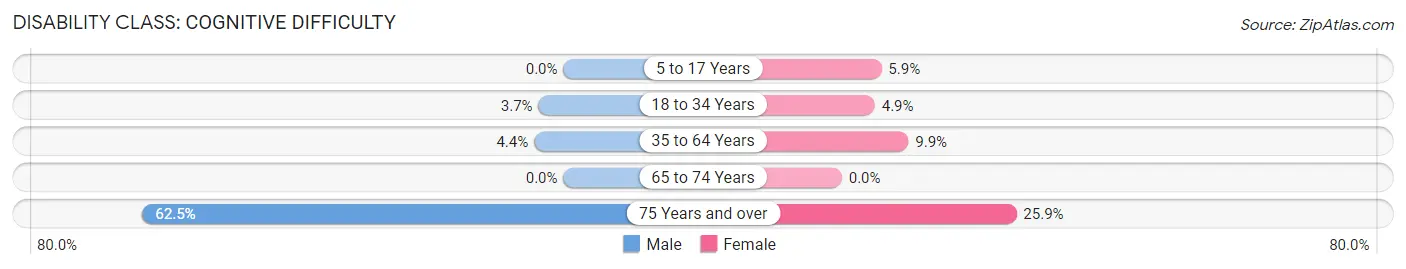
| Age Bracket | Male | Female |
| 5 to 17 Years | 0 (0.0%) | 5 (5.9%) |
| 18 to 34 Years | 3 (3.7%) | 5 (4.9%) |
| 35 to 64 Years | 10 (4.3%) | 24 (9.9%) |
| 65 to 74 Years | 0 (0.0%) | 0 (0.0%) |
| 75 Years and over | 10 (62.5%) | 7 (25.9%) |
Disability Class: Ambulatory Difficulty
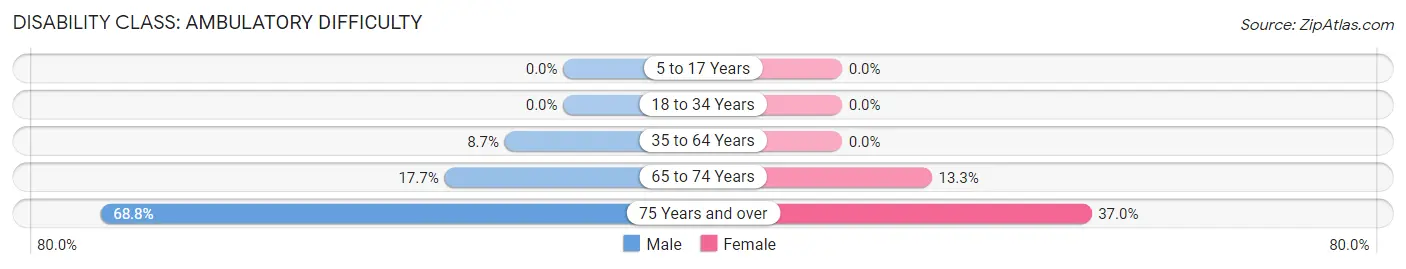
| Age Bracket | Male | Female |
| 5 to 17 Years | 0 (0.0%) | 0 (0.0%) |
| 18 to 34 Years | 0 (0.0%) | 0 (0.0%) |
| 35 to 64 Years | 20 (8.7%) | 0 (0.0%) |
| 65 to 74 Years | 3 (17.6%) | 4 (13.3%) |
| 75 Years and over | 11 (68.8%) | 10 (37.0%) |
Disability Class: Self-Care Difficulty
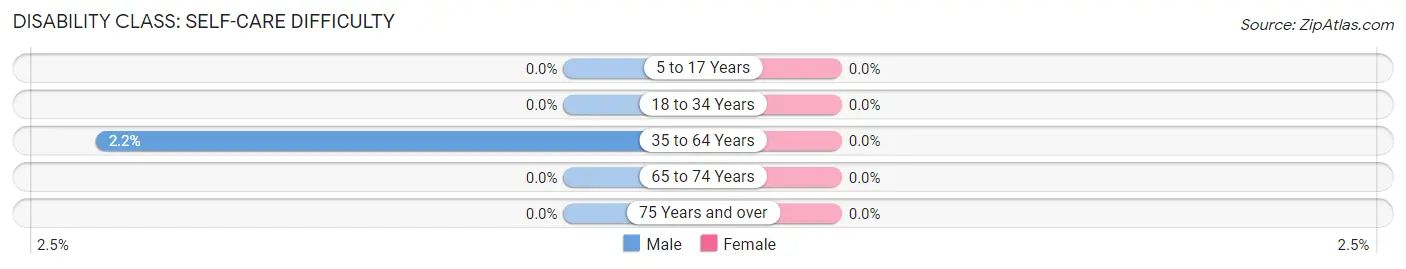
| Age Bracket | Male | Female |
| 5 to 17 Years | 0 (0.0%) | 0 (0.0%) |
| 18 to 34 Years | 0 (0.0%) | 0 (0.0%) |
| 35 to 64 Years | 5 (2.2%) | 0 (0.0%) |
| 65 to 74 Years | 0 (0.0%) | 0 (0.0%) |
| 75 Years and over | 0 (0.0%) | 0 (0.0%) |
Technology Access in Cut and Shoot
Computing Device Access in Cut and Shoot
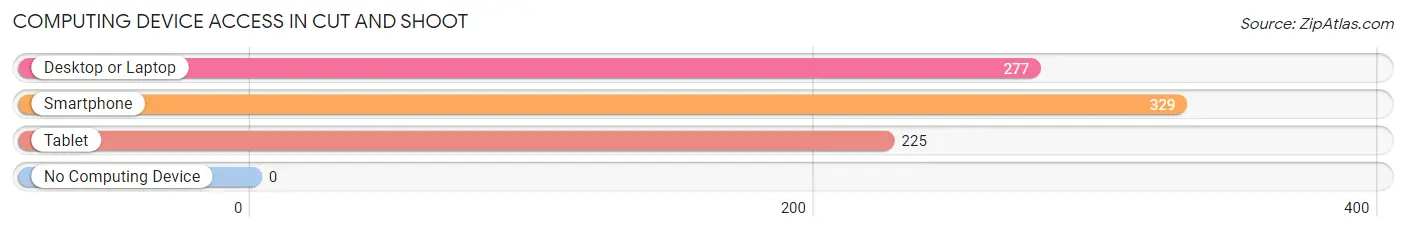
| Device Type | # Households | % Households |
| Desktop or Laptop | 277 | 80.1% |
| Smartphone | 329 | 95.1% |
| Tablet | 225 | 65.0% |
| No Computing Device | 0 | 0.0% |
| Total | 346 | 100.0% |
Internet Access in Cut and Shoot
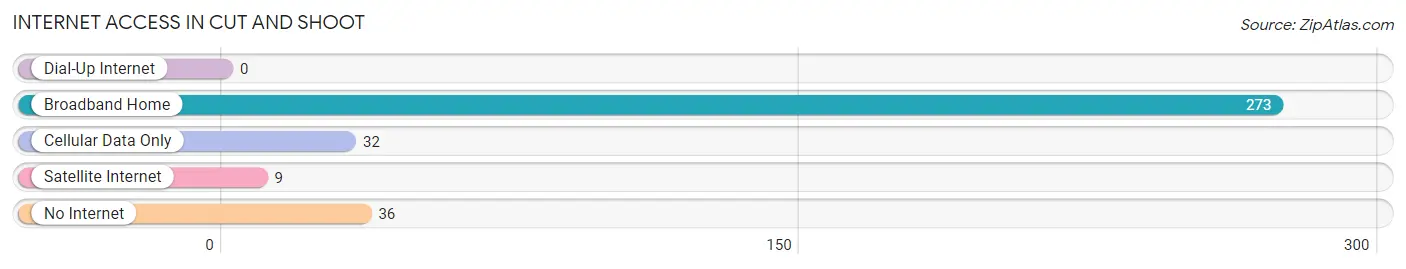
| Internet Type | # Households | % Households |
| Dial-Up Internet | 0 | 0.0% |
| Broadband Home | 273 | 78.9% |
| Cellular Data Only | 32 | 9.2% |
| Satellite Internet | 9 | 2.6% |
| No Internet | 36 | 10.4% |
| Total | 346 | 100.0% |
Cut and Shoot Summary
Cut and Shoot, Texas is a small unincorporated community located in Montgomery County, Texas. It is situated about 25 miles north of Houston and is part of the Houston–The Woodlands–Sugar Land metropolitan area. The population of Cut and Shoot was estimated to be 1,093 in 2019.
History
The area that is now Cut and Shoot was first settled in the late 1800s by a group of German immigrants. The town was originally known as “Cut and Shoot” because of a dispute between two families over a piece of land. According to local legend, one family wanted to cut the land in half and the other wanted to shoot the other family if they did not agree. The dispute was eventually settled without violence and the town was named after the incident.
The town was officially incorporated in 1912 and the first post office was established in 1913. The town grew slowly over the years and by the 1950s, it had a population of around 500 people.
Geography
Cut and Shoot is located in Montgomery County, Texas, about 25 miles north of Houston. It is situated at the intersection of FM 1485 and FM 1314. The town is surrounded by pine and oak forests and is located near the Sam Houston National Forest. The climate in Cut and Shoot is humid subtropical, with hot summers and mild winters.
Economy
The economy of Cut and Shoot is largely based on agriculture and forestry. The town is home to several farms and ranches, as well as a sawmill and a lumber yard. The town also has a few small businesses, including a gas station, a convenience store, and a few restaurants.
Demographics
As of the 2019 census, the population of Cut and Shoot was estimated to be 1,093. The racial makeup of the town was 94.3% White, 1.2% African American, 0.7% Native American, 0.7% Asian, 0.1% Pacific Islander, and 2.9% from other races. The median household income was $45,000 and the median age was 37.
Conclusion
Cut and Shoot, Texas is a small unincorporated community located in Montgomery County, Texas. It is situated about 25 miles north of Houston and is part of the Houston–The Woodlands–Sugar Land metropolitan area. The population of Cut and Shoot was estimated to be 1,093 in 2019. The town is largely based on agriculture and forestry, and the economy is supported by several farms and ranches, as well as a sawmill and a lumber yard. The racial makeup of the town was 94.3% White, 1.2% African American, 0.7% Native American, 0.7% Asian, 0.1% Pacific Islander, and 2.9% from other races. The median household income was $45,000 and the median age was 37. Cut and Shoot is a small but vibrant community that is proud of its history and culture.
Common Questions
What is the Total Population of Cut and Shoot?
Total Population of Cut and Shoot is 1,003.
What is the Total Male Population of Cut and Shoot?
Total Male Population of Cut and Shoot is 502.
What is the Total Female Population of Cut and Shoot?
Total Female Population of Cut and Shoot is 501.
What is the Ratio of Males per 100 Females in Cut and Shoot?
There are 100.20 Males per 100 Females in Cut and Shoot.
What is the Ratio of Females per 100 Males in Cut and Shoot?
There are 99.80 Females per 100 Males in Cut and Shoot.
What is the Median Population Age in Cut and Shoot?
Median Population Age in Cut and Shoot is 40.3 Years.
What is the Average Family Size in Cut and Shoot
Average Family Size in Cut and Shoot is 3.5 People.
What is the Average Household Size in Cut and Shoot
Average Household Size in Cut and Shoot is 2.9 People.
What is Per Capita Income in Cut and Shoot?
Per Capita income in Cut and Shoot is $29,687.
What is the Median Family Income in Cut and Shoot?
Median Family Income in Cut and Shoot is $97,375.
What is the Median Household income in Cut and Shoot?
Median Household Income in Cut and Shoot is $69,667.
What is Income or Wage Gap in Cut and Shoot?
Income or Wage Gap in Cut and Shoot is 29.4%.
Women in Cut and Shoot earn 70.6 cents for every dollar earned by a man.
What is Inequality or Gini Index in Cut and Shoot?
Inequality or Gini Index in Cut and Shoot is 0.36.
How Large is the Labor Force in Cut and Shoot?
There are 467 People in the Labor Forcein in Cut and Shoot.
What is the Percentage of People in the Labor Force in Cut and Shoot?
58.3% of People are in the Labor Force in Cut and Shoot.
What is the Unemployment Rate in Cut and Shoot?
Unemployment Rate in Cut and Shoot is 1.9%.