Zip Codes with the Highest Percentage of Population with a Degree in Visual and Performing Arts in Lancaster, TX
RELATED REPORTS & OPTIONS
Visual and Performing Arts
Lancaster
Compare Zip Codes
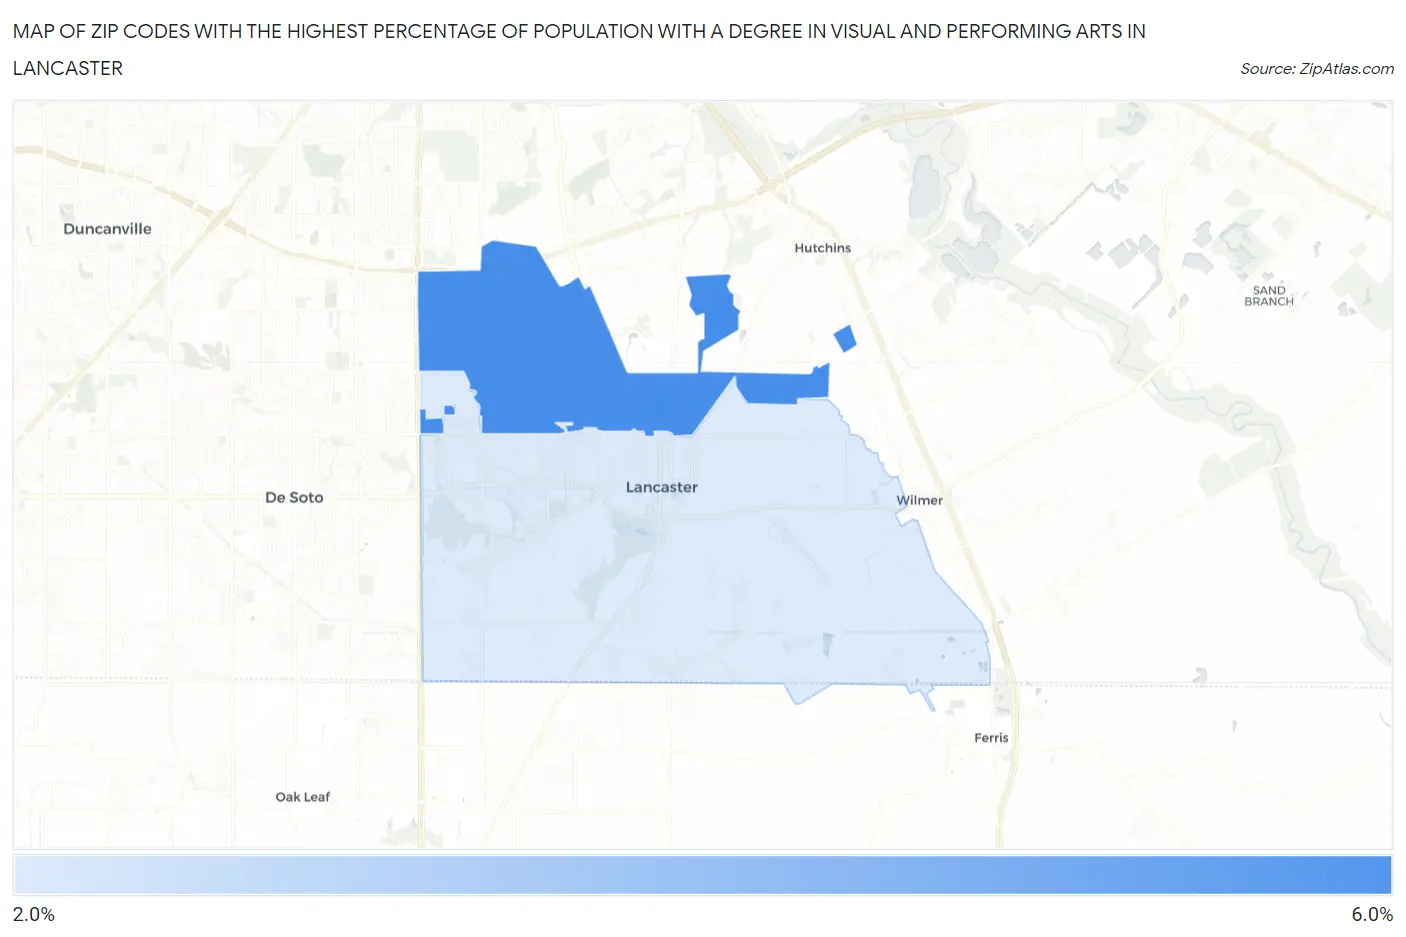
Map of Zip Codes with the Highest Percentage of Population with a Degree in Visual and Performing Arts in Lancaster
0.0%
6.0%
Zip Codes with the Highest Percentage of Population with a Degree in Visual and Performing Arts in Lancaster, TX
| Zip Code | % Graduates | vs State | vs National | |
| 1. | 75134 | 5.6% | 3.2%(+2.42)#224 | 4.3%(+1.38)#5,447 |
| 2. | 75146 | 2.8% | 3.2%(-0.419)#658 | 4.3%(-1.46)#13,532 |
1
Common Questions
What are the Top Zip Codes with the Highest Percentage of Population with a Degree in Visual and Performing Arts in Lancaster, TX?
Top Zip Codes with the Highest Percentage of Population with a Degree in Visual and Performing Arts in Lancaster, TX are:
What zip code has the Highest Percentage of Population with a Degree in Visual and Performing Arts in Lancaster, TX?
75134 has the Highest Percentage of Population with a Degree in Visual and Performing Arts in Lancaster, TX with 5.6%.
What is the Percentage of Population with a Degree in Visual and Performing Arts in Lancaster, TX?
Percentage of Population with a Degree in Visual and Performing Arts in Lancaster is 4.3%.
What is the Percentage of Population with a Degree in Visual and Performing Arts in Texas?
Percentage of Population with a Degree in Visual and Performing Arts in Texas is 3.2%.
What is the Percentage of Population with a Degree in Visual and Performing Arts in the United States?
Percentage of Population with a Degree in Visual and Performing Arts in the United States is 4.3%.