Cities with the Highest Percentage of Population with a Degree in Engineering in Texas
RELATED REPORTS & OPTIONS
Engineering
Texas
Compare Cities
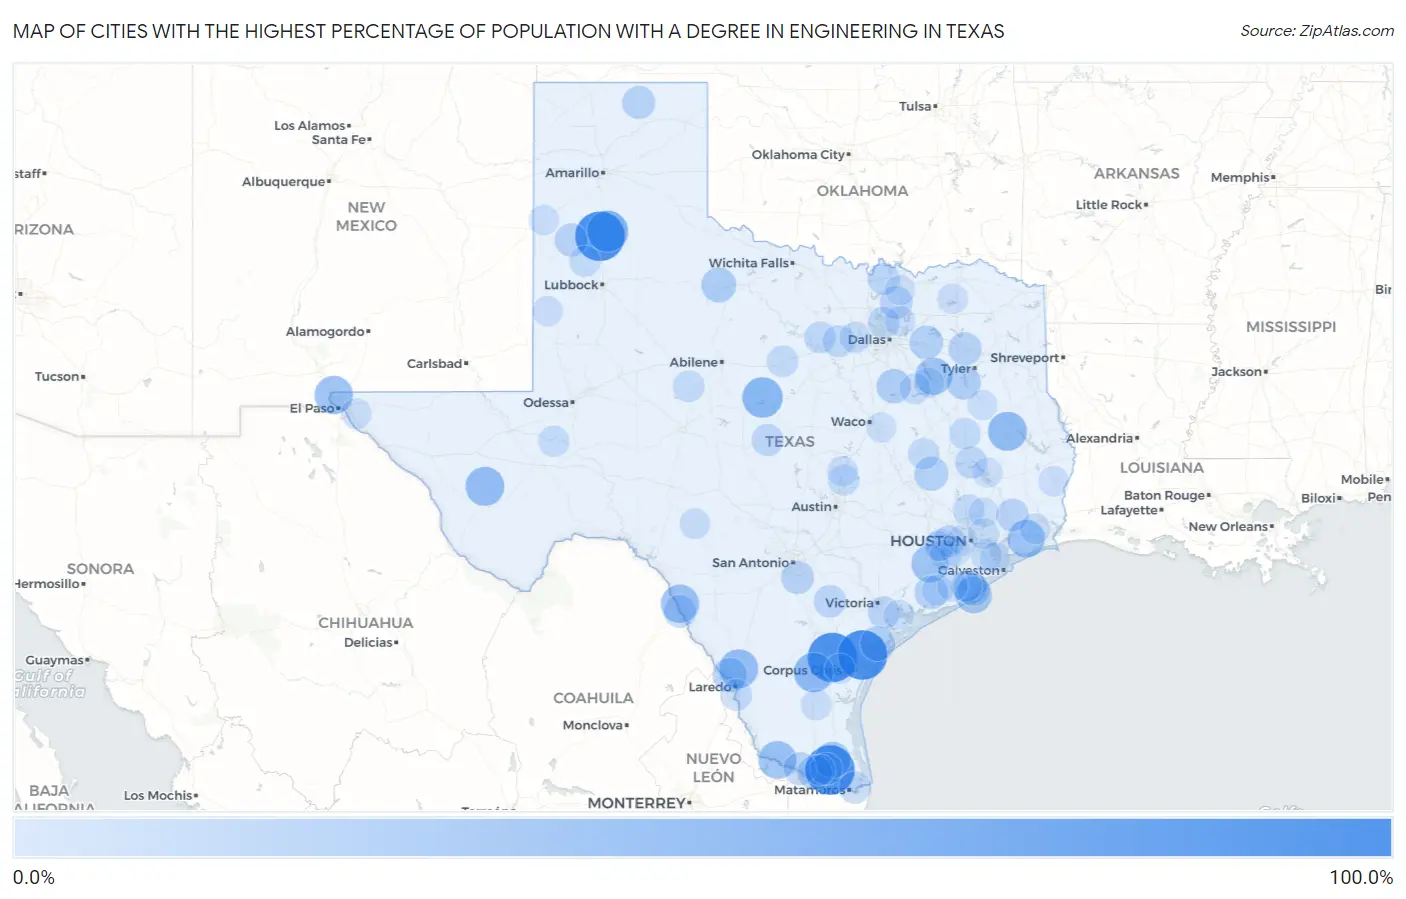
Map of Cities with the Highest Percentage of Population with a Degree in Engineering in Texas
0.0%
100.0%
Cities with the Highest Percentage of Population with a Degree in Engineering in Texas
| City | % Graduates | vs State | vs National | |
| 1. | Red Rock | 100.0% | 9.5%(+90.5)#1 | 7.6%(+92.4)#5 |
| 2. | Sandy Hollow Escondidas | 100.0% | 9.5%(+90.5)#2 | 7.6%(+92.4)#9 |
| 3. | Tradewinds | 100.0% | 9.5%(+90.5)#3 | 7.6%(+92.4)#12 |
| 4. | Ratamosa | 100.0% | 9.5%(+90.5)#4 | 7.6%(+92.4)#28 |
| 5. | Edmonson | 100.0% | 9.5%(+90.5)#5 | 7.6%(+92.4)#34 |
| 6. | Oak Ridge Town Cooke County | 80.0% | 9.5%(+70.5)#6 | 7.6%(+72.4)#75 |
| 7. | Waka | 66.7% | 9.5%(+57.1)#7 | 7.6%(+59.0)#93 |
| 8. | Kress | 64.3% | 9.5%(+54.7)#8 | 7.6%(+56.6)#101 |
| 9. | Thunderbird Bay | 60.0% | 9.5%(+50.5)#9 | 7.6%(+52.4)#118 |
| 10. | Coyote Acres | 57.6% | 9.5%(+48.0)#10 | 7.6%(+49.9)#132 |
| 11. | Redland | 54.7% | 9.5%(+45.1)#11 | 7.6%(+47.0)#145 |
| 12. | Fort Davis | 53.9% | 9.5%(+44.4)#12 | 7.6%(+46.3)#147 |
| 13. | Botines | 53.8% | 9.5%(+44.3)#13 | 7.6%(+46.2)#148 |
| 14. | Westway | 51.5% | 9.5%(+42.0)#14 | 7.6%(+43.8)#156 |
| 15. | Elm Creek | 51.1% | 9.5%(+41.5)#15 | 7.6%(+43.4)#158 |
| 16. | El Chaparral | 50.0% | 9.5%(+40.5)#16 | 7.6%(+42.4)#169 |
| 17. | Deerwood | 49.1% | 9.5%(+39.6)#17 | 7.6%(+41.4)#183 |
| 18. | Stowell | 48.6% | 9.5%(+39.0)#18 | 7.6%(+40.9)#184 |
| 19. | Hungerford | 47.1% | 9.5%(+37.5)#19 | 7.6%(+39.4)#197 |
| 20. | Log Cabin | 46.4% | 9.5%(+36.9)#20 | 7.6%(+38.8)#204 |
| 21. | Ben Arnold | 46.2% | 9.5%(+36.6)#21 | 7.6%(+38.5)#208 |
| 22. | Quintana | 44.4% | 9.5%(+34.9)#22 | 7.6%(+36.8)#220 |
| 23. | Sebastian | 42.9% | 9.5%(+33.3)#23 | 7.6%(+35.2)#230 |
| 24. | Zephyr | 40.0% | 9.5%(+30.5)#24 | 7.6%(+32.4)#265 |
| 25. | Benjamin | 37.5% | 9.5%(+28.0)#25 | 7.6%(+29.9)#295 |
| 26. | Holiday Beach | 36.4% | 9.5%(+26.8)#26 | 7.6%(+28.7)#316 |
| 27. | Ranchos Penitas West | 35.4% | 9.5%(+25.9)#27 | 7.6%(+27.8)#329 |
| 28. | Blooming Grove | 35.0% | 9.5%(+25.5)#28 | 7.6%(+27.4)#333 |
| 29. | Coffee City | 34.7% | 9.5%(+25.2)#29 | 7.6%(+27.0)#337 |
| 30. | South Alamo | 34.6% | 9.5%(+25.1)#30 | 7.6%(+27.0)#338 |
| 31. | Iola | 33.3% | 9.5%(+23.8)#31 | 7.6%(+25.7)#358 |
| 32. | Clute | 33.1% | 9.5%(+23.5)#32 | 7.6%(+25.4)#380 |
| 33. | Elmo | 32.5% | 9.5%(+23.0)#33 | 7.6%(+24.9)#384 |
| 34. | Markham | 31.3% | 9.5%(+21.8)#34 | 7.6%(+23.7)#406 |
| 35. | Mineola | 30.6% | 9.5%(+21.1)#35 | 7.6%(+23.0)#425 |
| 36. | Earth | 30.4% | 9.5%(+20.8)#36 | 7.6%(+22.7)#431 |
| 37. | Spearman | 30.2% | 9.5%(+20.7)#37 | 7.6%(+22.6)#434 |
| 38. | Sandy Oaks | 29.8% | 9.5%(+20.3)#38 | 7.6%(+22.1)#453 |
| 39. | Mcleod | 29.6% | 9.5%(+20.1)#39 | 7.6%(+22.0)#455 |
| 40. | Palmview South | 29.5% | 9.5%(+19.9)#40 | 7.6%(+21.8)#460 |
| 41. | Eidson Road | 29.2% | 9.5%(+19.7)#41 | 7.6%(+21.6)#468 |
| 42. | Southwest Sandhill | 29.0% | 9.5%(+19.5)#42 | 7.6%(+21.4)#473 |
| 43. | Weston | 28.3% | 9.5%(+18.7)#43 | 7.6%(+20.6)#516 |
| 44. | Hull | 28.2% | 9.5%(+18.6)#44 | 7.6%(+20.5)#519 |
| 45. | Magnolia Beach | 27.7% | 9.5%(+18.1)#45 | 7.6%(+20.0)#535 |
| 46. | Kenedy | 27.2% | 9.5%(+17.7)#46 | 7.6%(+19.6)#555 |
| 47. | Oyster Creek | 26.7% | 9.5%(+17.1)#47 | 7.6%(+19.0)#572 |
| 48. | Reid Hope King | 26.3% | 9.5%(+16.8)#48 | 7.6%(+18.7)#582 |
| 49. | Richland Springs | 26.1% | 9.5%(+16.5)#49 | 7.6%(+18.4)#594 |
| 50. | Indian Hills | 25.6% | 9.5%(+16.1)#50 | 7.6%(+18.0)#615 |
| 51. | Bloomington | 25.6% | 9.5%(+16.1)#51 | 7.6%(+18.0)#616 |
| 52. | Trinity | 25.6% | 9.5%(+16.0)#52 | 7.6%(+17.9)#620 |
| 53. | Whitesboro | 25.5% | 9.5%(+15.9)#53 | 7.6%(+17.8)#624 |
| 54. | Fulshear | 25.2% | 9.5%(+15.7)#54 | 7.6%(+17.5)#631 |
| 55. | Hudson Oaks | 25.1% | 9.5%(+15.5)#55 | 7.6%(+17.4)#635 |
| 56. | Cool | 25.0% | 9.5%(+15.5)#56 | 7.6%(+17.4)#667 |
| 57. | Hebron | 24.7% | 9.5%(+15.1)#57 | 7.6%(+17.0)#688 |
| 58. | Cinco Ranch | 24.2% | 9.5%(+14.7)#58 | 7.6%(+16.6)#707 |
| 59. | Ranger | 24.0% | 9.5%(+14.5)#59 | 7.6%(+16.4)#716 |
| 60. | Latexo | 24.0% | 9.5%(+14.5)#60 | 7.6%(+16.4)#722 |
| 61. | Blackwell | 23.9% | 9.5%(+14.4)#61 | 7.6%(+16.3)#726 |
| 62. | Hilltop Lakes | 23.7% | 9.5%(+14.2)#62 | 7.6%(+16.1)#740 |
| 63. | Rosanky | 23.7% | 9.5%(+14.1)#63 | 7.6%(+16.0)#743 |
| 64. | Rio Bravo | 23.5% | 9.5%(+13.9)#64 | 7.6%(+15.8)#753 |
| 65. | Woodloch | 23.1% | 9.5%(+13.5)#65 | 7.6%(+15.4)#778 |
| 66. | Spade | 22.6% | 9.5%(+13.0)#66 | 7.6%(+14.9)#801 |
| 67. | Nassau Bay | 22.4% | 9.5%(+12.8)#67 | 7.6%(+14.7)#814 |
| 68. | Weir | 22.0% | 9.5%(+12.4)#68 | 7.6%(+14.3)#856 |
| 69. | Imperial | 21.8% | 9.5%(+12.3)#69 | 7.6%(+14.2)#860 |
| 70. | Sansom Park | 21.5% | 9.5%(+12.0)#70 | 7.6%(+13.9)#881 |
| 71. | Lake Jackson | 21.3% | 9.5%(+11.8)#71 | 7.6%(+13.7)#913 |
| 72. | Mildred | 21.2% | 9.5%(+11.7)#72 | 7.6%(+13.6)#922 |
| 73. | Airport Road Addition | 21.1% | 9.5%(+11.5)#73 | 7.6%(+13.4)#940 |
| 74. | Rosenberg | 21.0% | 9.5%(+11.4)#74 | 7.6%(+13.3)#955 |
| 75. | Midway North | 20.4% | 9.5%(+10.9)#75 | 7.6%(+12.8)#998 |
| 76. | Bay City | 20.4% | 9.5%(+10.9)#76 | 7.6%(+12.7)#1,003 |
| 77. | Sheldon | 20.3% | 9.5%(+10.8)#77 | 7.6%(+12.7)#1,009 |
| 78. | Fannett | 20.0% | 9.5%(+10.5)#78 | 7.6%(+12.4)#1,024 |
| 79. | Rocksprings | 20.0% | 9.5%(+10.5)#79 | 7.6%(+12.4)#1,028 |
| 80. | Cooper | 19.9% | 9.5%(+10.3)#80 | 7.6%(+12.2)#1,083 |
| 81. | Jarrell | 19.8% | 9.5%(+10.2)#81 | 7.6%(+12.1)#1,088 |
| 82. | Horizon City | 19.8% | 9.5%(+10.2)#82 | 7.6%(+12.1)#1,089 |
| 83. | Parker | 19.7% | 9.5%(+10.1)#83 | 7.6%(+12.0)#1,096 |
| 84. | Kirbyville | 19.5% | 9.5%(+9.97)#84 | 7.6%(+11.9)#1,107 |
| 85. | Bovina | 19.5% | 9.5%(+9.97)#85 | 7.6%(+11.9)#1,108 |
| 86. | Sweeny | 19.3% | 9.5%(+9.77)#86 | 7.6%(+11.7)#1,129 |
| 87. | Plains | 19.3% | 9.5%(+9.76)#87 | 7.6%(+11.7)#1,130 |
| 88. | Sargent | 19.2% | 9.5%(+9.66)#88 | 7.6%(+11.6)#1,145 |
| 89. | San Leon | 19.2% | 9.5%(+9.66)#89 | 7.6%(+11.6)#1,146 |
| 90. | Port Lavaca | 18.8% | 9.5%(+9.24)#90 | 7.6%(+11.1)#1,188 |
| 91. | Piney Point Village | 18.5% | 9.5%(+9.00)#91 | 7.6%(+10.9)#1,209 |
| 92. | Robstown | 18.5% | 9.5%(+8.95)#92 | 7.6%(+10.8)#1,216 |
| 93. | Roman Forest | 18.5% | 9.5%(+8.92)#93 | 7.6%(+10.8)#1,218 |
| 94. | Howe | 18.4% | 9.5%(+8.86)#94 | 7.6%(+10.8)#1,223 |
| 95. | Trinidad | 18.4% | 9.5%(+8.85)#95 | 7.6%(+10.7)#1,224 |
| 96. | Cedar Point | 18.4% | 9.5%(+8.85)#96 | 7.6%(+10.7)#1,226 |
| 97. | Sugar Land | 18.3% | 9.5%(+8.72)#97 | 7.6%(+10.6)#1,244 |
| 98. | Weston Lakes | 18.1% | 9.5%(+8.53)#98 | 7.6%(+10.4)#1,289 |
| 99. | Rusk | 18.0% | 9.5%(+8.49)#99 | 7.6%(+10.4)#1,295 |
| 100. | Riesel | 17.9% | 9.5%(+8.32)#100 | 7.6%(+10.2)#1,304 |
Common Questions
What are the Top 10 Cities with the Highest Percentage of Population with a Degree in Engineering in Texas?
Top 10 Cities with the Highest Percentage of Population with a Degree in Engineering in Texas are:
#1
100.0%
#2
100.0%
#3
100.0%
#4
100.0%
#5
64.3%
#6
60.0%
#7
57.6%
#8
54.7%
#9
53.9%
#10
53.8%
What city has the Highest Percentage of Population with a Degree in Engineering in Texas?
Sandy Hollow Escondidas has the Highest Percentage of Population with a Degree in Engineering in Texas with 100.0%.
What is the Percentage of Population with a Degree in Engineering in the State of Texas?
Percentage of Population with a Degree in Engineering in Texas is 9.5%.
What is the Percentage of Population with a Degree in Engineering in the United States?
Percentage of Population with a Degree in Engineering in the United States is 7.6%.