Cities with the Most Immigrants from Ecuador in Texas
RELATED REPORTS & OPTIONS
Ecuador
Texas
Compare Cities
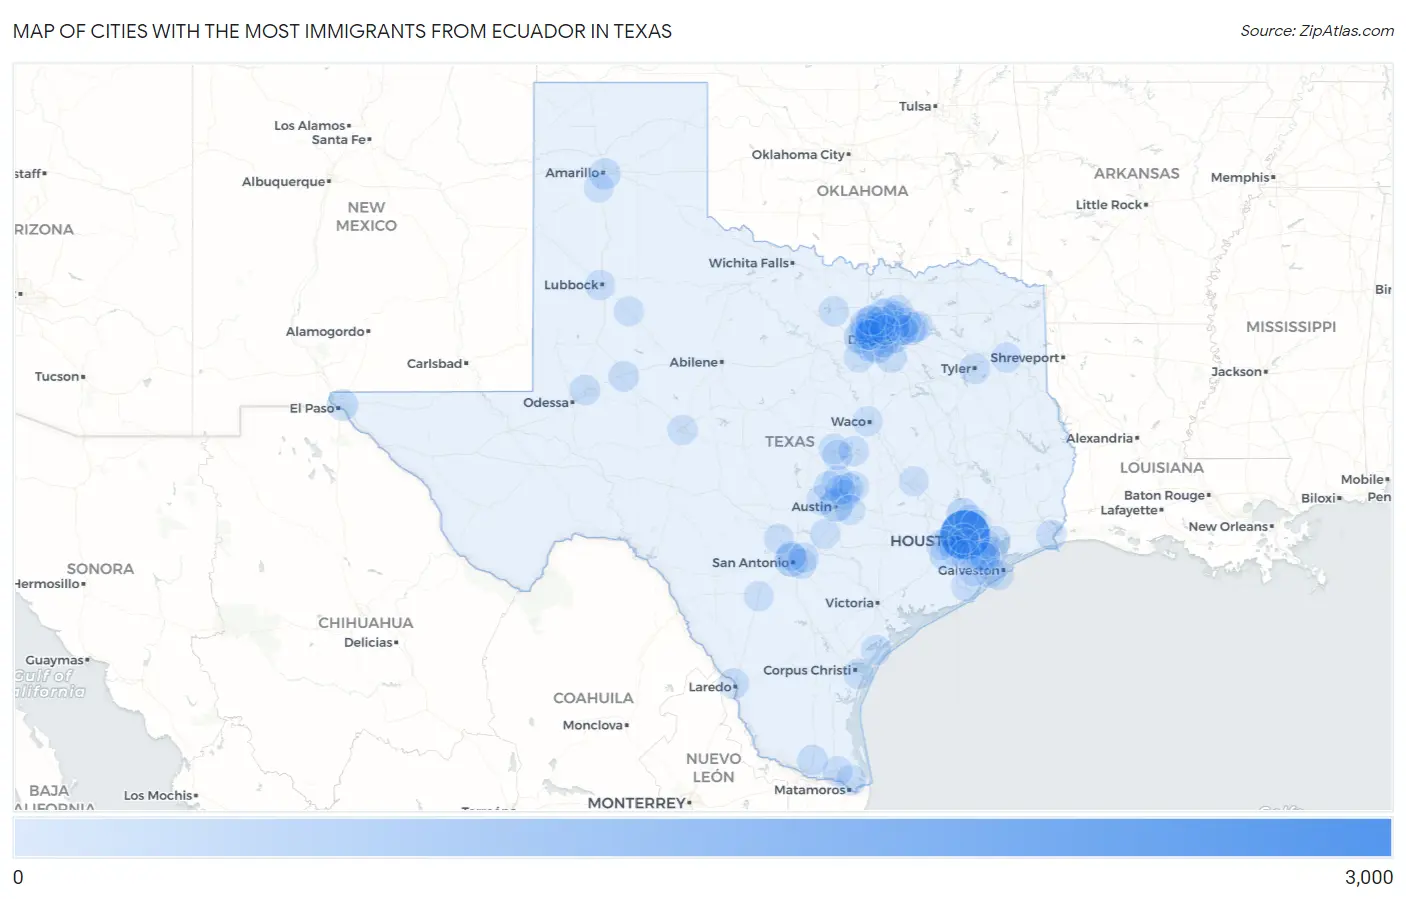
Map of Cities with the Most Immigrants from Ecuador in Texas
0
3,000
Cities with the Most Immigrants from Ecuador in Texas
| City | Ecuador | vs State | vs National | |
| 1. | Houston | 2,644 | 12,456(21.23%)#1 | 480,873(0.55%)#13 |
| 2. | San Antonio | 445 | 12,456(3.57%)#2 | 480,873(0.09%)#117 |
| 3. | Austin | 420 | 12,456(3.37%)#3 | 480,873(0.09%)#125 |
| 4. | Dallas | 405 | 12,456(3.25%)#4 | 480,873(0.08%)#133 |
| 5. | Arlington | 330 | 12,456(2.65%)#5 | 480,873(0.07%)#162 |
| 6. | Fort Worth | 291 | 12,456(2.34%)#6 | 480,873(0.06%)#186 |
| 7. | Grapevine | 264 | 12,456(2.12%)#7 | 480,873(0.05%)#203 |
| 8. | Euless | 258 | 12,456(2.07%)#8 | 480,873(0.05%)#210 |
| 9. | Garland | 227 | 12,456(1.82%)#9 | 480,873(0.05%)#242 |
| 10. | Grand Prairie | 216 | 12,456(1.73%)#10 | 480,873(0.04%)#257 |
| 11. | The Woodlands | 215 | 12,456(1.73%)#11 | 480,873(0.04%)#260 |
| 12. | Frisco | 194 | 12,456(1.56%)#12 | 480,873(0.04%)#284 |
| 13. | El Paso | 169 | 12,456(1.36%)#13 | 480,873(0.04%)#318 |
| 14. | Hutto | 158 | 12,456(1.27%)#14 | 480,873(0.03%)#347 |
| 15. | Spring | 142 | 12,456(1.14%)#15 | 480,873(0.03%)#387 |
| 16. | Amarillo | 140 | 12,456(1.12%)#16 | 480,873(0.03%)#392 |
| 17. | Rosenberg | 134 | 12,456(1.08%)#17 | 480,873(0.03%)#405 |
| 18. | Plano | 133 | 12,456(1.07%)#18 | 480,873(0.03%)#408 |
| 19. | Georgetown | 122 | 12,456(0.98%)#19 | 480,873(0.03%)#440 |
| 20. | Pearland | 105 | 12,456(0.84%)#20 | 480,873(0.02%)#489 |
| 21. | Red Oak | 104 | 12,456(0.83%)#21 | 480,873(0.02%)#497 |
| 22. | Midland | 87 | 12,456(0.70%)#22 | 480,873(0.02%)#562 |
| 23. | Big Spring | 84 | 12,456(0.67%)#23 | 480,873(0.02%)#582 |
| 24. | Tyler | 81 | 12,456(0.65%)#24 | 480,873(0.02%)#591 |
| 25. | Royse City | 79 | 12,456(0.63%)#25 | 480,873(0.02%)#606 |
| 26. | Corpus Christi | 75 | 12,456(0.60%)#26 | 480,873(0.02%)#626 |
| 27. | Laredo | 72 | 12,456(0.58%)#27 | 480,873(0.01%)#648 |
| 28. | Edinburg | 71 | 12,456(0.57%)#28 | 480,873(0.01%)#656 |
| 29. | Irving | 68 | 12,456(0.55%)#29 | 480,873(0.01%)#681 |
| 30. | Hitchcock | 68 | 12,456(0.55%)#30 | 480,873(0.01%)#690 |
| 31. | Port Arthur | 64 | 12,456(0.51%)#31 | 480,873(0.01%)#727 |
| 32. | Southlake | 59 | 12,456(0.47%)#32 | 480,873(0.01%)#767 |
| 33. | Seabrook | 59 | 12,456(0.47%)#33 | 480,873(0.01%)#770 |
| 34. | Baytown | 55 | 12,456(0.44%)#34 | 480,873(0.01%)#802 |
| 35. | Flower Mound | 48 | 12,456(0.39%)#35 | 480,873(0.01%)#883 |
| 36. | Cinco Ranch | 48 | 12,456(0.39%)#36 | 480,873(0.01%)#887 |
| 37. | Humble | 45 | 12,456(0.36%)#37 | 480,873(0.01%)#922 |
| 38. | China Grove | 44 | 12,456(0.35%)#38 | 480,873(0.01%)#942 |
| 39. | Allen | 43 | 12,456(0.35%)#39 | 480,873(0.01%)#945 |
| 40. | Brownsville | 42 | 12,456(0.34%)#40 | 480,873(0.01%)#956 |
| 41. | Sugar Land | 42 | 12,456(0.34%)#41 | 480,873(0.01%)#961 |
| 42. | Longview | 42 | 12,456(0.34%)#42 | 480,873(0.01%)#962 |
| 43. | Rockwall | 41 | 12,456(0.33%)#43 | 480,873(0.01%)#984 |
| 44. | Friendswood | 41 | 12,456(0.33%)#44 | 480,873(0.01%)#986 |
| 45. | Fort Hood | 41 | 12,456(0.33%)#45 | 480,873(0.01%)#988 |
| 46. | Fulton | 41 | 12,456(0.33%)#46 | 480,873(0.01%)#999 |
| 47. | Keller | 40 | 12,456(0.32%)#47 | 480,873(0.01%)#1,005 |
| 48. | Bellaire | 40 | 12,456(0.32%)#48 | 480,873(0.01%)#1,006 |
| 49. | Converse | 39 | 12,456(0.31%)#49 | 480,873(0.01%)#1,017 |
| 50. | Temple | 38 | 12,456(0.31%)#50 | 480,873(0.01%)#1,029 |
| 51. | Fate | 38 | 12,456(0.31%)#51 | 480,873(0.01%)#1,041 |
| 52. | Lake Jackson | 36 | 12,456(0.29%)#52 | 480,873(0.01%)#1,073 |
| 53. | Webster | 35 | 12,456(0.28%)#53 | 480,873(0.01%)#1,099 |
| 54. | Bridgeport | 33 | 12,456(0.26%)#54 | 480,873(0.01%)#1,140 |
| 55. | Town Of Pecos | 32 | 12,456(0.26%)#55 | 480,873(0.01%)#1,156 |
| 56. | Roanoke | 31 | 12,456(0.25%)#56 | 480,873(0.01%)#1,173 |
| 57. | Killeen | 27 | 12,456(0.22%)#57 | 480,873(0.01%)#1,251 |
| 58. | Steiner Ranch | 27 | 12,456(0.22%)#58 | 480,873(0.01%)#1,264 |
| 59. | Lubbock | 26 | 12,456(0.21%)#59 | 480,873(0.01%)#1,278 |
| 60. | Cockrell Hill | 26 | 12,456(0.21%)#60 | 480,873(0.01%)#1,297 |
| 61. | Rockwell Place | 26 | 12,456(0.21%)#61 | 480,873(0.01%)#1,300 |
| 62. | Harlingen | 25 | 12,456(0.20%)#62 | 480,873(0.01%)#1,302 |
| 63. | Fulshear | 24 | 12,456(0.19%)#63 | 480,873(0.00%)#1,349 |
| 64. | Wylie | 23 | 12,456(0.18%)#64 | 480,873(0.00%)#1,367 |
| 65. | Point Venture | 23 | 12,456(0.18%)#65 | 480,873(0.00%)#1,382 |
| 66. | Waco | 22 | 12,456(0.18%)#66 | 480,873(0.00%)#1,385 |
| 67. | Deer Park | 22 | 12,456(0.18%)#67 | 480,873(0.00%)#1,393 |
| 68. | Castle Hills | 21 | 12,456(0.17%)#68 | 480,873(0.00%)#1,454 |
| 69. | Richardson | 20 | 12,456(0.16%)#69 | 480,873(0.00%)#1,460 |
| 70. | League City | 20 | 12,456(0.16%)#70 | 480,873(0.00%)#1,461 |
| 71. | Pflugerville | 20 | 12,456(0.16%)#71 | 480,873(0.00%)#1,462 |
| 72. | Seis Lagos | 20 | 12,456(0.16%)#72 | 480,873(0.00%)#1,482 |
| 73. | Leander | 19 | 12,456(0.15%)#73 | 480,873(0.00%)#1,487 |
| 74. | Boerne | 18 | 12,456(0.14%)#74 | 480,873(0.00%)#1,546 |
| 75. | Carrollton | 17 | 12,456(0.14%)#75 | 480,873(0.00%)#1,574 |
| 76. | Rowlett | 17 | 12,456(0.14%)#76 | 480,873(0.00%)#1,581 |
| 77. | Hurst | 17 | 12,456(0.14%)#77 | 480,873(0.00%)#1,588 |
| 78. | Colleyville | 17 | 12,456(0.14%)#78 | 480,873(0.00%)#1,593 |
| 79. | Taylor | 16 | 12,456(0.13%)#79 | 480,873(0.00%)#1,647 |
| 80. | Round Rock | 14 | 12,456(0.11%)#80 | 480,873(0.00%)#1,715 |
| 81. | Galveston | 14 | 12,456(0.11%)#81 | 480,873(0.00%)#1,719 |
| 82. | Fresno | 14 | 12,456(0.11%)#82 | 480,873(0.00%)#1,730 |
| 83. | Hackberry | 14 | 12,456(0.11%)#83 | 480,873(0.00%)#1,753 |
| 84. | San Angelo | 13 | 12,456(0.10%)#84 | 480,873(0.00%)#1,762 |
| 85. | Bryan | 13 | 12,456(0.10%)#85 | 480,873(0.00%)#1,763 |
| 86. | San Marcos | 13 | 12,456(0.10%)#86 | 480,873(0.00%)#1,766 |
| 87. | Alvin | 13 | 12,456(0.10%)#87 | 480,873(0.00%)#1,772 |
| 88. | North Richland Hills | 12 | 12,456(0.10%)#88 | 480,873(0.00%)#1,807 |
| 89. | Coppell | 12 | 12,456(0.10%)#89 | 480,873(0.00%)#1,811 |
| 90. | Post | 12 | 12,456(0.10%)#90 | 480,873(0.00%)#1,843 |
| 91. | Pearsall | 11 | 12,456(0.09%)#91 | 480,873(0.00%)#1,892 |
| 92. | Burleson | 10 | 12,456(0.08%)#92 | 480,873(0.00%)#1,921 |
| 93. | Canyon | 10 | 12,456(0.08%)#93 | 480,873(0.00%)#1,943 |
| 94. | Mckinney | 9 | 12,456(0.07%)#94 | 480,873(0.00%)#1,981 |
| 95. | Lewisville | 9 | 12,456(0.07%)#95 | 480,873(0.00%)#1,982 |
| 96. | Bedford | 9 | 12,456(0.07%)#96 | 480,873(0.00%)#1,992 |
| 97. | Farmers Branch | 9 | 12,456(0.07%)#97 | 480,873(0.00%)#1,993 |
| 98. | Spring Valley Village | 8 | 12,456(0.06%)#98 | 480,873(0.00%)#2,093 |
| 99. | Double Oak | 8 | 12,456(0.06%)#99 | 480,873(0.00%)#2,097 |
| 100. | Webberville | 8 | 12,456(0.06%)#100 | 480,873(0.00%)#2,113 |
Common Questions
What are the Top 10 Cities with the Most Immigrants from Ecuador in Texas?
Top 10 Cities with the Most Immigrants from Ecuador in Texas are:
#1
2,644
#2
445
#3
420
#4
405
#5
330
#6
291
#7
264
#8
258
#9
227
#10
216
What city has the Most Immigrants from Ecuador in Texas?
Houston has the Most Immigrants from Ecuador in Texas with 2,644.
What is the Total Immigrants from Ecuador in the State of Texas?
Total Immigrants from Ecuador in Texas is 12,456.
What is the Total Immigrants from Ecuador in the United States?
Total Immigrants from Ecuador in the United States is 480,873.