Cities with the Highest Percentage of Immigrants from Jamaica in Texas
RELATED REPORTS & OPTIONS
Jamaica
Texas
Compare Cities
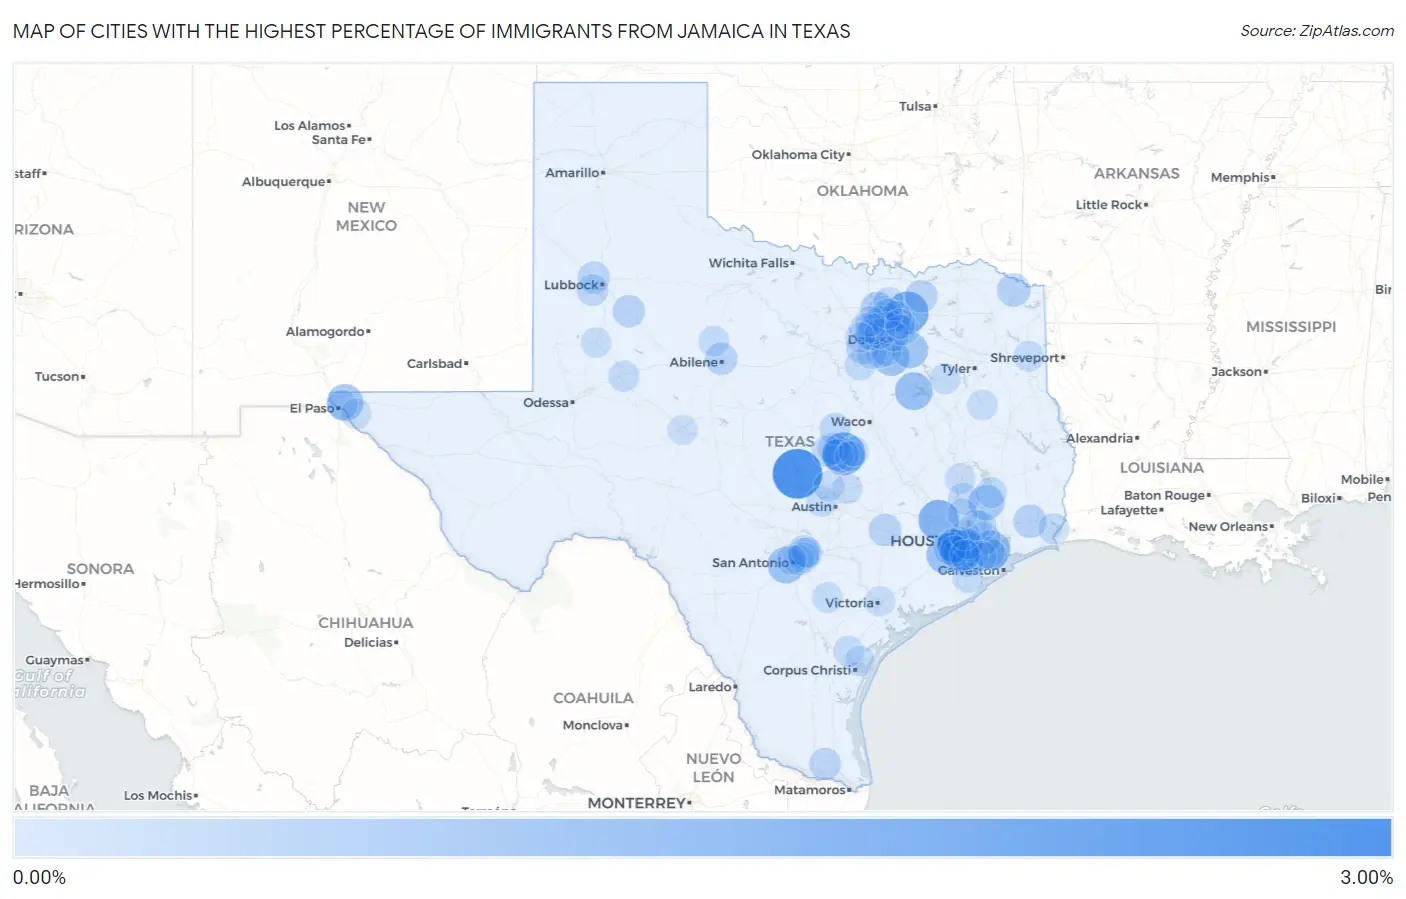
Map of Cities with the Highest Percentage of Immigrants from Jamaica in Texas
0.00%
3.00%
Cities with the Highest Percentage of Immigrants from Jamaica in Texas
| City | Jamaica | vs State | vs National | |
| 1. | Buchanan Dam | 2.90% | 0.061%(+2.84)#810 | 0.24%(+2.67)#4,637 |
| 2. | Nolanville | 1.88% | 0.061%(+1.82)#951 | 0.24%(+1.65)#5,990 |
| 3. | Stafford | 1.86% | 0.061%(+1.80)#952 | 0.24%(+1.62)#5,991 |
| 4. | Princeton | 1.77% | 0.061%(+1.71)#953 | 0.24%(+1.53)#5,992 |
| 5. | Waller | 1.57% | 0.061%(+1.51)#954 | 0.24%(+1.33)#5,993 |
| 6. | Shoreacres | 1.21% | 0.061%(+1.15)#955 | 0.24%(+0.969)#5,994 |
| 7. | Navarro | 1.14% | 0.061%(+1.08)#1,137 | 0.24%(+0.899)#8,359 |
| 8. | Rosenberg | 1.04% | 0.061%(+0.980)#1,138 | 0.24%(+0.803)#8,360 |
| 9. | Lackland Afb | 1.02% | 0.061%(+0.957)#1,139 | 0.24%(+0.780)#8,361 |
| 10. | Fort Bliss | 0.99% | 0.061%(+0.930)#1,140 | 0.24%(+0.754)#8,362 |
| 11. | Red Oak | 0.98% | 0.061%(+0.916)#1,141 | 0.24%(+0.739)#8,363 |
| 12. | Crandall | 0.92% | 0.061%(+0.858)#1,142 | 0.24%(+0.681)#8,364 |
| 13. | Meadows Place | 0.89% | 0.061%(+0.829)#1,143 | 0.24%(+0.653)#8,365 |
| 14. | Cleveland | 0.81% | 0.061%(+0.752)#1,144 | 0.24%(+0.575)#8,366 |
| 15. | Harker Heights | 0.77% | 0.061%(+0.711)#1,145 | 0.24%(+0.534)#8,367 |
| 16. | Missouri City | 0.67% | 0.061%(+0.610)#1,146 | 0.24%(+0.434)#8,368 |
| 17. | Cross Roads | 0.58% | 0.061%(+0.522)#1,147 | 0.24%(+0.345)#8,369 |
| 18. | Mission Bend | 0.56% | 0.061%(+0.502)#1,148 | 0.24%(+0.325)#8,370 |
| 19. | Four Corners | 0.50% | 0.061%(+0.443)#1,149 | 0.24%(+0.267)#8,371 |
| 20. | De Kalb | 0.50% | 0.061%(+0.436)#1,150 | 0.24%(+0.260)#8,372 |
| 21. | China | 0.49% | 0.061%(+0.429)#1,207 | 0.24%(+0.252)#9,512 |
| 22. | Forest Hill | 0.42% | 0.061%(+0.359)#1,208 | 0.24%(+0.183)#9,513 |
| 23. | Leonard | 0.41% | 0.061%(+0.344)#1,209 | 0.24%(+0.168)#9,514 |
| 24. | Pecan Grove | 0.39% | 0.061%(+0.330)#1,210 | 0.24%(+0.153)#9,515 |
| 25. | La Grange | 0.38% | 0.061%(+0.324)#1,211 | 0.24%(+0.148)#9,516 |
| 26. | Abilene | 0.38% | 0.061%(+0.314)#1,212 | 0.24%(+0.138)#9,517 |
| 27. | Post | 0.37% | 0.061%(+0.306)#1,213 | 0.24%(+0.130)#9,518 |
| 28. | Selma | 0.36% | 0.061%(+0.301)#1,214 | 0.24%(+0.124)#9,519 |
| 29. | Shallowater | 0.34% | 0.061%(+0.281)#1,215 | 0.24%(+0.104)#9,520 |
| 30. | La Villa | 0.31% | 0.061%(+0.253)#1,216 | 0.24%(+0.076)#9,521 |
| 31. | Wolfforth | 0.28% | 0.061%(+0.216)#1,217 | 0.24%(+0.039)#9,522 |
| 32. | Fort Hood | 0.27% | 0.061%(+0.206)#1,218 | 0.24%(+0.030)#9,523 |
| 33. | Kemah | 0.26% | 0.061%(+0.196)#1,219 | 0.24%(+0.020)#9,524 |
| 34. | Universal City | 0.24% | 0.061%(+0.182)#1,220 | 0.24%(+0.005)#9,525 |
| 35. | Gatesville | 0.24% | 0.061%(+0.179)#1,221 | 0.24%(+0.002)#9,526 |
| 36. | Killeen | 0.24% | 0.061%(+0.178)#1,222 | 0.24%(+0.001)#9,527 |
| 37. | Panorama Village | 0.24% | 0.061%(+0.178)#1,410 | 0.24%(+0.001)#14,299 |
| 38. | El Lago | 0.23% | 0.061%(+0.170)#1,411 | 0.24%(-0.007)#14,300 |
| 39. | Channelview | 0.23% | 0.061%(+0.168)#1,412 | 0.24%(-0.008)#14,301 |
| 40. | Pearland | 0.23% | 0.061%(+0.165)#1,413 | 0.24%(-0.012)#14,302 |
| 41. | Copperas Cove | 0.19% | 0.061%(+0.126)#1,414 | 0.24%(-0.051)#14,303 |
| 42. | Euless | 0.18% | 0.061%(+0.122)#1,415 | 0.24%(-0.055)#14,304 |
| 43. | Iowa Colony | 0.18% | 0.061%(+0.118)#1,416 | 0.24%(-0.058)#14,305 |
| 44. | The Colony | 0.17% | 0.061%(+0.113)#1,417 | 0.24%(-0.064)#14,306 |
| 45. | Big Spring | 0.17% | 0.061%(+0.113)#1,418 | 0.24%(-0.064)#14,307 |
| 46. | Shepherd | 0.17% | 0.061%(+0.112)#1,419 | 0.24%(-0.065)#14,308 |
| 47. | Keene | 0.17% | 0.061%(+0.110)#1,420 | 0.24%(-0.067)#14,309 |
| 48. | Groves | 0.17% | 0.061%(+0.109)#1,421 | 0.24%(-0.068)#14,310 |
| 49. | Sinton | 0.16% | 0.061%(+0.103)#1,422 | 0.24%(-0.074)#14,311 |
| 50. | Karnes City | 0.16% | 0.061%(+0.100)#1,423 | 0.24%(-0.077)#14,312 |
| 51. | Atascocita | 0.16% | 0.061%(+0.098)#1,424 | 0.24%(-0.079)#14,313 |
| 52. | Humble | 0.16% | 0.061%(+0.096)#1,425 | 0.24%(-0.080)#14,314 |
| 53. | West University Place | 0.15% | 0.061%(+0.093)#1,426 | 0.24%(-0.084)#14,315 |
| 54. | Anson | 0.15% | 0.061%(+0.089)#1,427 | 0.24%(-0.087)#14,316 |
| 55. | Angleton | 0.15% | 0.061%(+0.088)#1,428 | 0.24%(-0.088)#14,317 |
| 56. | Friendswood | 0.14% | 0.061%(+0.084)#1,429 | 0.24%(-0.093)#14,318 |
| 57. | Little Elm | 0.14% | 0.061%(+0.076)#1,430 | 0.24%(-0.101)#14,319 |
| 58. | Lakeway | 0.13% | 0.061%(+0.072)#1,431 | 0.24%(-0.105)#14,320 |
| 59. | Sugar Land | 0.13% | 0.061%(+0.072)#1,432 | 0.24%(-0.105)#14,321 |
| 60. | Marshall | 0.13% | 0.061%(+0.071)#1,433 | 0.24%(-0.106)#14,322 |
| 61. | Celina | 0.13% | 0.061%(+0.070)#1,434 | 0.24%(-0.107)#14,323 |
| 62. | Converse | 0.13% | 0.061%(+0.068)#1,435 | 0.24%(-0.109)#14,324 |
| 63. | Lewisville | 0.13% | 0.061%(+0.067)#1,436 | 0.24%(-0.109)#14,325 |
| 64. | Athens | 0.12% | 0.061%(+0.064)#1,437 | 0.24%(-0.113)#14,326 |
| 65. | Rowlett | 0.12% | 0.061%(+0.063)#1,438 | 0.24%(-0.114)#14,327 |
| 66. | Cedar Hill | 0.12% | 0.061%(+0.060)#1,439 | 0.24%(-0.116)#14,328 |
| 67. | Allen | 0.12% | 0.061%(+0.059)#1,440 | 0.24%(-0.118)#14,329 |
| 68. | Keller | 0.12% | 0.061%(+0.056)#1,441 | 0.24%(-0.120)#14,330 |
| 69. | Richardson | 0.11% | 0.061%(+0.054)#1,442 | 0.24%(-0.123)#14,331 |
| 70. | Mansfield | 0.11% | 0.061%(+0.052)#1,443 | 0.24%(-0.125)#14,332 |
| 71. | Rusk | 0.11% | 0.061%(+0.052)#1,444 | 0.24%(-0.125)#14,333 |
| 72. | Houston | 0.11% | 0.061%(+0.048)#1,445 | 0.24%(-0.128)#14,334 |
| 73. | Leander | 0.11% | 0.061%(+0.047)#1,446 | 0.24%(-0.130)#14,335 |
| 74. | Huntsville | 0.11% | 0.061%(+0.045)#1,447 | 0.24%(-0.131)#14,336 |
| 75. | Desoto | 0.10% | 0.061%(+0.041)#1,448 | 0.24%(-0.135)#14,337 |
| 76. | Hutto | 0.10% | 0.061%(+0.041)#1,449 | 0.24%(-0.136)#14,338 |
| 77. | Kirby | 0.098% | 0.061%(+0.038)#1,450 | 0.24%(-0.139)#14,339 |
| 78. | Horizon City | 0.098% | 0.061%(+0.037)#1,451 | 0.24%(-0.140)#14,340 |
| 79. | Bedford | 0.097% | 0.061%(+0.036)#1,452 | 0.24%(-0.140)#14,341 |
| 80. | Lamesa | 0.093% | 0.061%(+0.033)#1,453 | 0.24%(-0.144)#14,342 |
| 81. | Addison | 0.088% | 0.061%(+0.027)#1,454 | 0.24%(-0.149)#14,343 |
| 82. | Schertz | 0.087% | 0.061%(+0.026)#1,455 | 0.24%(-0.150)#14,344 |
| 83. | Grapevine | 0.083% | 0.061%(+0.022)#1,456 | 0.24%(-0.155)#14,345 |
| 84. | El Paso | 0.082% | 0.061%(+0.021)#1,457 | 0.24%(-0.156)#14,346 |
| 85. | Garland | 0.077% | 0.061%(+0.017)#1,458 | 0.24%(-0.160)#14,347 |
| 86. | Fresno | 0.076% | 0.061%(+0.016)#1,459 | 0.24%(-0.161)#14,348 |
| 87. | Dallas | 0.075% | 0.061%(+0.015)#1,460 | 0.24%(-0.162)#14,349 |
| 88. | Portland | 0.075% | 0.061%(+0.014)#1,461 | 0.24%(-0.163)#14,350 |
| 89. | Southlake | 0.062% | 0.061%(+0.001)#1,462 | 0.24%(-0.176)#14,351 |
| 90. | Irving | 0.060% | 0.061%(-0.001)#1,463 | 0.24%(-0.178)#14,352 |
| 91. | Belton | 0.056% | 0.061%(-0.005)#1,464 | 0.24%(-0.181)#14,353 |
| 92. | The Woodlands | 0.056% | 0.061%(-0.005)#1,465 | 0.24%(-0.182)#14,354 |
| 93. | Murphy | 0.053% | 0.061%(-0.008)#1,466 | 0.24%(-0.185)#15,735 |
| 94. | San Antonio | 0.049% | 0.061%(-0.012)#1,467 | 0.24%(-0.188)#15,736 |
| 95. | Victoria | 0.049% | 0.061%(-0.012)#1,468 | 0.24%(-0.189)#15,737 |
| 96. | Frisco | 0.048% | 0.061%(-0.013)#1,469 | 0.24%(-0.189)#15,738 |
| 97. | Flower Mound | 0.047% | 0.061%(-0.014)#1,470 | 0.24%(-0.190)#15,739 |
| 98. | Temple | 0.047% | 0.061%(-0.014)#1,471 | 0.24%(-0.191)#15,740 |
| 99. | Fort Worth | 0.046% | 0.061%(-0.014)#1,472 | 0.24%(-0.191)#15,741 |
| 100. | San Angelo | 0.046% | 0.061%(-0.014)#1,473 | 0.24%(-0.191)#15,742 |
Common Questions
What are the Top 10 Cities with the Highest Percentage of Immigrants from Jamaica in Texas?
Top 10 Cities with the Highest Percentage of Immigrants from Jamaica in Texas are:
#1
2.90%
#2
1.88%
#3
1.86%
#4
1.77%
#5
1.57%
#6
1.21%
#7
1.14%
#8
1.04%
#9
1.02%
#10
0.99%
What city has the Highest Percentage of Immigrants from Jamaica in Texas?
Buchanan Dam has the Highest Percentage of Immigrants from Jamaica in Texas with 2.90%.
What is the Percentage of Immigrants from Jamaica in the State of Texas?
Percentage of Immigrants from Jamaica in Texas is 0.061%.
What is the Percentage of Immigrants from Jamaica in the United States?
Percentage of Immigrants from Jamaica in the United States is 0.24%.