Zip Codes with the Highest Percentage of Population with a Degree in Visual and Performing Arts in Baytown, TX
RELATED REPORTS & OPTIONS
Visual and Performing Arts
Baytown
Compare Zip Codes
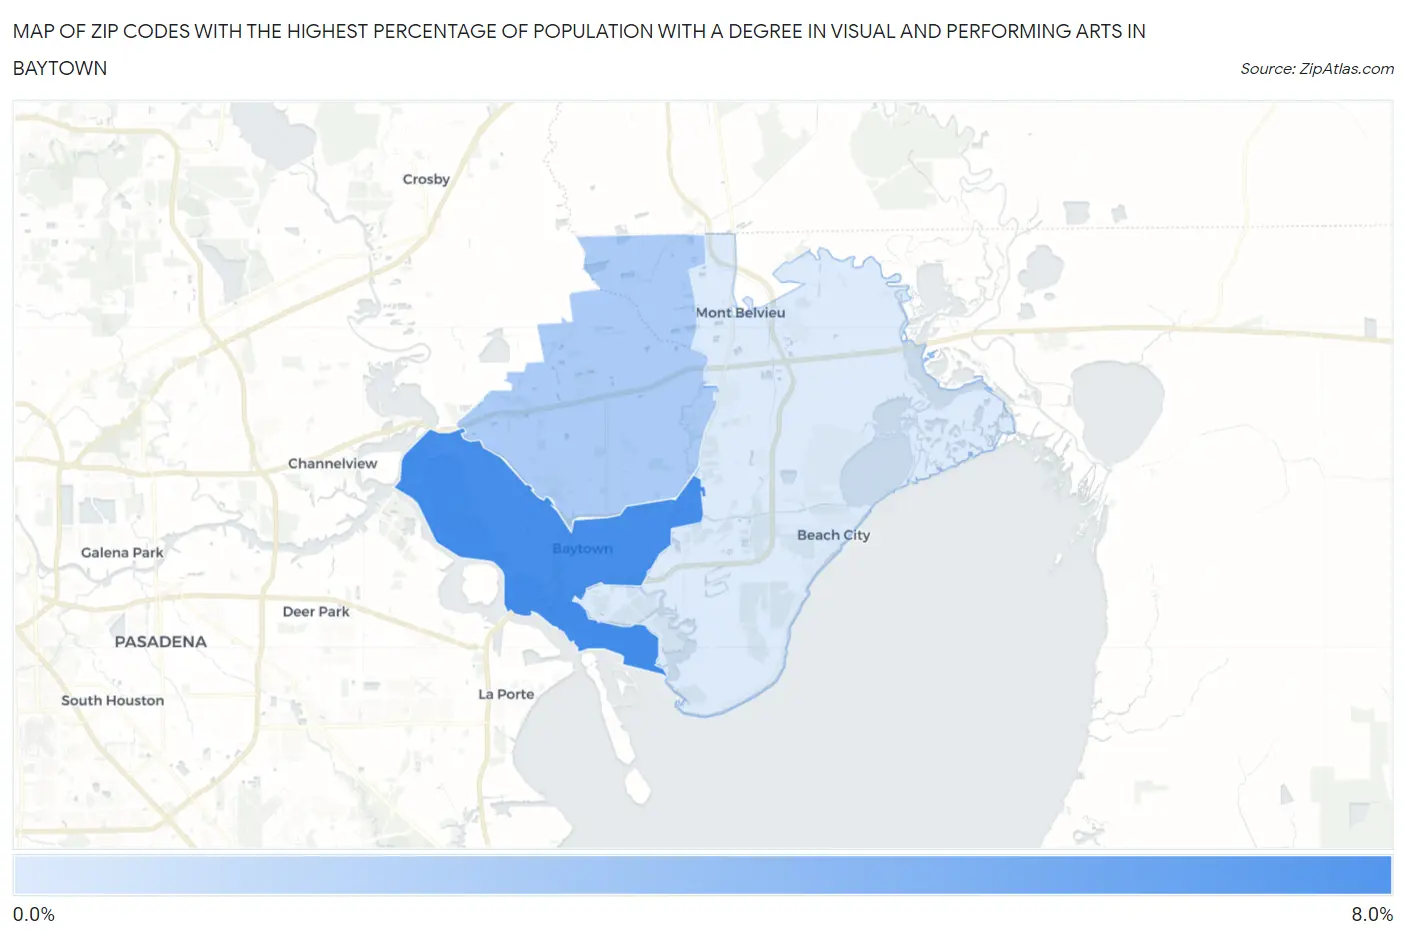
Map of Zip Codes with the Highest Percentage of Population with a Degree in Visual and Performing Arts in Baytown
0.0%
8.0%
Zip Codes with the Highest Percentage of Population with a Degree in Visual and Performing Arts in Baytown, TX
| Zip Code | % Graduates | vs State | vs National | |
| 1. | 77520 | 6.2% | 3.2%(+3.01)#183 | 4.3%(+1.97)#4,572 |
| 2. | 77521 | 2.5% | 3.2%(-0.707)#717 | 4.3%(-1.75)#14,610 |
| 3. | 77523 | 0.61% | 3.2%(-2.60)#1,180 | 4.3%(-3.64)#20,530 |
1
Common Questions
What are the Top Zip Codes with the Highest Percentage of Population with a Degree in Visual and Performing Arts in Baytown, TX?
Top Zip Codes with the Highest Percentage of Population with a Degree in Visual and Performing Arts in Baytown, TX are:
What zip code has the Highest Percentage of Population with a Degree in Visual and Performing Arts in Baytown, TX?
77520 has the Highest Percentage of Population with a Degree in Visual and Performing Arts in Baytown, TX with 6.2%.
What is the Percentage of Population with a Degree in Visual and Performing Arts in Baytown, TX?
Percentage of Population with a Degree in Visual and Performing Arts in Baytown is 3.5%.
What is the Percentage of Population with a Degree in Visual and Performing Arts in Texas?
Percentage of Population with a Degree in Visual and Performing Arts in Texas is 3.2%.
What is the Percentage of Population with a Degree in Visual and Performing Arts in the United States?
Percentage of Population with a Degree in Visual and Performing Arts in the United States is 4.3%.