Zip Codes with the Highest Percentage of Population with a Degree in Visual and Performing Arts in Harlingen, TX
RELATED REPORTS & OPTIONS
Visual and Performing Arts
Harlingen
Compare Zip Codes
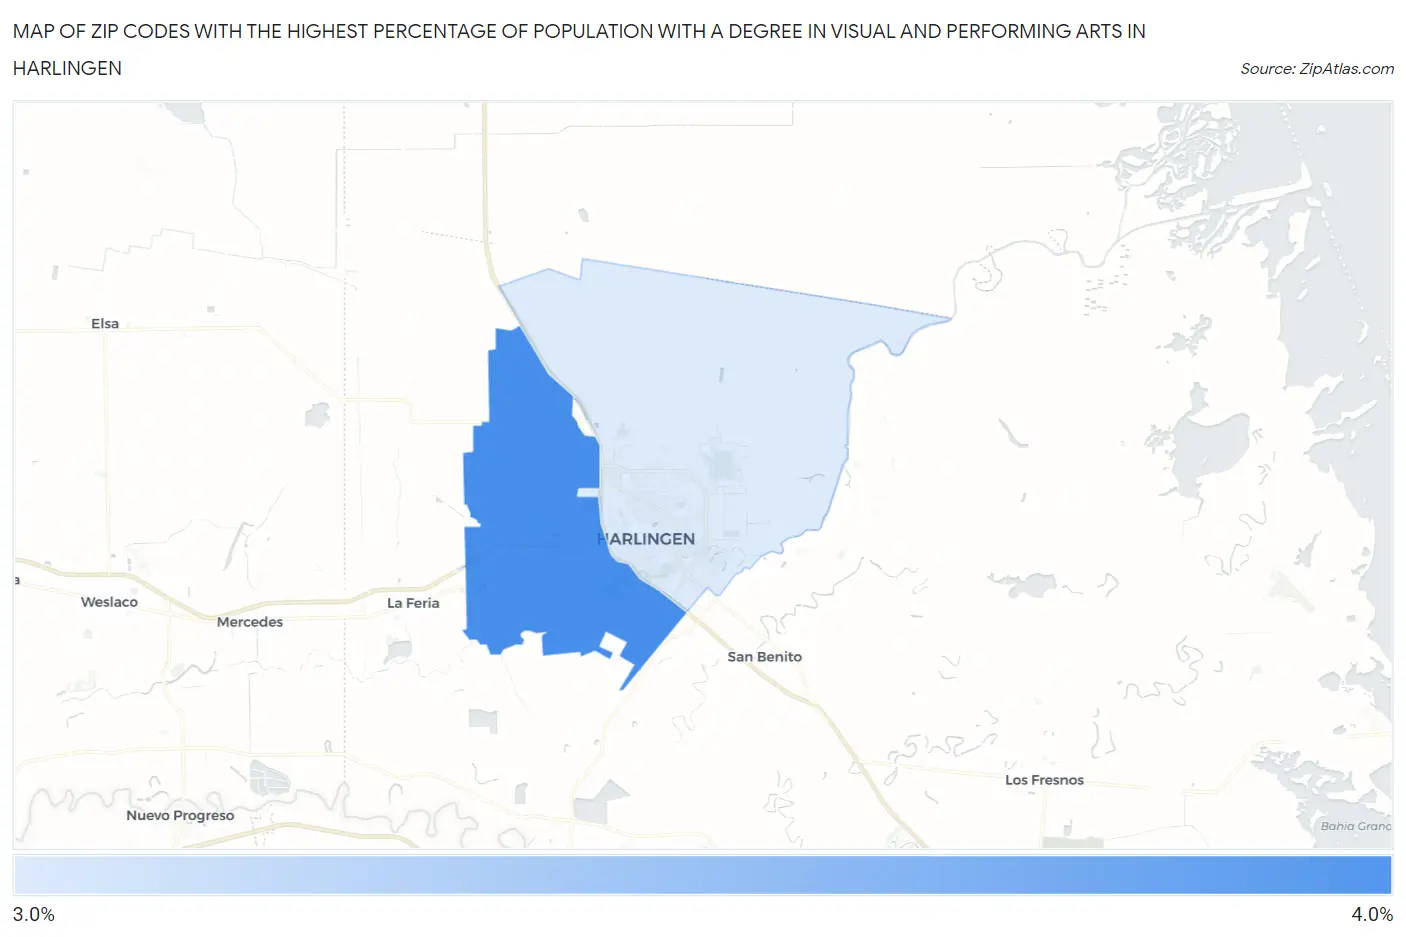
Map of Zip Codes with the Highest Percentage of Population with a Degree in Visual and Performing Arts in Harlingen
0.0%
4.0%
Zip Codes with the Highest Percentage of Population with a Degree in Visual and Performing Arts in Harlingen, TX
| Zip Code | % Graduates | vs State | vs National | |
| 1. | 78552 | 3.6% | 3.2%(+0.361)#478 | 4.3%(-0.681)#10,619 |
| 2. | 78550 | 3.3% | 3.2%(+0.133)#519 | 4.3%(-0.910)#11,445 |
1
Common Questions
What are the Top Zip Codes with the Highest Percentage of Population with a Degree in Visual and Performing Arts in Harlingen, TX?
Top Zip Codes with the Highest Percentage of Population with a Degree in Visual and Performing Arts in Harlingen, TX are:
What zip code has the Highest Percentage of Population with a Degree in Visual and Performing Arts in Harlingen, TX?
78552 has the Highest Percentage of Population with a Degree in Visual and Performing Arts in Harlingen, TX with 3.6%.
What is the Percentage of Population with a Degree in Visual and Performing Arts in Harlingen, TX?
Percentage of Population with a Degree in Visual and Performing Arts in Harlingen is 4.2%.
What is the Percentage of Population with a Degree in Visual and Performing Arts in Texas?
Percentage of Population with a Degree in Visual and Performing Arts in Texas is 3.2%.
What is the Percentage of Population with a Degree in Visual and Performing Arts in the United States?
Percentage of Population with a Degree in Visual and Performing Arts in the United States is 4.3%.