Cities with the Most Immigrants from Peru in Texas
RELATED REPORTS & OPTIONS
Peru
Texas
Compare Cities
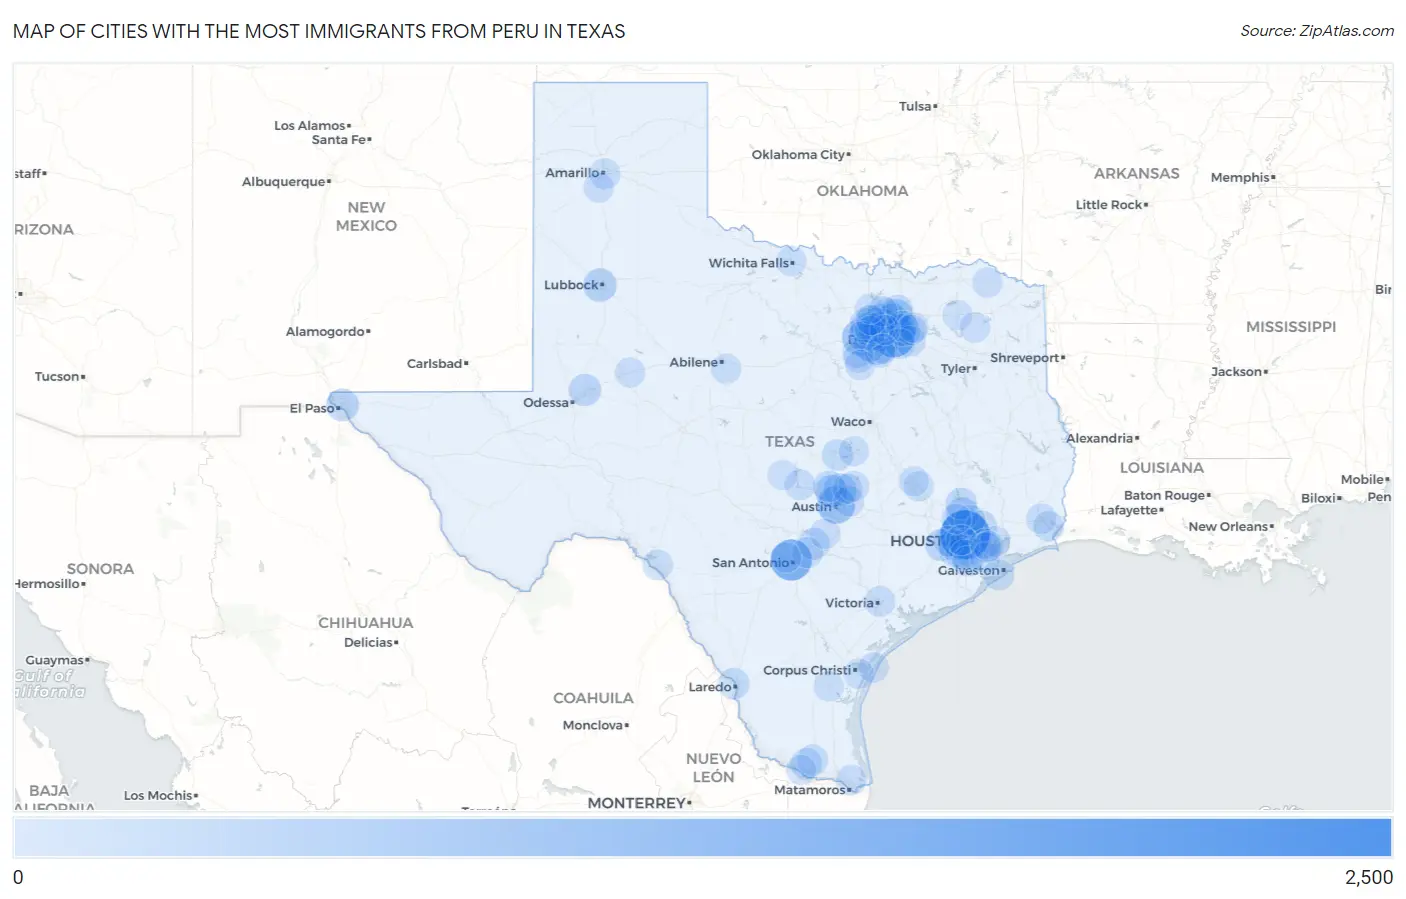
Map of Cities with the Most Immigrants from Peru in Texas
0
2,500
Cities with the Most Immigrants from Peru in Texas
| City | Peru | vs State | vs National | |
| 1. | Houston | 2,064 | 21,746(9.49%)#1 | 461,322(0.45%)#15 |
| 2. | Dallas | 1,257 | 21,746(5.78%)#2 | 461,322(0.27%)#42 |
| 3. | San Antonio | 1,163 | 21,746(5.35%)#3 | 461,322(0.25%)#47 |
| 4. | Austin | 773 | 21,746(3.55%)#4 | 461,322(0.17%)#82 |
| 5. | Fort Worth | 604 | 21,746(2.78%)#5 | 461,322(0.13%)#118 |
| 6. | Irving | 539 | 21,746(2.48%)#6 | 461,322(0.12%)#135 |
| 7. | Allen | 441 | 21,746(2.03%)#7 | 461,322(0.10%)#175 |
| 8. | Grand Prairie | 439 | 21,746(2.02%)#8 | 461,322(0.10%)#177 |
| 9. | Lewisville | 408 | 21,746(1.88%)#9 | 461,322(0.09%)#198 |
| 10. | Lubbock | 334 | 21,746(1.54%)#10 | 461,322(0.07%)#247 |
| 11. | Arlington | 315 | 21,746(1.45%)#11 | 461,322(0.07%)#261 |
| 12. | Plano | 312 | 21,746(1.43%)#12 | 461,322(0.07%)#266 |
| 13. | Round Rock | 310 | 21,746(1.43%)#13 | 461,322(0.07%)#271 |
| 14. | Cedar Park | 285 | 21,746(1.31%)#14 | 461,322(0.06%)#296 |
| 15. | The Woodlands | 273 | 21,746(1.26%)#15 | 461,322(0.06%)#311 |
| 16. | El Paso | 266 | 21,746(1.22%)#16 | 461,322(0.06%)#322 |
| 17. | Rowlett | 261 | 21,746(1.20%)#17 | 461,322(0.06%)#325 |
| 18. | Midland | 235 | 21,746(1.08%)#18 | 461,322(0.05%)#357 |
| 19. | Garland | 217 | 21,746(1.00%)#19 | 461,322(0.05%)#384 |
| 20. | Fulshear | 194 | 21,746(0.89%)#20 | 461,322(0.04%)#433 |
| 21. | Carrollton | 187 | 21,746(0.86%)#21 | 461,322(0.04%)#447 |
| 22. | Conroe | 186 | 21,746(0.86%)#22 | 461,322(0.04%)#451 |
| 23. | New Braunfels | 183 | 21,746(0.84%)#23 | 461,322(0.04%)#462 |
| 24. | Sugar Land | 147 | 21,746(0.68%)#24 | 461,322(0.03%)#568 |
| 25. | Killeen | 145 | 21,746(0.67%)#25 | 461,322(0.03%)#572 |
| 26. | Atascocita | 144 | 21,746(0.66%)#26 | 461,322(0.03%)#579 |
| 27. | Leander | 136 | 21,746(0.63%)#27 | 461,322(0.03%)#602 |
| 28. | Laredo | 133 | 21,746(0.61%)#28 | 461,322(0.03%)#613 |
| 29. | Frisco | 132 | 21,746(0.61%)#29 | 461,322(0.03%)#616 |
| 30. | Missouri City | 120 | 21,746(0.55%)#30 | 461,322(0.03%)#660 |
| 31. | Galveston | 117 | 21,746(0.54%)#31 | 461,322(0.03%)#672 |
| 32. | Mcallen | 114 | 21,746(0.52%)#32 | 461,322(0.02%)#684 |
| 33. | Euless | 110 | 21,746(0.51%)#33 | 461,322(0.02%)#708 |
| 34. | Edinburg | 106 | 21,746(0.49%)#34 | 461,322(0.02%)#724 |
| 35. | Mission Bend | 105 | 21,746(0.48%)#35 | 461,322(0.02%)#730 |
| 36. | Mckinney | 100 | 21,746(0.46%)#36 | 461,322(0.02%)#761 |
| 37. | Flower Mound | 100 | 21,746(0.46%)#37 | 461,322(0.02%)#762 |
| 38. | North Richland Hills | 94 | 21,746(0.43%)#38 | 461,322(0.02%)#809 |
| 39. | Forney | 90 | 21,746(0.41%)#39 | 461,322(0.02%)#831 |
| 40. | Victoria | 82 | 21,746(0.38%)#40 | 461,322(0.02%)#885 |
| 41. | Sachse | 81 | 21,746(0.37%)#41 | 461,322(0.02%)#893 |
| 42. | Granite Shoals | 81 | 21,746(0.37%)#42 | 461,322(0.02%)#897 |
| 43. | Keller | 80 | 21,746(0.37%)#43 | 461,322(0.02%)#901 |
| 44. | Schertz | 80 | 21,746(0.37%)#44 | 461,322(0.02%)#902 |
| 45. | Pearland | 79 | 21,746(0.36%)#45 | 461,322(0.02%)#908 |
| 46. | Crowley | 77 | 21,746(0.35%)#46 | 461,322(0.02%)#926 |
| 47. | Amarillo | 75 | 21,746(0.34%)#47 | 461,322(0.02%)#937 |
| 48. | Cinco Ranch | 71 | 21,746(0.33%)#48 | 461,322(0.02%)#986 |
| 49. | Manor | 68 | 21,746(0.31%)#49 | 461,322(0.01%)#1,019 |
| 50. | Rockwall | 65 | 21,746(0.30%)#50 | 461,322(0.01%)#1,038 |
| 51. | Southlake | 61 | 21,746(0.28%)#51 | 461,322(0.01%)#1,081 |
| 52. | Taylor | 61 | 21,746(0.28%)#52 | 461,322(0.01%)#1,084 |
| 53. | Spring | 59 | 21,746(0.27%)#53 | 461,322(0.01%)#1,112 |
| 54. | Del Rio | 59 | 21,746(0.27%)#54 | 461,322(0.01%)#1,113 |
| 55. | Bellaire | 59 | 21,746(0.27%)#55 | 461,322(0.01%)#1,118 |
| 56. | Nederland | 58 | 21,746(0.27%)#56 | 461,322(0.01%)#1,131 |
| 57. | Beaumont | 57 | 21,746(0.26%)#57 | 461,322(0.01%)#1,135 |
| 58. | San Marcos | 50 | 21,746(0.23%)#58 | 461,322(0.01%)#1,244 |
| 59. | Coppell | 50 | 21,746(0.23%)#59 | 461,322(0.01%)#1,247 |
| 60. | Roanoke | 46 | 21,746(0.21%)#60 | 461,322(0.01%)#1,319 |
| 61. | Fresno | 43 | 21,746(0.20%)#61 | 461,322(0.01%)#1,366 |
| 62. | League City | 42 | 21,746(0.19%)#62 | 461,322(0.01%)#1,381 |
| 63. | Burleson | 42 | 21,746(0.19%)#63 | 461,322(0.01%)#1,383 |
| 64. | Canyon | 41 | 21,746(0.19%)#64 | 461,322(0.01%)#1,401 |
| 65. | Brownsville | 39 | 21,746(0.18%)#65 | 461,322(0.01%)#1,423 |
| 66. | Iowa Colony | 39 | 21,746(0.18%)#66 | 461,322(0.01%)#1,436 |
| 67. | Grapevine | 37 | 21,746(0.17%)#67 | 461,322(0.01%)#1,471 |
| 68. | Mission | 35 | 21,746(0.16%)#68 | 461,322(0.01%)#1,509 |
| 69. | Winnsboro | 35 | 21,746(0.16%)#69 | 461,322(0.01%)#1,531 |
| 70. | Balch Springs | 33 | 21,746(0.15%)#70 | 461,322(0.01%)#1,560 |
| 71. | Port Aransas | 33 | 21,746(0.15%)#71 | 461,322(0.01%)#1,579 |
| 72. | Little Elm | 32 | 21,746(0.15%)#72 | 461,322(0.01%)#1,590 |
| 73. | Sand Springs | 32 | 21,746(0.15%)#73 | 461,322(0.01%)#1,612 |
| 74. | Baytown | 31 | 21,746(0.14%)#74 | 461,322(0.01%)#1,616 |
| 75. | Temple | 31 | 21,746(0.14%)#75 | 461,322(0.01%)#1,617 |
| 76. | Deer Park | 31 | 21,746(0.14%)#76 | 461,322(0.01%)#1,619 |
| 77. | Colleyville | 30 | 21,746(0.14%)#77 | 461,322(0.01%)#1,655 |
| 78. | Kingsville | 30 | 21,746(0.14%)#78 | 461,322(0.01%)#1,657 |
| 79. | Fate | 30 | 21,746(0.14%)#79 | 461,322(0.01%)#1,663 |
| 80. | Wichita Falls | 29 | 21,746(0.13%)#80 | 461,322(0.01%)#1,677 |
| 81. | Haltom City | 29 | 21,746(0.13%)#81 | 461,322(0.01%)#1,681 |
| 82. | Leon Valley | 29 | 21,746(0.13%)#82 | 461,322(0.01%)#1,691 |
| 83. | Cedar Hill | 28 | 21,746(0.13%)#83 | 461,322(0.01%)#1,707 |
| 84. | Farmers Branch | 28 | 21,746(0.13%)#84 | 461,322(0.01%)#1,713 |
| 85. | Pasadena | 27 | 21,746(0.12%)#85 | 461,322(0.01%)#1,743 |
| 86. | La Porte | 27 | 21,746(0.12%)#86 | 461,322(0.01%)#1,748 |
| 87. | Corpus Christi | 26 | 21,746(0.12%)#87 | 461,322(0.01%)#1,773 |
| 88. | Tomball | 26 | 21,746(0.12%)#88 | 461,322(0.01%)#1,785 |
| 89. | Bunker Hill Village | 24 | 21,746(0.11%)#89 | 461,322(0.01%)#1,856 |
| 90. | Potosi | 22 | 21,746(0.10%)#90 | 461,322(0.00%)#1,921 |
| 91. | Double Oak | 22 | 21,746(0.10%)#91 | 461,322(0.00%)#1,925 |
| 92. | College Station | 21 | 21,746(0.10%)#92 | 461,322(0.00%)#1,929 |
| 93. | Keene | 19 | 21,746(0.09%)#93 | 461,322(0.00%)#2,025 |
| 94. | Bryan | 18 | 21,746(0.08%)#94 | 461,322(0.00%)#2,034 |
| 95. | Hutto | 18 | 21,746(0.08%)#95 | 461,322(0.00%)#2,045 |
| 96. | Clarksville | 18 | 21,746(0.08%)#96 | 461,322(0.00%)#2,078 |
| 97. | Sulphur Springs | 17 | 21,746(0.08%)#97 | 461,322(0.00%)#2,111 |
| 98. | Llano | 16 | 21,746(0.07%)#98 | 461,322(0.00%)#2,166 |
| 99. | Denton | 15 | 21,746(0.07%)#99 | 461,322(0.00%)#2,172 |
| 100. | Duncanville | 15 | 21,746(0.07%)#100 | 461,322(0.00%)#2,174 |
Common Questions
What are the Top 10 Cities with the Most Immigrants from Peru in Texas?
Top 10 Cities with the Most Immigrants from Peru in Texas are:
#1
2,064
#2
1,257
#3
1,163
#4
773
#5
604
#6
539
#7
441
#8
439
#9
408
#10
334
What city has the Most Immigrants from Peru in Texas?
Houston has the Most Immigrants from Peru in Texas with 2,064.
What is the Total Immigrants from Peru in the State of Texas?
Total Immigrants from Peru in Texas is 21,746.
What is the Total Immigrants from Peru in the United States?
Total Immigrants from Peru in the United States is 461,322.