Cities with the Highest Percentage of Population with a Degree in Visual and Performing Arts in Louisiana
RELATED REPORTS & OPTIONS
Visual and Performing Arts
Louisiana
Compare Cities
Map of Cities with the Highest Percentage of Population with a Degree in Visual and Performing Arts in Louisiana
0.0%
50.0%
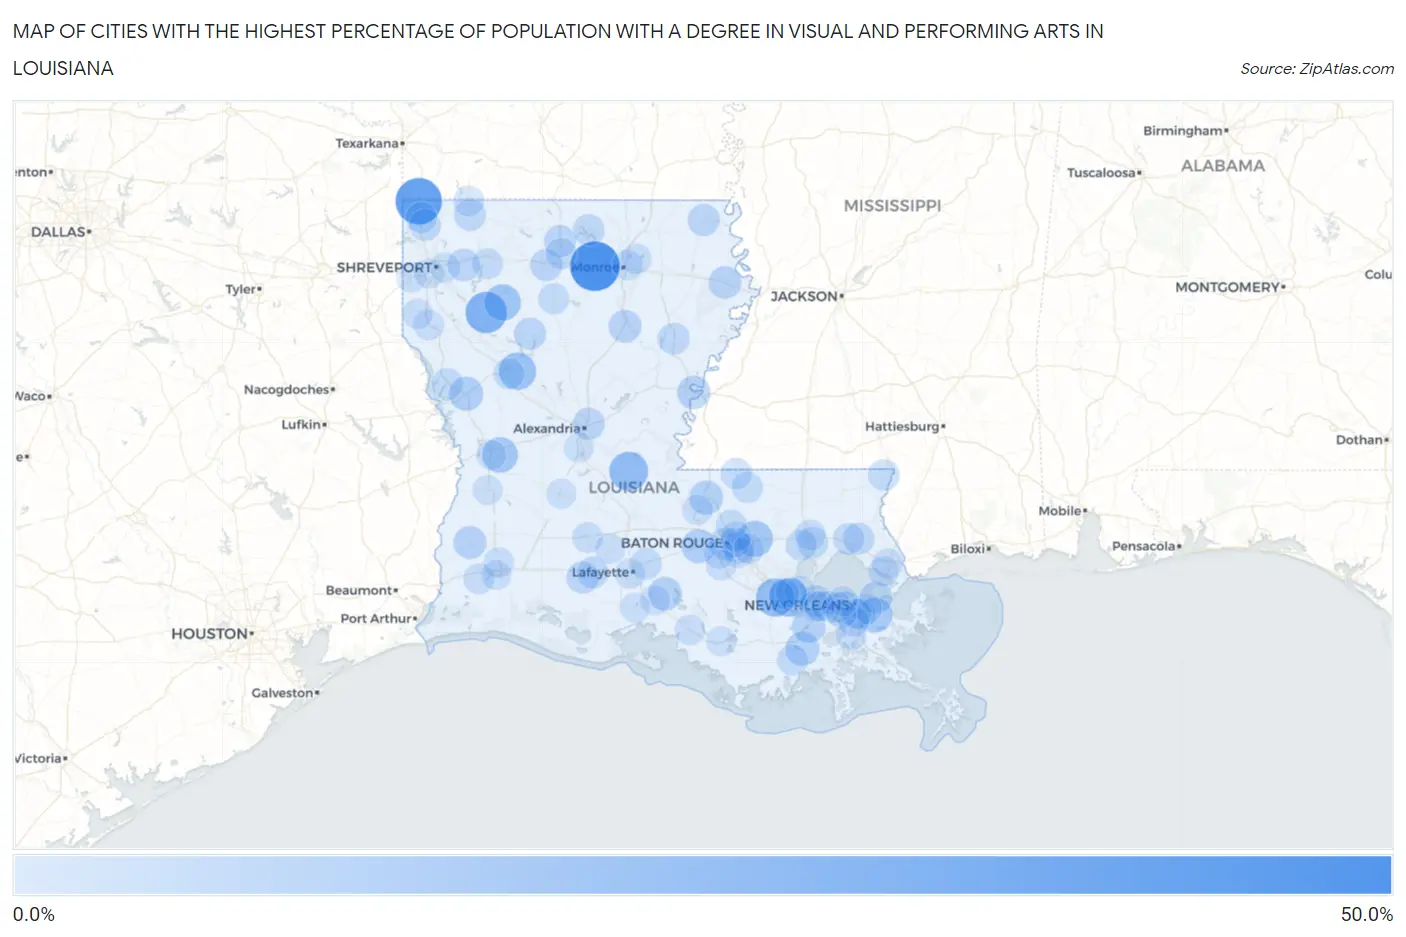
Cities with the Highest Percentage of Population with a Degree in Visual and Performing Arts in Louisiana
| City | % Graduates | vs State | vs National | |
| 1. | Calhoun | 50.0% | 3.3%(+46.7)#1 | 4.3%(+45.7)#115 |
| 2. | Ida | 42.1% | 3.3%(+38.8)#2 | 4.3%(+37.9)#164 |
| 3. | Hall Summit | 29.4% | 3.3%(+26.1)#3 | 4.3%(+25.2)#320 |
| 4. | Cottonport | 23.5% | 3.3%(+20.2)#4 | 4.3%(+19.2)#477 |
| 5. | Wallace | 22.5% | 3.3%(+19.3)#5 | 4.3%(+18.3)#499 |
| 6. | Hester | 22.1% | 3.3%(+18.8)#6 | 4.3%(+17.8)#525 |
| 7. | Vienna Bend | 20.0% | 3.3%(+16.7)#7 | 4.3%(+15.7)#620 |
| 8. | Castor | 17.9% | 3.3%(+14.6)#8 | 4.3%(+13.6)#793 |
| 9. | Denham Springs | 16.3% | 3.3%(+13.1)#9 | 4.3%(+12.1)#925 |
| 10. | Fort Polk North | 15.7% | 3.3%(+12.4)#10 | 4.3%(+11.4)#983 |
| 11. | Violet | 14.6% | 3.3%(+11.3)#11 | 4.3%(+10.4)#1,108 |
| 12. | Many | 12.2% | 3.3%(+8.89)#12 | 4.3%(+7.92)#1,489 |
| 13. | Grosse Tete | 12.1% | 3.3%(+8.84)#13 | 4.3%(+7.87)#1,504 |
| 14. | St Francisville | 11.7% | 3.3%(+8.37)#14 | 4.3%(+7.40)#1,595 |
| 15. | Lockport | 11.5% | 3.3%(+8.21)#15 | 4.3%(+7.24)#1,626 |
| 16. | Loreauville | 10.9% | 3.3%(+7.59)#16 | 4.3%(+6.62)#1,780 |
| 17. | Des Allemands | 10.7% | 3.3%(+7.41)#17 | 4.3%(+6.44)#1,839 |
| 18. | Minorca | 10.1% | 3.3%(+6.83)#18 | 4.3%(+5.86)#2,026 |
| 19. | Dequincy | 9.4% | 3.3%(+6.15)#19 | 4.3%(+5.18)#2,273 |
| 20. | Tallulah | 8.8% | 3.3%(+5.52)#20 | 4.3%(+4.55)#2,555 |
| 21. | Banks Springs | 8.8% | 3.3%(+5.49)#21 | 4.3%(+4.52)#2,565 |
| 22. | Jefferson | 8.2% | 3.3%(+4.88)#22 | 4.3%(+3.91)#2,889 |
| 23. | Haughton | 8.2% | 3.3%(+4.87)#23 | 4.3%(+3.90)#2,892 |
| 24. | New Orleans | 7.8% | 3.3%(+4.51)#24 | 4.3%(+3.53)#3,098 |
| 25. | Pineville | 7.6% | 3.3%(+4.30)#25 | 4.3%(+3.33)#3,245 |
| 26. | Oak Grove | 7.5% | 3.3%(+4.23)#26 | 4.3%(+3.26)#3,286 |
| 27. | Port Allen | 7.5% | 3.3%(+4.17)#27 | 4.3%(+3.20)#3,319 |
| 28. | Goldonna | 7.4% | 3.3%(+4.13)#28 | 4.3%(+3.16)#3,362 |
| 29. | Norco | 7.3% | 3.3%(+4.02)#29 | 4.3%(+3.05)#3,445 |
| 30. | Estherwood | 7.3% | 3.3%(+3.99)#30 | 4.3%(+3.02)#3,470 |
| 31. | Dubach | 7.2% | 3.3%(+3.95)#31 | 4.3%(+2.98)#3,506 |
| 32. | Simsboro | 7.1% | 3.3%(+3.86)#32 | 4.3%(+2.89)#3,570 |
| 33. | Wisner | 6.9% | 3.3%(+3.62)#33 | 4.3%(+2.64)#3,782 |
| 34. | Crowley | 6.7% | 3.3%(+3.38)#34 | 4.3%(+2.41)#4,065 |
| 35. | Westminster | 6.5% | 3.3%(+3.19)#35 | 4.3%(+2.22)#4,224 |
| 36. | Farmerville | 6.4% | 3.3%(+3.08)#36 | 4.3%(+2.11)#4,329 |
| 37. | Sarepta | 6.2% | 3.3%(+2.97)#37 | 4.3%(+2.00)#4,435 |
| 38. | Gilliam | 6.2% | 3.3%(+2.97)#38 | 4.3%(+2.00)#4,461 |
| 39. | Abita Springs | 6.2% | 3.3%(+2.92)#39 | 4.3%(+1.95)#4,504 |
| 40. | Angie | 5.9% | 3.3%(+2.60)#40 | 4.3%(+1.63)#4,854 |
| 41. | Zwolle | 5.8% | 3.3%(+2.55)#41 | 4.3%(+1.58)#4,905 |
| 42. | Terrytown | 5.8% | 3.3%(+2.49)#42 | 4.3%(+1.52)#4,970 |
| 43. | Breaux Bridge | 5.7% | 3.3%(+2.46)#43 | 4.3%(+1.49)#5,021 |
| 44. | Covington | 5.7% | 3.3%(+2.40)#44 | 4.3%(+1.43)#5,084 |
| 45. | Hosston | 5.6% | 3.3%(+2.27)#45 | 4.3%(+1.30)#5,249 |
| 46. | Ponchatoula | 5.4% | 3.3%(+2.16)#46 | 4.3%(+1.19)#5,387 |
| 47. | Vienna | 5.3% | 3.3%(+1.98)#47 | 4.3%(+1.01)#5,626 |
| 48. | Springfield | 5.2% | 3.3%(+1.91)#48 | 4.3%(+0.943)#5,713 |
| 49. | Clinton | 5.0% | 3.3%(+1.74)#49 | 4.3%(+0.765)#5,970 |
| 50. | Norwood | 5.0% | 3.3%(+1.72)#50 | 4.3%(+0.748)#6,007 |
| 51. | Baker | 4.9% | 3.3%(+1.66)#51 | 4.3%(+0.691)#6,092 |
| 52. | Reserve | 4.9% | 3.3%(+1.64)#52 | 4.3%(+0.668)#6,124 |
| 53. | Bourg | 4.9% | 3.3%(+1.62)#53 | 4.3%(+0.650)#6,163 |
| 54. | Hahnville | 4.8% | 3.3%(+1.55)#54 | 4.3%(+0.579)#6,296 |
| 55. | Chalmette | 4.8% | 3.3%(+1.53)#55 | 4.3%(+0.563)#6,330 |
| 56. | East Hodge | 4.8% | 3.3%(+1.48)#56 | 4.3%(+0.510)#6,424 |
| 57. | Natchitoches | 4.7% | 3.3%(+1.43)#57 | 4.3%(+0.455)#6,511 |
| 58. | Sibley | 4.7% | 3.3%(+1.41)#58 | 4.3%(+0.435)#6,555 |
| 59. | Garyville | 4.6% | 3.3%(+1.32)#59 | 4.3%(+0.353)#6,709 |
| 60. | St Rose | 4.5% | 3.3%(+1.22)#60 | 4.3%(+0.248)#6,905 |
| 61. | Hammond | 4.4% | 3.3%(+1.12)#61 | 4.3%(+0.153)#7,088 |
| 62. | Springhill | 4.3% | 3.3%(+1.05)#62 | 4.3%(+0.080)#7,235 |
| 63. | Woodmere | 4.2% | 3.3%(+0.961)#63 | 4.3%(-0.010)#7,421 |
| 64. | Gretna | 4.0% | 3.3%(+0.755)#64 | 4.3%(-0.215)#7,847 |
| 65. | Gramercy | 4.0% | 3.3%(+0.748)#65 | 4.3%(-0.223)#7,866 |
| 66. | Carlyss | 4.0% | 3.3%(+0.681)#66 | 4.3%(-0.290)#8,000 |
| 67. | Oak Hills Place | 4.0% | 3.3%(+0.673)#67 | 4.3%(-0.297)#8,021 |
| 68. | Swartz | 3.9% | 3.3%(+0.621)#68 | 4.3%(-0.350)#8,157 |
| 69. | Destrehan | 3.8% | 3.3%(+0.507)#69 | 4.3%(-0.464)#8,415 |
| 70. | Eunice | 3.8% | 3.3%(+0.504)#70 | 4.3%(-0.467)#8,422 |
| 71. | Jean Lafitte | 3.7% | 3.3%(+0.462)#71 | 4.3%(-0.509)#8,513 |
| 72. | Grand Cane | 3.7% | 3.3%(+0.422)#72 | 4.3%(-0.548)#8,596 |
| 73. | Baton Rouge | 3.7% | 3.3%(+0.419)#73 | 4.3%(-0.552)#8,601 |
| 74. | Merrydale | 3.7% | 3.3%(+0.378)#74 | 4.3%(-0.592)#8,682 |
| 75. | Plaquemine | 3.6% | 3.3%(+0.363)#75 | 4.3%(-0.608)#8,718 |
| 76. | Slidell | 3.6% | 3.3%(+0.334)#76 | 4.3%(-0.637)#8,794 |
| 77. | Monroe | 3.6% | 3.3%(+0.318)#77 | 4.3%(-0.652)#8,826 |
| 78. | Franklin | 3.6% | 3.3%(+0.316)#78 | 4.3%(-0.655)#8,831 |
| 79. | Keachi | 3.6% | 3.3%(+0.290)#79 | 4.3%(-0.681)#8,903 |
| 80. | New Roads | 3.5% | 3.3%(+0.260)#80 | 4.3%(-0.711)#8,995 |
| 81. | Moss Bluff | 3.5% | 3.3%(+0.188)#81 | 4.3%(-0.782)#9,146 |
| 82. | River Ridge | 3.4% | 3.3%(+0.130)#82 | 4.3%(-0.840)#9,290 |
| 83. | Eden Isle | 3.4% | 3.3%(+0.076)#83 | 4.3%(-0.894)#9,434 |
| 84. | Addis | 3.3% | 3.3%(+0.014)#84 | 4.3%(-0.956)#9,603 |
| 85. | Shenandoah | 3.2% | 3.3%(-0.078)#85 | 4.3%(-1.05)#9,829 |
| 86. | Lafayette | 3.2% | 3.3%(-0.085)#86 | 4.3%(-1.06)#9,846 |
| 87. | Church Point | 3.2% | 3.3%(-0.102)#87 | 4.3%(-1.07)#9,878 |
| 88. | Metairie | 3.1% | 3.3%(-0.159)#88 | 4.3%(-1.13)#10,035 |
| 89. | Greenwood | 2.9% | 3.3%(-0.370)#89 | 4.3%(-1.34)#10,585 |
| 90. | Lake Charles | 2.9% | 3.3%(-0.391)#90 | 4.3%(-1.36)#10,638 |
| 91. | Oakdale | 2.9% | 3.3%(-0.424)#91 | 4.3%(-1.39)#10,713 |
| 92. | Woodworth | 2.8% | 3.3%(-0.476)#92 | 4.3%(-1.45)#10,852 |
| 93. | New Iberia | 2.8% | 3.3%(-0.499)#93 | 4.3%(-1.47)#10,904 |
| 94. | Shreveport | 2.8% | 3.3%(-0.521)#94 | 4.3%(-1.49)#10,978 |
| 95. | Bossier City | 2.7% | 3.3%(-0.537)#95 | 4.3%(-1.51)#11,029 |
| 96. | Avondale | 2.7% | 3.3%(-0.601)#96 | 4.3%(-1.57)#11,178 |
| 97. | Berwick | 2.7% | 3.3%(-0.627)#97 | 4.3%(-1.60)#11,247 |
| 98. | Deridder | 2.6% | 3.3%(-0.642)#98 | 4.3%(-1.61)#11,286 |
| 99. | Leesville | 2.6% | 3.3%(-0.700)#99 | 4.3%(-1.67)#11,426 |
| 100. | Delcambre | 2.6% | 3.3%(-0.708)#100 | 4.3%(-1.68)#11,451 |
Common Questions
What are the Top 10 Cities with the Highest Percentage of Population with a Degree in Visual and Performing Arts in Louisiana?
Top 10 Cities with the Highest Percentage of Population with a Degree in Visual and Performing Arts in Louisiana are:
#1
50.0%
#2
42.1%
#3
29.4%
#4
23.5%
#5
22.5%
#6
22.1%
#7
20.0%
#8
17.9%
#9
16.3%
#10
15.7%
What city has the Highest Percentage of Population with a Degree in Visual and Performing Arts in Louisiana?
Calhoun has the Highest Percentage of Population with a Degree in Visual and Performing Arts in Louisiana with 50.0%.
What is the Percentage of Population with a Degree in Visual and Performing Arts in the State of Louisiana?
Percentage of Population with a Degree in Visual and Performing Arts in Louisiana is 3.3%.
What is the Percentage of Population with a Degree in Visual and Performing Arts in the United States?
Percentage of Population with a Degree in Visual and Performing Arts in the United States is 4.3%.