North Cleveland, TX
North Cleveland Map
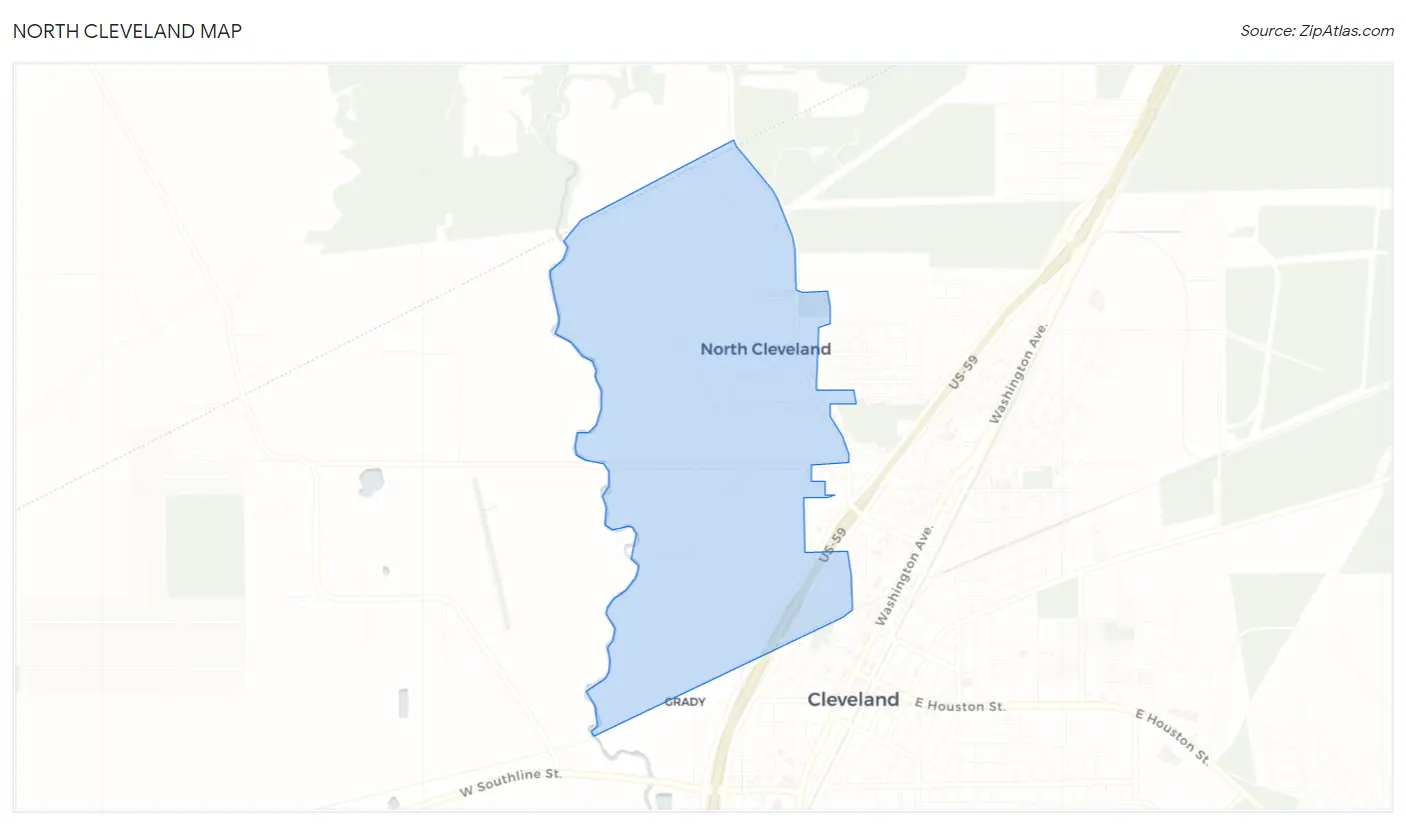
North Cleveland Overview
206
TOTAL POPULATION
104
MALE POPULATION
102
FEMALE POPULATION
101.96
MALES / 100 FEMALES
98.08
FEMALES / 100 MALES
42.6
MEDIAN AGE
2.4
AVG FAMILY SIZE
2.3
AVG HOUSEHOLD SIZE
$41,473
PER CAPITA INCOME
$126,250
AVG FAMILY INCOME
$94,167
AVG HOUSEHOLD INCOME
62.3%
WAGE / INCOME GAP [ % ]
37.7¢/ $1
WAGE / INCOME GAP [ $ ]
0.40
INEQUALITY / GINI INDEX
88
LABOR FORCE [ PEOPLE ]
49.7%
PERCENT IN LABOR FORCE
13.6%
UNEMPLOYMENT RATE
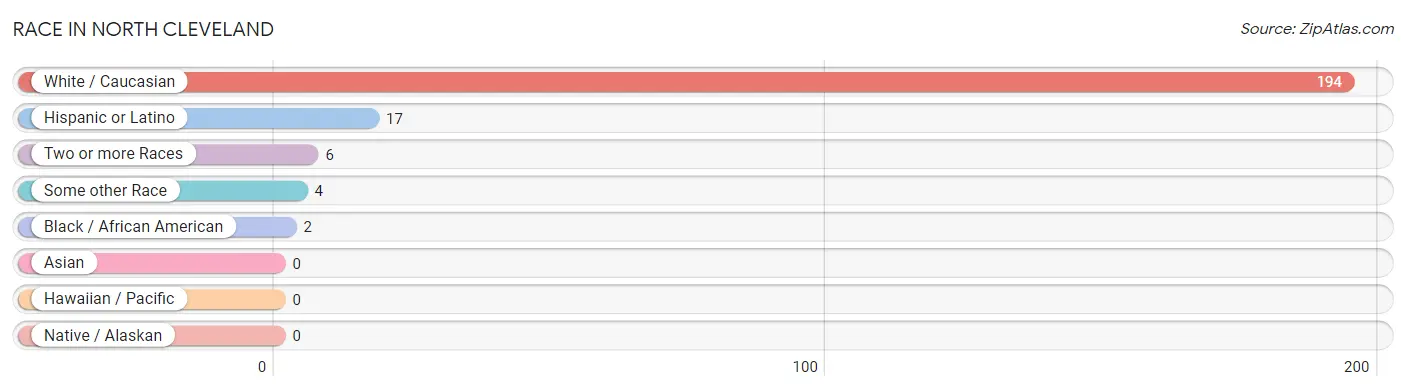
Race in North Cleveland
The most populous races in North Cleveland are White / Caucasian (194 | 94.2%), Hispanic or Latino (17 | 8.3%), and Two or more Races (6 | 2.9%).
| Race | # Population | % Population |
| Asian | 0 | 0.0% |
| Black / African American | 2 | 1.0% |
| Hawaiian / Pacific | 0 | 0.0% |
| Hispanic or Latino | 17 | 8.3% |
| Native / Alaskan | 0 | 0.0% |
| White / Caucasian | 194 | 94.2% |
| Two or more Races | 6 | 2.9% |
| Some other Race | 4 | 1.9% |
| Total | 206 | 100.0% |
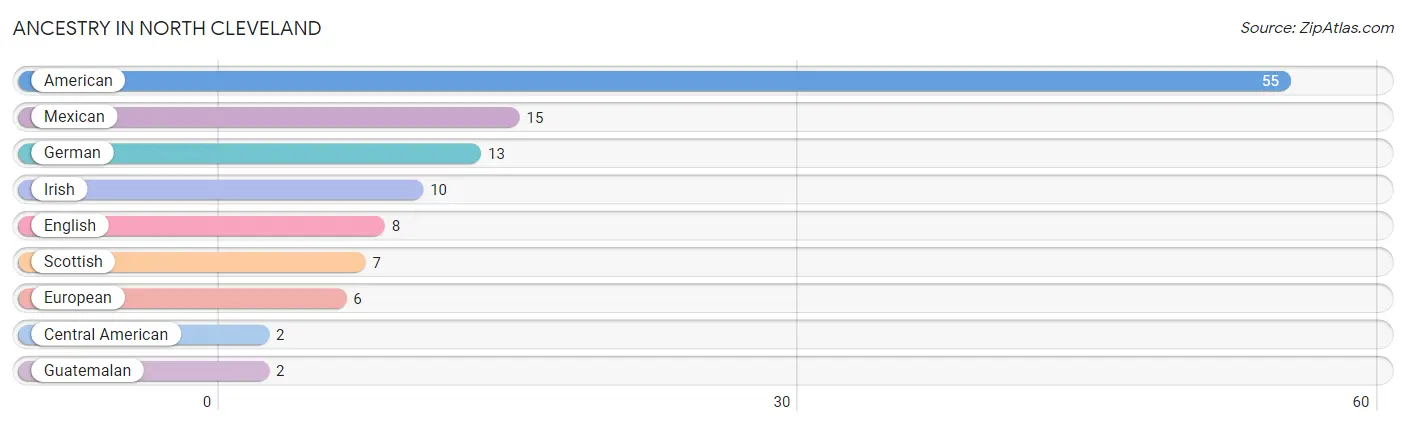
Ancestry in North Cleveland
The most populous ancestries reported in North Cleveland are American (55 | 26.7%), Mexican (15 | 7.3%), German (13 | 6.3%), Irish (10 | 4.9%), and English (8 | 3.9%), together accounting for 49.0% of all North Cleveland residents.
| Ancestry | # Population | % Population |
| American | 55 | 26.7% |
| Central American | 2 | 1.0% |
| English | 8 | 3.9% |
| European | 6 | 2.9% |
| German | 13 | 6.3% |
| Guatemalan | 2 | 1.0% |
| Irish | 10 | 4.9% |
| Mexican | 15 | 7.3% |
| Scottish | 7 | 3.4% | View All 9 Rows |
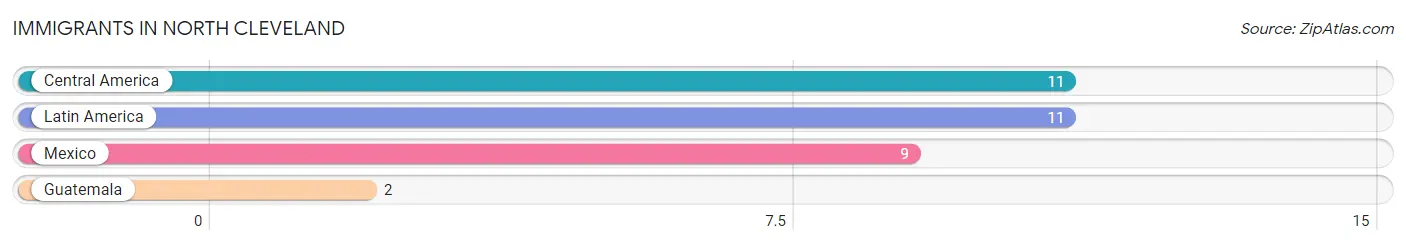
Immigrants in North Cleveland
The most numerous immigrant groups reported in North Cleveland came from Central America (11 | 5.3%), Latin America (11 | 5.3%), Mexico (9 | 4.4%), and Guatemala (2 | 1.0%), together accounting for 16.0% of all North Cleveland residents.
| Immigration Origin | # Population | % Population |
| Central America | 11 | 5.3% |
| Guatemala | 2 | 1.0% |
| Latin America | 11 | 5.3% |
| Mexico | 9 | 4.4% | View All 4 Rows |
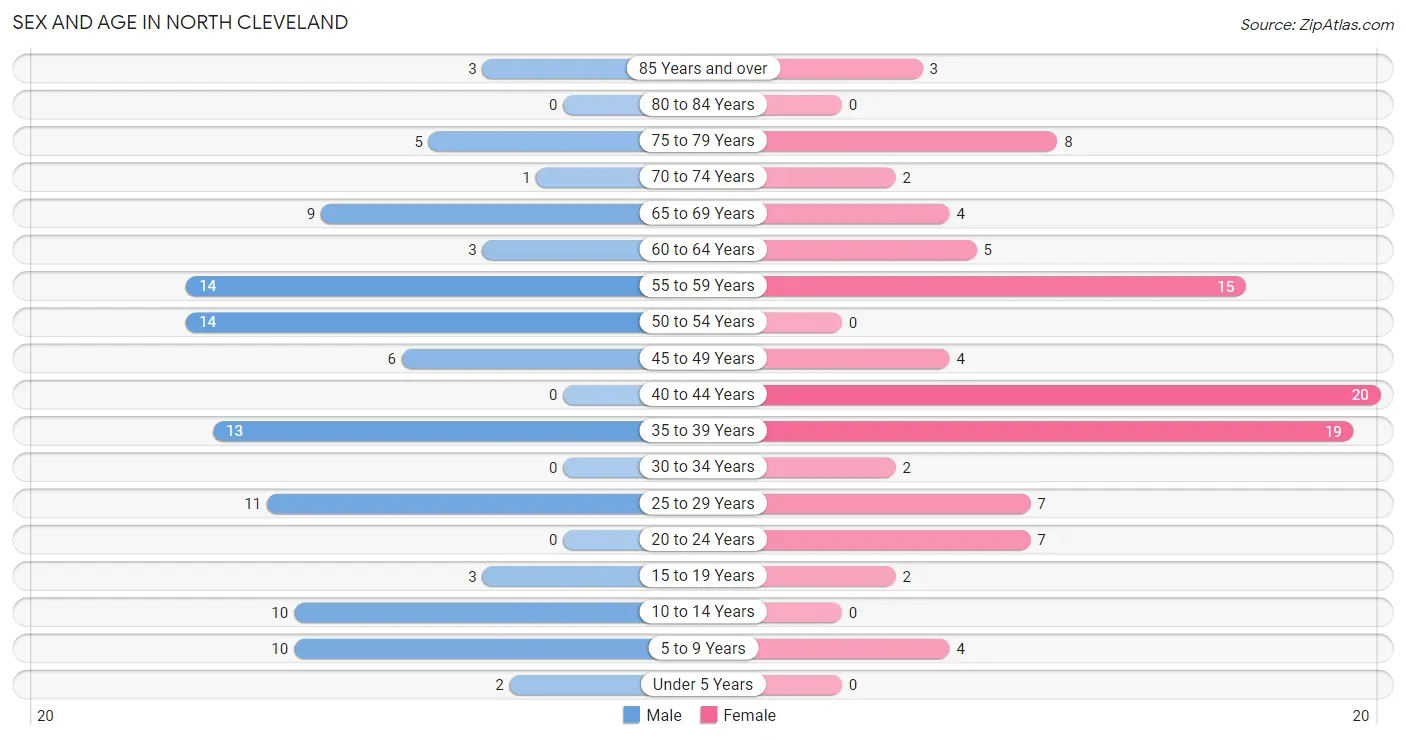
Sex and Age in North Cleveland
Sex and Age in North Cleveland
The most populous age groups in North Cleveland are 50 to 54 Years (14 | 13.5%) for men and 40 to 44 Years (20 | 19.6%) for women.
| Age Bracket | Male | Female |
| Under 5 Years | 2 (1.9%) | 0 (0.0%) |
| 5 to 9 Years | 10 (9.6%) | 4 (3.9%) |
| 10 to 14 Years | 10 (9.6%) | 0 (0.0%) |
| 15 to 19 Years | 3 (2.9%) | 2 (2.0%) |
| 20 to 24 Years | 0 (0.0%) | 7 (6.9%) |
| 25 to 29 Years | 11 (10.6%) | 7 (6.9%) |
| 30 to 34 Years | 0 (0.0%) | 2 (2.0%) |
| 35 to 39 Years | 13 (12.5%) | 19 (18.6%) |
| 40 to 44 Years | 0 (0.0%) | 20 (19.6%) |
| 45 to 49 Years | 6 (5.8%) | 4 (3.9%) |
| 50 to 54 Years | 14 (13.5%) | 0 (0.0%) |
| 55 to 59 Years | 14 (13.5%) | 15 (14.7%) |
| 60 to 64 Years | 3 (2.9%) | 5 (4.9%) |
| 65 to 69 Years | 9 (8.6%) | 4 (3.9%) |
| 70 to 74 Years | 1 (1.0%) | 2 (2.0%) |
| 75 to 79 Years | 5 (4.8%) | 8 (7.8%) |
| 80 to 84 Years | 0 (0.0%) | 0 (0.0%) |
| 85 Years and over | 3 (2.9%) | 3 (2.9%) |
| Total | 104 (100.0%) | 102 (100.0%) |
Families and Households in North Cleveland
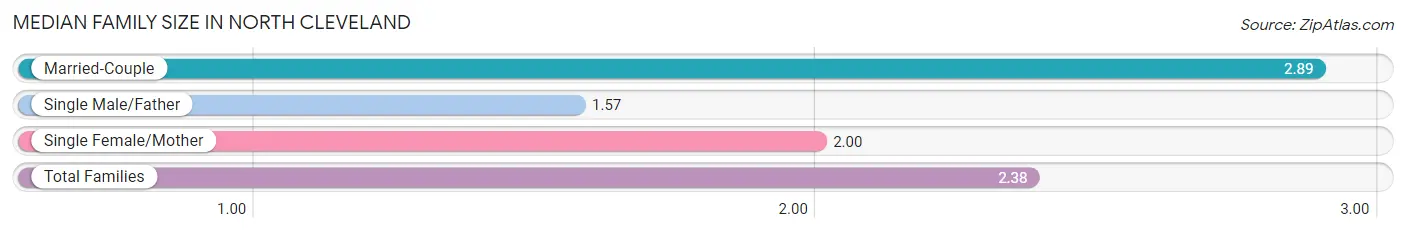
Median Family Size in North Cleveland
The median family size in North Cleveland is 2.38 persons per family, with married-couple families (36 | 60.0%) accounting for the largest median family size of 2.89 persons per family. On the other hand, single male/father families (21 | 35.0%) represent the smallest median family size with 1.57 persons per family.
| Family Type | # Families | Family Size |
| Married-Couple | 36 (60.0%) | 2.89 |
| Single Male/Father | 21 (35.0%) | 1.57 |
| Single Female/Mother | 3 (5.0%) | 2.00 |
| Total Families | 60 (100.0%) | 2.38 |
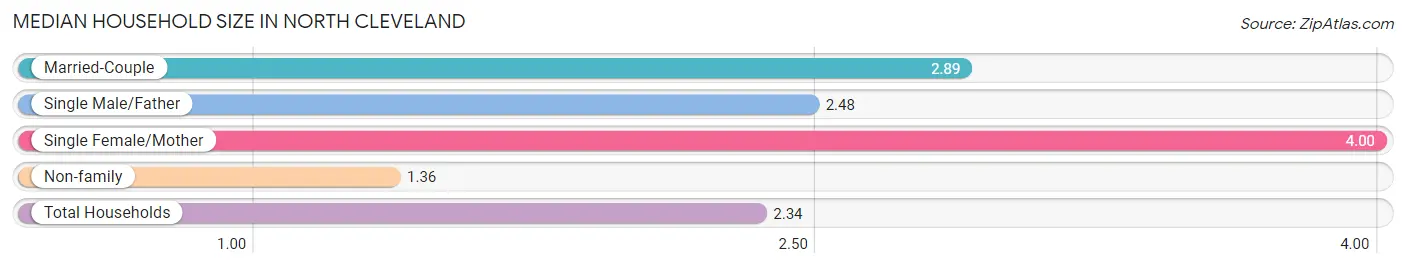
Median Household Size in North Cleveland
The median household size in North Cleveland is 2.34 persons per household, with single female/mother households (3 | 3.4%) accounting for the largest median household size of 4 persons per household. non-family households (28 | 31.8%) represent the smallest median household size with 1.36 persons per household.
| Household Type | # Households | Household Size |
| Married-Couple | 36 (40.9%) | 2.89 |
| Single Male/Father | 21 (23.9%) | 2.48 |
| Single Female/Mother | 3 (3.4%) | 4.00 |
| Non-family | 28 (31.8%) | 1.36 |
| Total Households | 88 (100.0%) | 2.34 |
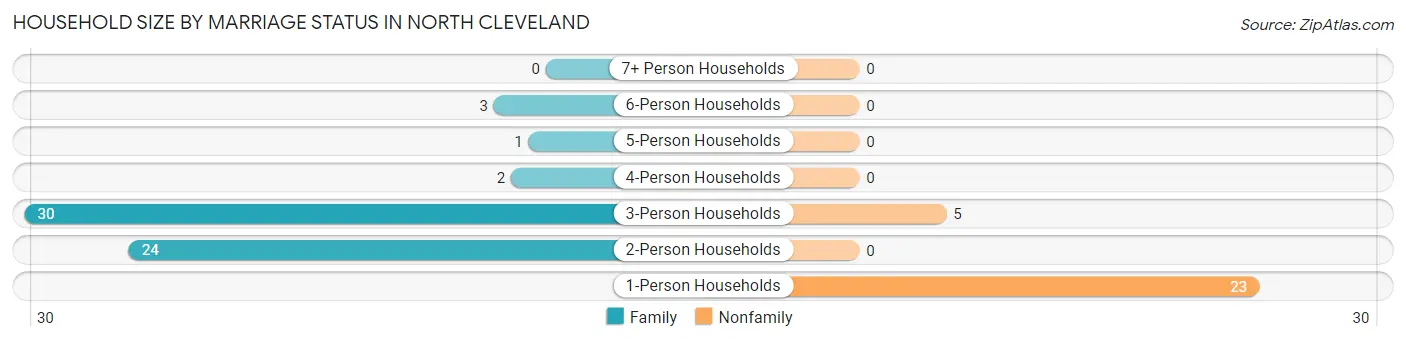
Household Size by Marriage Status in North Cleveland
Out of a total of 88 households in North Cleveland, 60 (68.2%) are family households, while 28 (31.8%) are nonfamily households. The most numerous type of family households are 3-person households, comprising 30, and the most common type of nonfamily households are 1-person households, comprising 23.
| Household Size | Family Households | Nonfamily Households |
| 1-Person Households | - | 23 (26.1%) |
| 2-Person Households | 24 (27.3%) | 0 (0.0%) |
| 3-Person Households | 30 (34.1%) | 5 (5.7%) |
| 4-Person Households | 2 (2.3%) | 0 (0.0%) |
| 5-Person Households | 1 (1.1%) | 0 (0.0%) |
| 6-Person Households | 3 (3.4%) | 0 (0.0%) |
| 7+ Person Households | 0 (0.0%) | 0 (0.0%) |
| Total | 60 (68.2%) | 28 (31.8%) |
Female Fertility in North Cleveland
Fertility by Age in North Cleveland
| Age Bracket | Women with Births | Births / 1,000 Women |
| 15 to 19 years | 0 (0.0%) | 0.0 |
| 20 to 34 years | 0 (0.0%) | 0.0 |
| 35 to 50 years | 0 (0.0%) | 0.0 |
| Total | 0 (0.0%) | 0.0 |
Fertility by Age by Marriage Status in North Cleveland
| Age Bracket | Married | Unmarried |
| 15 to 19 years | 0 (0.0%) | 0 (0.0%) |
| 20 to 34 years | 0 (0.0%) | 0 (0.0%) |
| 35 to 50 years | 0 (0.0%) | 0 (0.0%) |
| Total | 0 (0.0%) | 0 (0.0%) |
Fertility by Education in North Cleveland
| Educational Attainment | Women with Births | Births / 1,000 Women |
| Less than High School | 0 (0.0%) | 0.0 |
| High School Diploma | 0 (0.0%) | 0.0 |
| College or Associate's Degree | 0 (0.0%) | 0.0 |
| Bachelor's Degree | 0 (0.0%) | 0.0 |
| Graduate Degree | 0 (0.0%) | 0.0 |
| Total | 0 (0.0%) | 0.0 |
Fertility by Education by Marriage Status in North Cleveland
| Educational Attainment | Married | Unmarried |
| Less than High School | 0 (0.0%) | 0 (0.0%) |
| High School Diploma | 0 (0.0%) | 0 (0.0%) |
| College or Associate's Degree | 0 (0.0%) | 0 (0.0%) |
| Bachelor's Degree | 0 (0.0%) | 0 (0.0%) |
| Graduate Degree | 0 (0.0%) | 0 (0.0%) |
| Total | 0 (0.0%) | 0 (0.0%) |
Income in North Cleveland
Income Overview in North Cleveland
Per Capita Income in North Cleveland is $41,473, while median incomes of families and households are $126,250 and $94,167 respectively.
| Characteristic | Number | Measure |
| Per Capita Income | 206 | $41,473 |
| Median Family Income | 60 | $126,250 |
| Mean Family Income | 60 | $111,610 |
| Median Household Income | 88 | $94,167 |
| Mean Household Income | 88 | $101,869 |
| Income Deficit | 60 | $0 |
| Wage / Income Gap (%) | 206 | 62.26% |
| Wage / Income Gap ($) | 206 | 37.74¢ per $1 |
| Gini / Inequality Index | 206 | 0.40 |
Earnings by Sex in North Cleveland
Average Earnings in North Cleveland are $54,583, $66,250 for men and $25,000 for women, a difference of 62.3%.
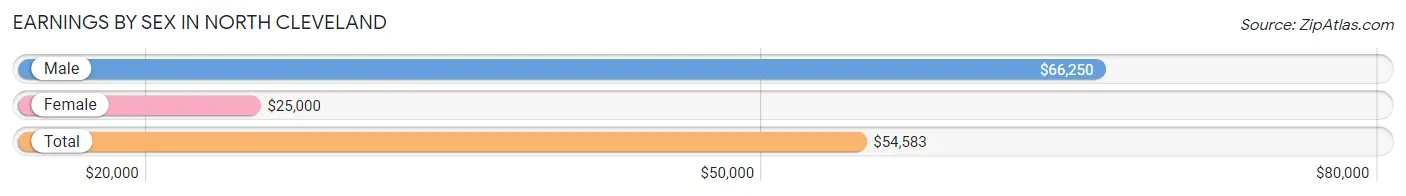
| Sex | Number | Average Earnings |
| Male | 73 (72.3%) | $66,250 |
| Female | 28 (27.7%) | $25,000 |
| Total | 101 (100.0%) | $54,583 |
Earnings by Sex by Income Bracket in North Cleveland
The most common earnings brackets in North Cleveland are $100,000+ for men (27 | 37.0%) and $22,500 to $24,999 for women (5 | 17.9%).
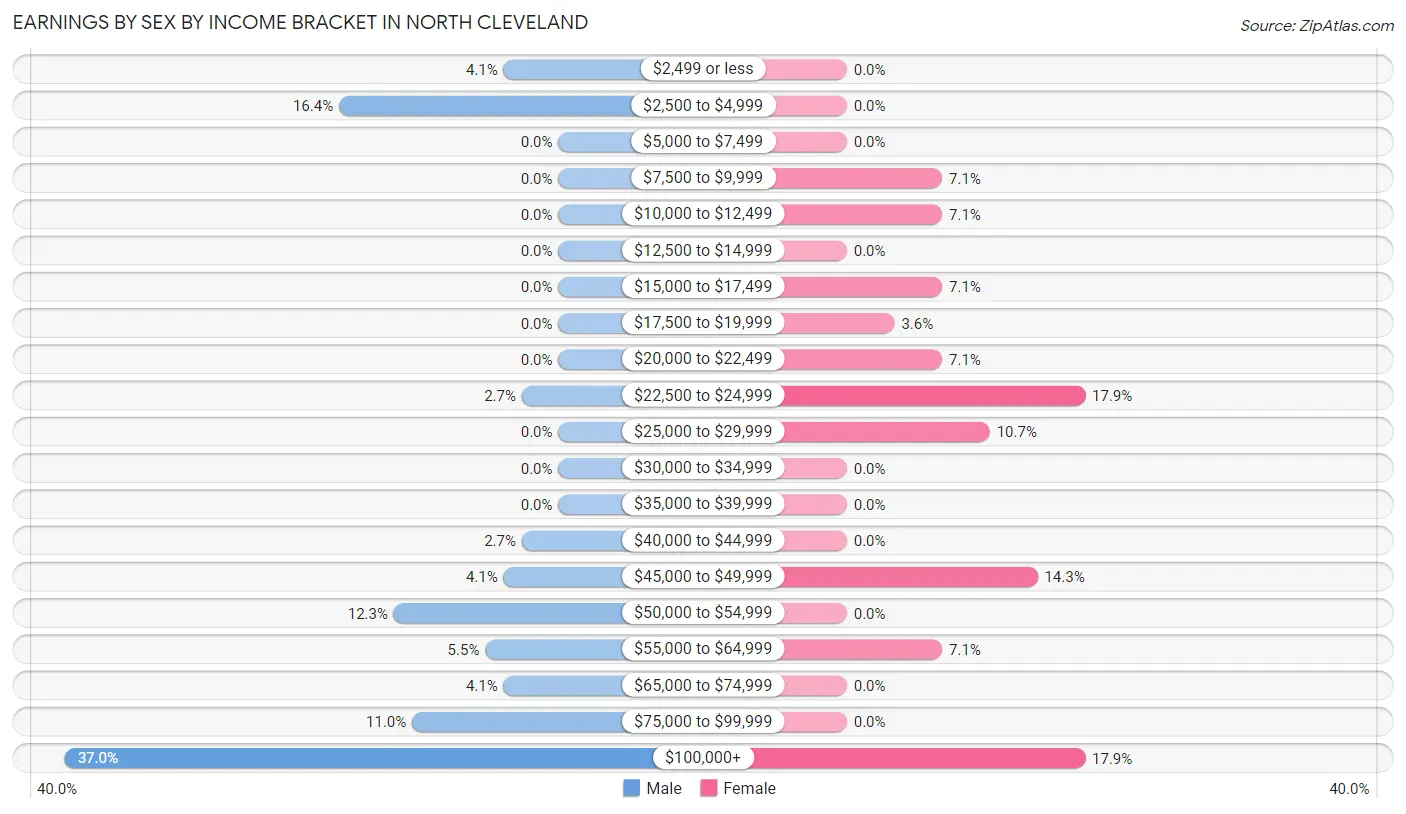
| Income | Male | Female |
| $2,499 or less | 3 (4.1%) | 0 (0.0%) |
| $2,500 to $4,999 | 12 (16.4%) | 0 (0.0%) |
| $5,000 to $7,499 | 0 (0.0%) | 0 (0.0%) |
| $7,500 to $9,999 | 0 (0.0%) | 2 (7.1%) |
| $10,000 to $12,499 | 0 (0.0%) | 2 (7.1%) |
| $12,500 to $14,999 | 0 (0.0%) | 0 (0.0%) |
| $15,000 to $17,499 | 0 (0.0%) | 2 (7.1%) |
| $17,500 to $19,999 | 0 (0.0%) | 1 (3.6%) |
| $20,000 to $22,499 | 0 (0.0%) | 2 (7.1%) |
| $22,500 to $24,999 | 2 (2.7%) | 5 (17.9%) |
| $25,000 to $29,999 | 0 (0.0%) | 3 (10.7%) |
| $30,000 to $34,999 | 0 (0.0%) | 0 (0.0%) |
| $35,000 to $39,999 | 0 (0.0%) | 0 (0.0%) |
| $40,000 to $44,999 | 2 (2.7%) | 0 (0.0%) |
| $45,000 to $49,999 | 3 (4.1%) | 4 (14.3%) |
| $50,000 to $54,999 | 9 (12.3%) | 0 (0.0%) |
| $55,000 to $64,999 | 4 (5.5%) | 2 (7.1%) |
| $65,000 to $74,999 | 3 (4.1%) | 0 (0.0%) |
| $75,000 to $99,999 | 8 (11.0%) | 0 (0.0%) |
| $100,000+ | 27 (37.0%) | 5 (17.9%) |
| Total | 73 (100.0%) | 28 (100.0%) |
Earnings by Sex by Educational Attainment in North Cleveland
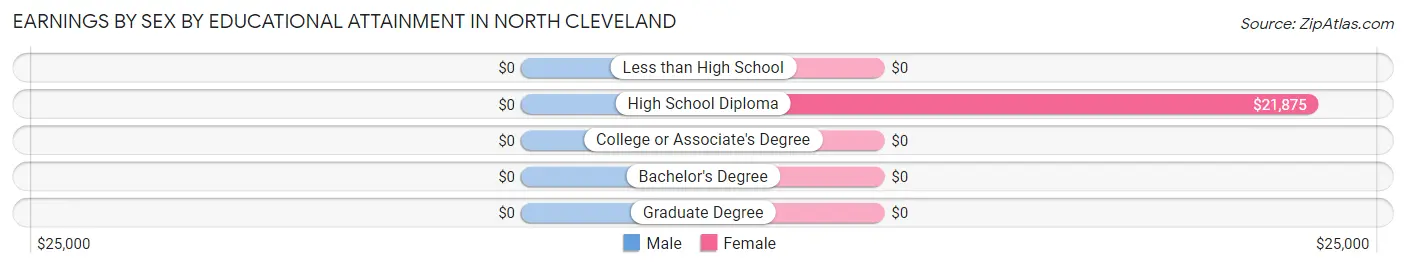
| Educational Attainment | Male Income | Female Income |
| Less than High School | - | - |
| High School Diploma | - | - |
| College or Associate's Degree | - | - |
| Bachelor's Degree | - | - |
| Graduate Degree | - | - |
| Total | $66,250 | $25,833 |
Family Income in North Cleveland
Family Income Brackets in North Cleveland
According to the North Cleveland family income data, there are 18 families falling into the $100,000 to $149,999 income range, which is the most common income bracket and makes up 30.0% of all families.
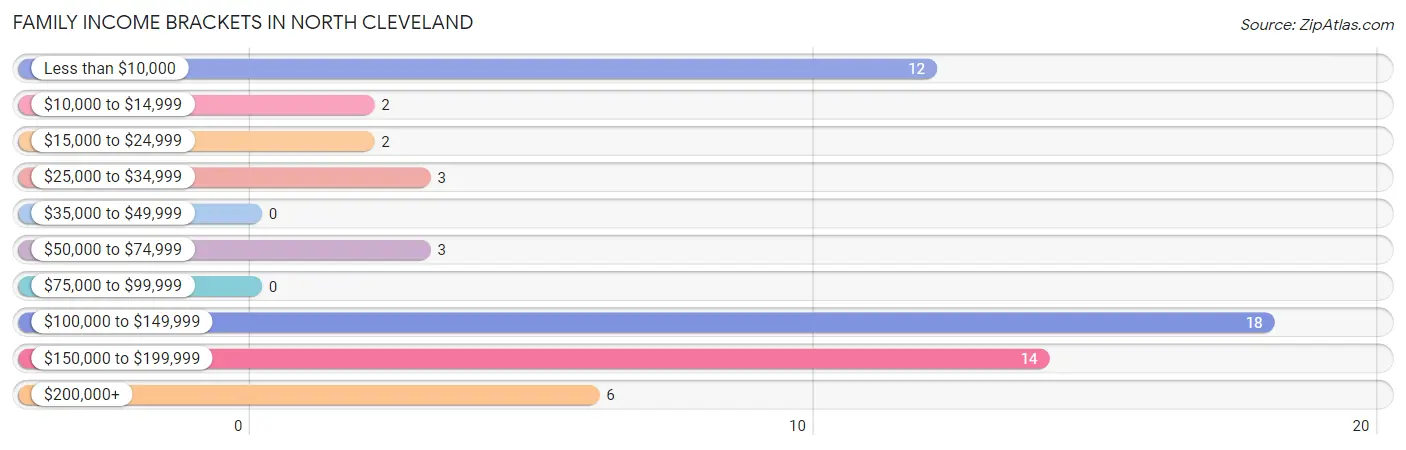
| Income Bracket | # Families | % Families |
| Less than $10,000 | 12 | 20.0% |
| $10,000 to $14,999 | 2 | 3.3% |
| $15,000 to $24,999 | 2 | 3.3% |
| $25,000 to $34,999 | 3 | 5.0% |
| $35,000 to $49,999 | 0 | 0.0% |
| $50,000 to $74,999 | 3 | 5.0% |
| $75,000 to $99,999 | 0 | 0.0% |
| $100,000 to $149,999 | 18 | 30.0% |
| $150,000 to $199,999 | 14 | 23.3% |
| $200,000+ | 6 | 10.0% |
Family Income by Famaliy Size in North Cleveland
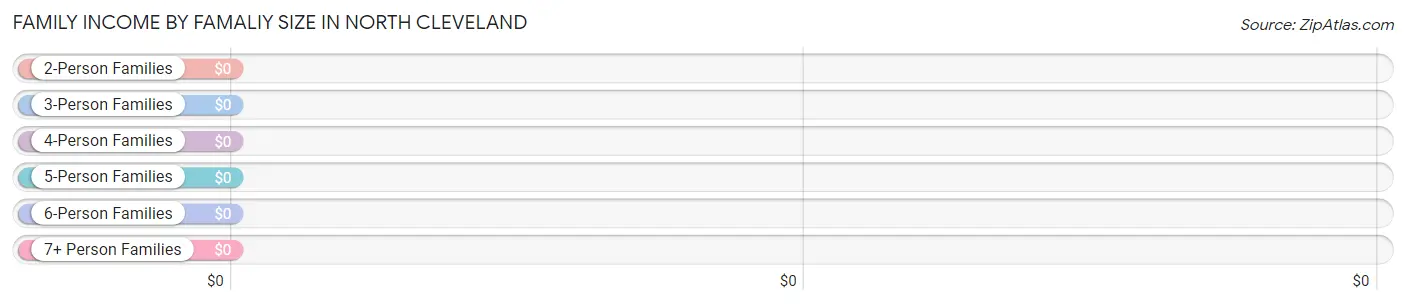
| Income Bracket | # Families | Median Income |
| 2-Person Families | 39 (65.0%) | $0 |
| 3-Person Families | 18 (30.0%) | $0 |
| 4-Person Families | 2 (3.3%) | $0 |
| 5-Person Families | 1 (1.7%) | $0 |
| 6-Person Families | 0 (0.0%) | $0 |
| 7+ Person Families | 0 (0.0%) | $0 |
| Total | 60 (100.0%) | $126,250 |
Family Income by Number of Earners in North Cleveland
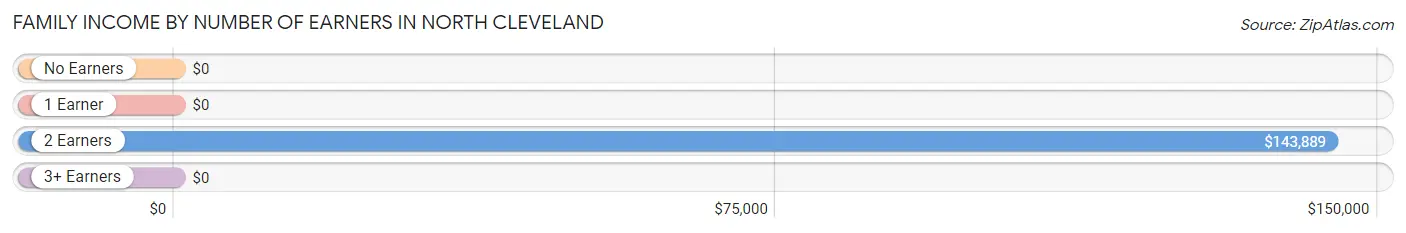
| Number of Earners | # Families | Median Income |
| No Earners | 4 (6.7%) | $0 |
| 1 Earner | 35 (58.3%) | $0 |
| 2 Earners | 18 (30.0%) | $143,889 |
| 3+ Earners | 3 (5.0%) | $0 |
| Total | 60 (100.0%) | $126,250 |
Household Income in North Cleveland
Household Income Brackets in North Cleveland
With 19 households falling in the category, the $150,000 to $199,999 income range is the most frequent in North Cleveland, accounting for 21.6% of all households. In contrast, only 2 households (2.3%) fall into the $10,000 to $14,999 income bracket, making it the least populous group.
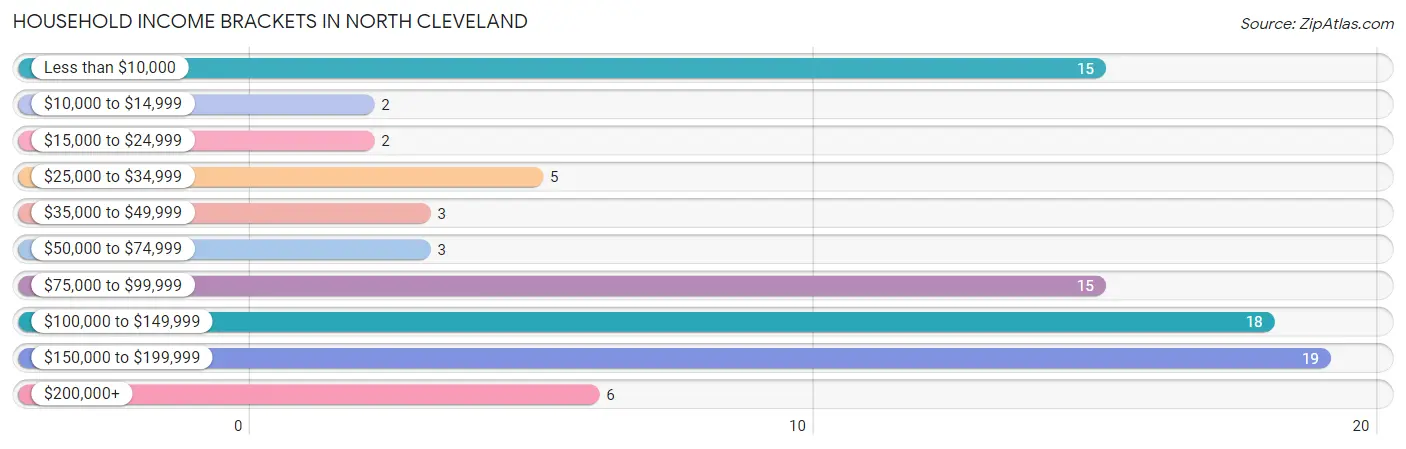
| Income Bracket | # Households | % Households |
| Less than $10,000 | 15 | 17.0% |
| $10,000 to $14,999 | 2 | 2.3% |
| $15,000 to $24,999 | 2 | 2.3% |
| $25,000 to $34,999 | 5 | 5.7% |
| $35,000 to $49,999 | 3 | 3.4% |
| $50,000 to $74,999 | 3 | 3.4% |
| $75,000 to $99,999 | 15 | 17.0% |
| $100,000 to $149,999 | 18 | 20.5% |
| $150,000 to $199,999 | 19 | 21.6% |
| $200,000+ | 6 | 6.8% |
Household Income by Householder Age in North Cleveland
The median household income in North Cleveland is $94,167, with the highest median household income of $192,885 found in the 25 to 44 years age bracket for the primary householder. A total of 22 households (25.0%) fall into this category.
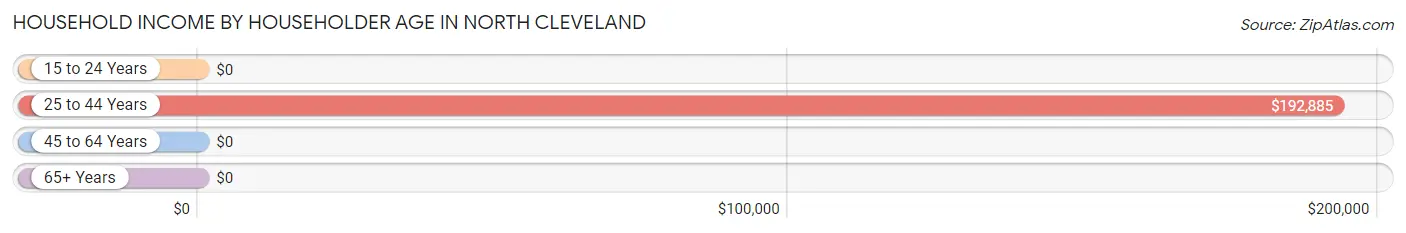
| Income Bracket | # Households | Median Income |
| 15 to 24 Years | 0 (0.0%) | $0 |
| 25 to 44 Years | 22 (25.0%) | $192,885 |
| 45 to 64 Years | 40 (45.5%) | $0 |
| 65+ Years | 26 (29.5%) | $0 |
| Total | 88 (100.0%) | $94,167 |
Poverty in North Cleveland
Income Below Poverty by Sex and Age in North Cleveland
With 22.3% poverty level for males and 25.7% for females among the residents of North Cleveland, 6 to 11 year old males and 35 to 44 year old females are the most vulnerable to poverty, with 9 males (100.0%) and 19 females (48.7%) in their respective age groups living below the poverty level.
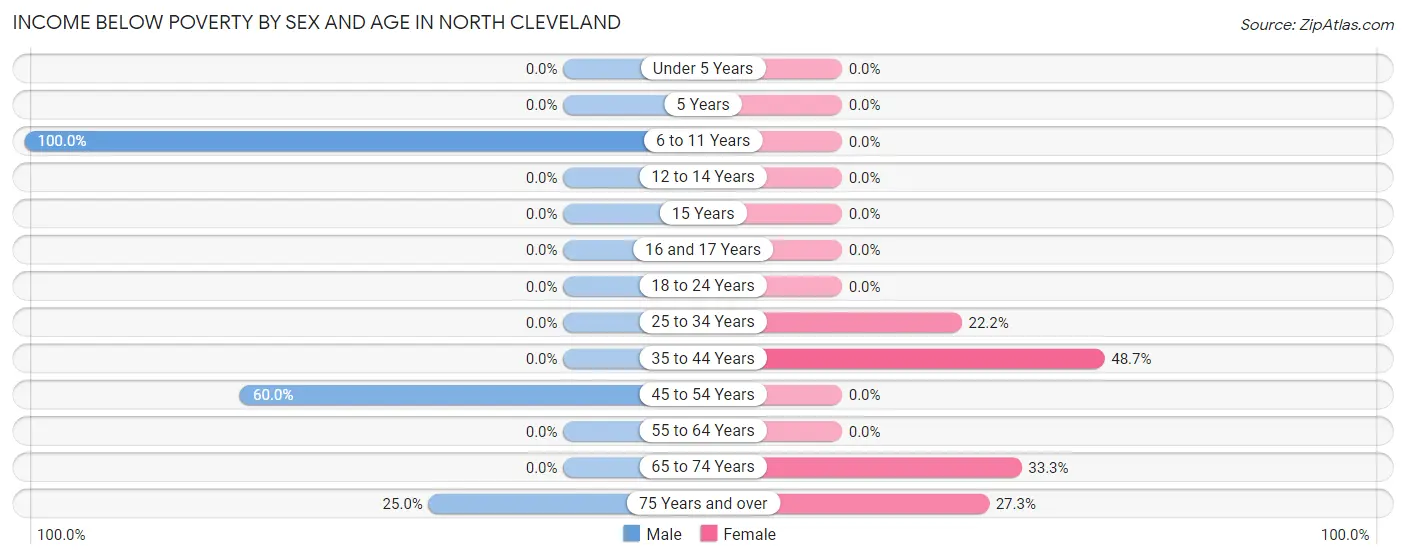
| Age Bracket | Male | Female |
| Under 5 Years | 0 (0.0%) | 0 (0.0%) |
| 5 Years | 0 (0.0%) | 0 (0.0%) |
| 6 to 11 Years | 9 (100.0%) | 0 (0.0%) |
| 12 to 14 Years | 0 (0.0%) | 0 (0.0%) |
| 15 Years | 0 (0.0%) | 0 (0.0%) |
| 16 and 17 Years | 0 (0.0%) | 0 (0.0%) |
| 18 to 24 Years | 0 (0.0%) | 0 (0.0%) |
| 25 to 34 Years | 0 (0.0%) | 2 (22.2%) |
| 35 to 44 Years | 0 (0.0%) | 19 (48.7%) |
| 45 to 54 Years | 12 (60.0%) | 0 (0.0%) |
| 55 to 64 Years | 0 (0.0%) | 0 (0.0%) |
| 65 to 74 Years | 0 (0.0%) | 2 (33.3%) |
| 75 Years and over | 2 (25.0%) | 3 (27.3%) |
| Total | 23 (22.3%) | 26 (25.7%) |
Income Above Poverty by Sex and Age in North Cleveland
According to the poverty statistics in North Cleveland, males aged under 5 years and females aged 6 to 11 years are the age groups that are most secure financially, with 100.0% of males and 100.0% of females in these age groups living above the poverty line.
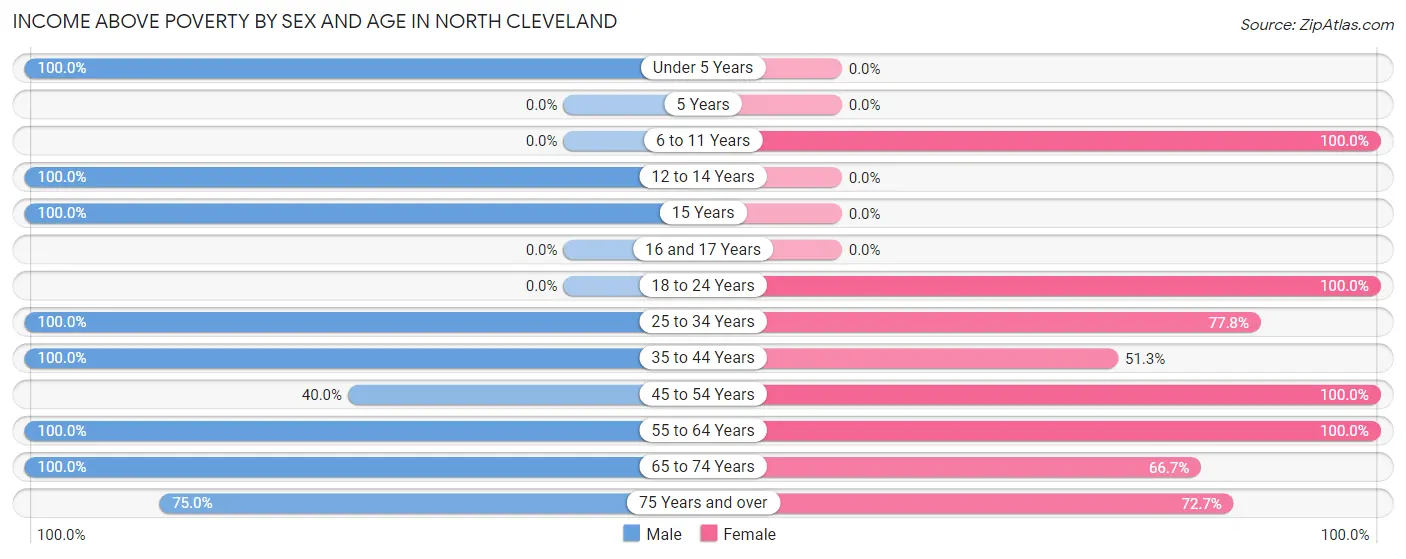
| Age Bracket | Male | Female |
| Under 5 Years | 2 (100.0%) | 0 (0.0%) |
| 5 Years | 0 (0.0%) | 0 (0.0%) |
| 6 to 11 Years | 0 (0.0%) | 3 (100.0%) |
| 12 to 14 Years | 10 (100.0%) | 0 (0.0%) |
| 15 Years | 3 (100.0%) | 0 (0.0%) |
| 16 and 17 Years | 0 (0.0%) | 0 (0.0%) |
| 18 to 24 Years | 0 (0.0%) | 9 (100.0%) |
| 25 to 34 Years | 11 (100.0%) | 7 (77.8%) |
| 35 to 44 Years | 13 (100.0%) | 20 (51.3%) |
| 45 to 54 Years | 8 (40.0%) | 4 (100.0%) |
| 55 to 64 Years | 17 (100.0%) | 20 (100.0%) |
| 65 to 74 Years | 10 (100.0%) | 4 (66.7%) |
| 75 Years and over | 6 (75.0%) | 8 (72.7%) |
| Total | 80 (77.7%) | 75 (74.3%) |
Income Below Poverty Among Married-Couple Families in North Cleveland
The poverty statistics for married-couple families in North Cleveland show that 5.6% or 2 of the total 36 families live below the poverty line. Families with no children have the highest poverty rate of 10.0%, comprising of 2 families. On the other hand, families with 1 or 2 children have the lowest poverty rate of 0.0%, which includes 0 families.
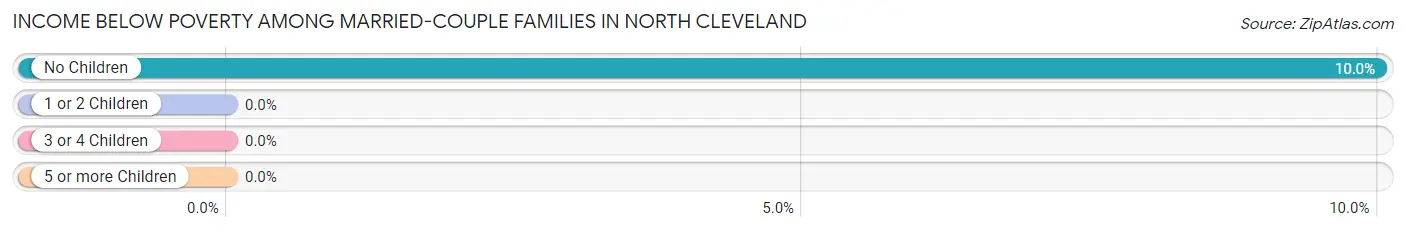
| Children | Above Poverty | Below Poverty |
| No Children | 18 (90.0%) | 2 (10.0%) |
| 1 or 2 Children | 16 (100.0%) | 0 (0.0%) |
| 3 or 4 Children | 0 (0.0%) | 0 (0.0%) |
| 5 or more Children | 0 (0.0%) | 0 (0.0%) |
| Total | 34 (94.4%) | 2 (5.6%) |
Income Below Poverty Among Single-Parent Households in North Cleveland
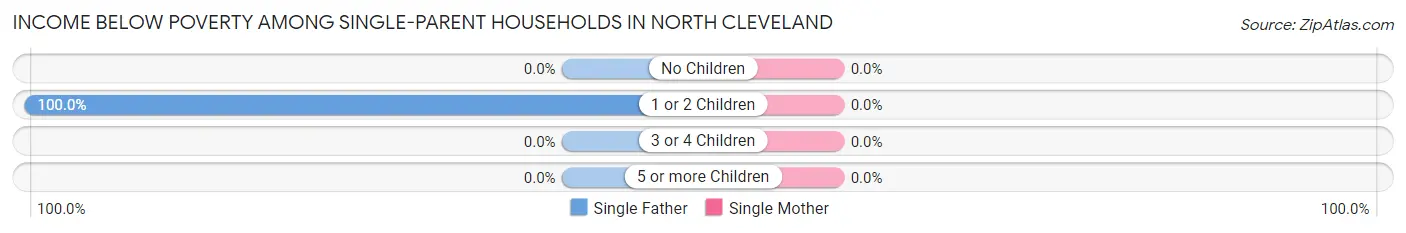
| Children | Single Father | Single Mother |
| No Children | 0 (0.0%) | 0 (0.0%) |
| 1 or 2 Children | 12 (100.0%) | 0 (0.0%) |
| 3 or 4 Children | 0 (0.0%) | 0 (0.0%) |
| 5 or more Children | 0 (0.0%) | 0 (0.0%) |
| Total | 12 (57.1%) | 0 (0.0%) |
Income Below Poverty Among Married-Couple vs Single-Parent Households in North Cleveland
The poverty data for North Cleveland shows that 2 of the married-couple family households (5.6%) and 12 of the single-parent households (50.0%) are living below the poverty level. Within the married-couple family households, those with no children have the highest poverty rate, with 2 households (10.0%) falling below the poverty line. Among the single-parent households, those with 1 or 2 children have the highest poverty rate, with 12 household (80.0%) living below poverty.
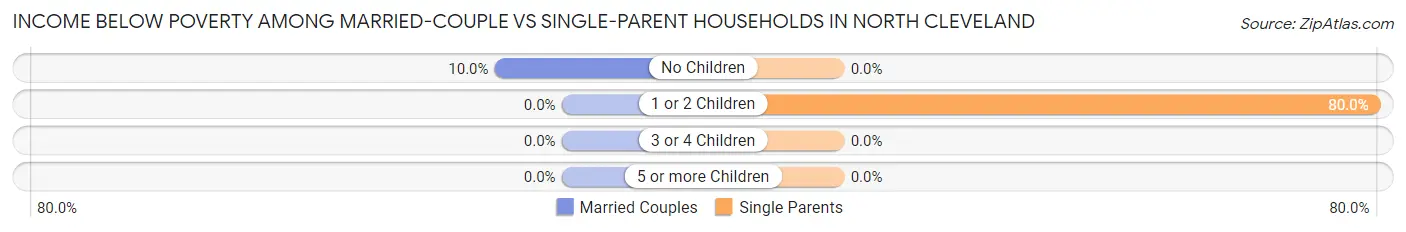
| Children | Married-Couple Families | Single-Parent Households |
| No Children | 2 (10.0%) | 0 (0.0%) |
| 1 or 2 Children | 0 (0.0%) | 12 (80.0%) |
| 3 or 4 Children | 0 (0.0%) | 0 (0.0%) |
| 5 or more Children | 0 (0.0%) | 0 (0.0%) |
| Total | 2 (5.6%) | 12 (50.0%) |
Employment Characteristics in North Cleveland
Employment by Class of Employer in North Cleveland
Among the 76 employed individuals in North Cleveland, private company employees (67 | 88.2%), self-employed (not incorporated) (6 | 7.9%), and local government employees (2 | 2.6%) make up the most common classes of employment.
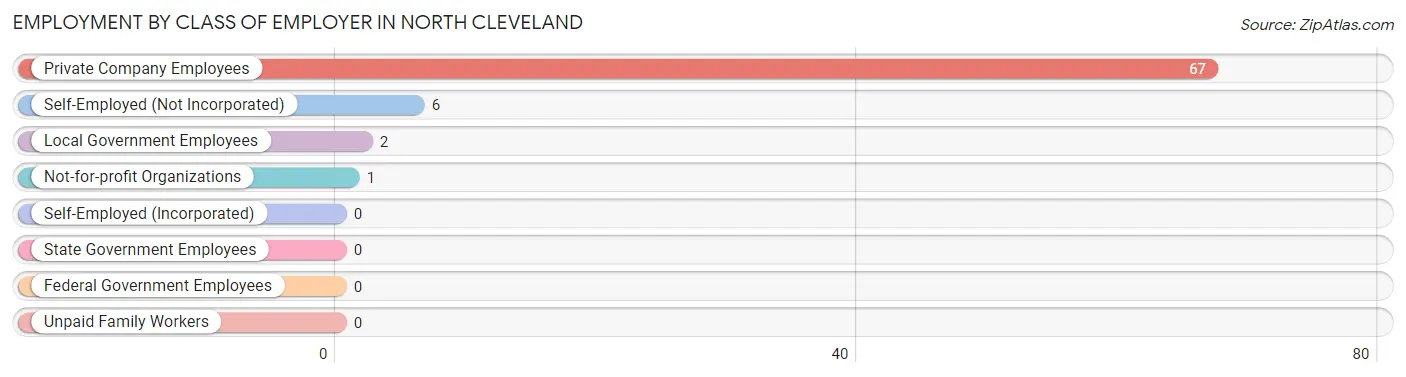
| Employer Class | # Employees | % Employees |
| Private Company Employees | 67 | 88.2% |
| Self-Employed (Incorporated) | 0 | 0.0% |
| Self-Employed (Not Incorporated) | 6 | 7.9% |
| Not-for-profit Organizations | 1 | 1.3% |
| Local Government Employees | 2 | 2.6% |
| State Government Employees | 0 | 0.0% |
| Federal Government Employees | 0 | 0.0% |
| Unpaid Family Workers | 0 | 0.0% |
| Total | 76 | 100.0% |
Employment Status by Age in North Cleveland
According to the labor force statistics for North Cleveland, out of the total population over 16 years of age (177), 49.7% or 88 individuals are in the labor force, with 13.6% or 12 of them unemployed. The age group with the highest labor force participation rate is 16 to 19 years, with 100.0% or 2 individuals in the labor force. Within the labor force, the 45 to 54 years age range has the highest percentage of unemployed individuals, with 50.0% or 12 of them being unemployed.
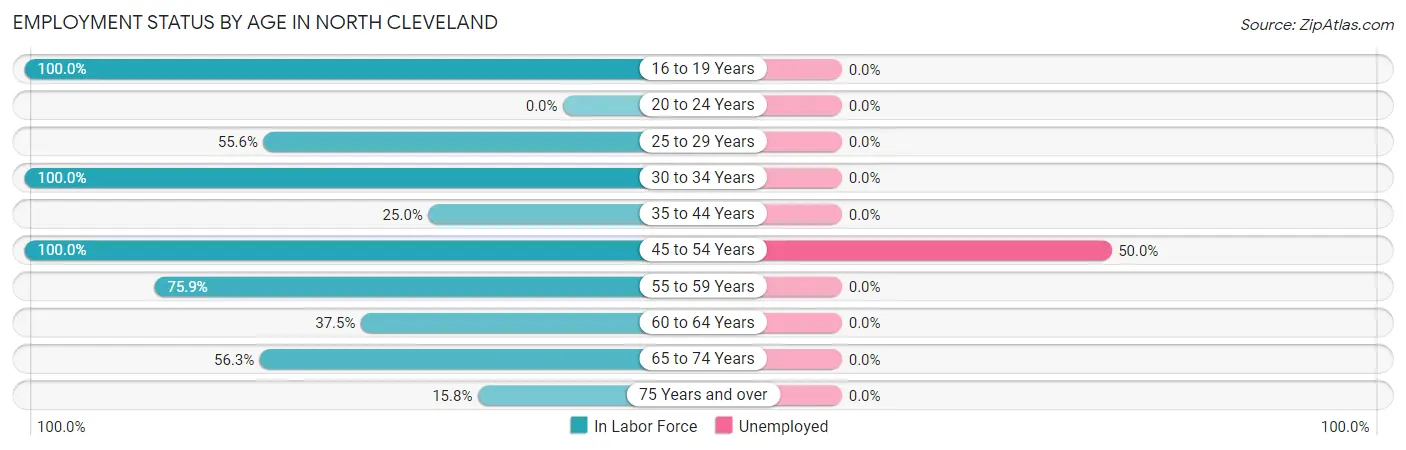
| Age Bracket | In Labor Force | Unemployed |
| 16 to 19 Years | 2 (100.0%) | 0 (0.0%) |
| 20 to 24 Years | 0 (0.0%) | 0 (0.0%) |
| 25 to 29 Years | 10 (55.6%) | 0 (0.0%) |
| 30 to 34 Years | 2 (100.0%) | 0 (0.0%) |
| 35 to 44 Years | 13 (25.0%) | 0 (0.0%) |
| 45 to 54 Years | 24 (100.0%) | 12 (50.0%) |
| 55 to 59 Years | 22 (75.9%) | 0 (0.0%) |
| 60 to 64 Years | 3 (37.5%) | 0 (0.0%) |
| 65 to 74 Years | 9 (56.3%) | 0 (0.0%) |
| 75 Years and over | 3 (15.8%) | 0 (0.0%) |
| Total | 88 (49.7%) | 12 (13.6%) |
Employment Status by Educational Attainment in North Cleveland
According to labor force statistics for North Cleveland, 55.6% of individuals (74) out of the total population between 25 and 64 years of age (133) are in the labor force, with 16.2% or 12 of them being unemployed. The group with the highest labor force participation rate are those with the educational attainment of college / associate degree, with 100.0% or 22 individuals in the labor force. Within the labor force, individuals with high school diploma education have the highest percentage of unemployment, with 44.4% or 12 of them being unemployed.
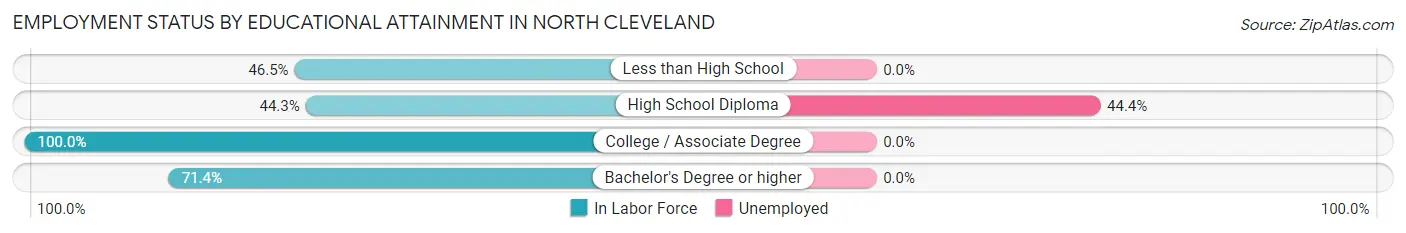
| Educational Attainment | In Labor Force | Unemployed |
| Less than High School | 20 (46.5%) | 0 (0.0%) |
| High School Diploma | 27 (44.3%) | 27 (44.4%) |
| College / Associate Degree | 22 (100.0%) | 0 (0.0%) |
| Bachelor's Degree or higher | 5 (71.4%) | 0 (0.0%) |
| Total | 74 (55.6%) | 22 (16.2%) |
Employment Occupations by Sex in North Cleveland
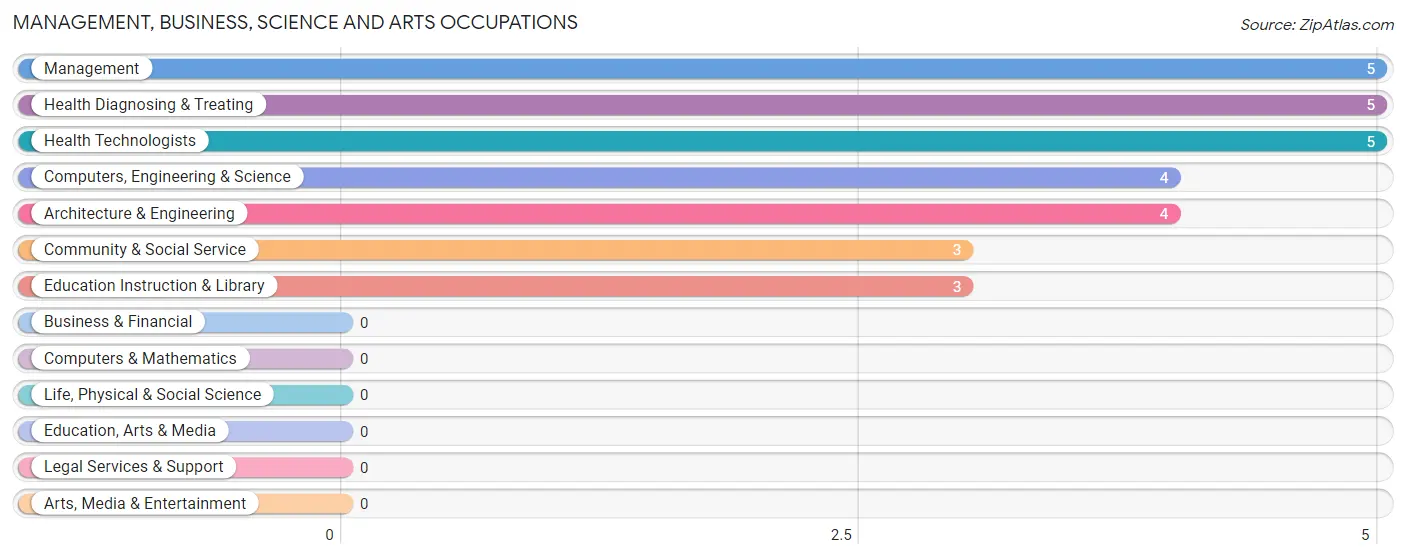
Management, Business, Science and Arts Occupations
The most common Management, Business, Science and Arts occupations in North Cleveland are Management (5 | 6.6%), Health Diagnosing & Treating (5 | 6.6%), Health Technologists (5 | 6.6%), Computers, Engineering & Science (4 | 5.3%), and Architecture & Engineering (4 | 5.3%).
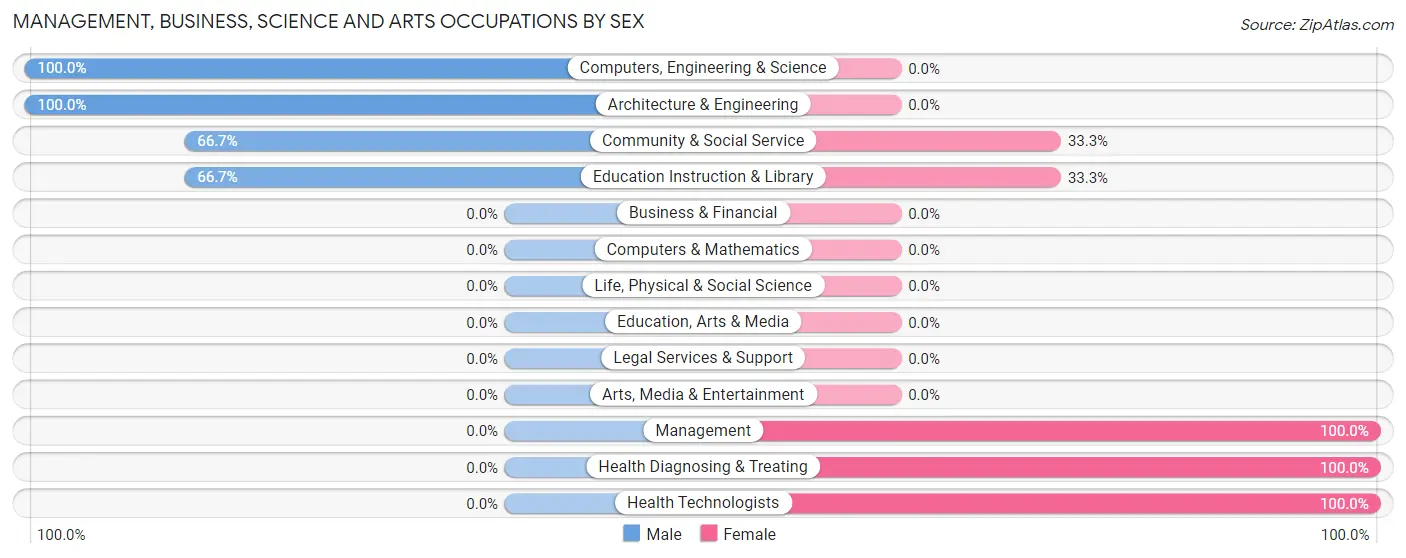
Management, Business, Science and Arts Occupations by Sex
Within the Management, Business, Science and Arts occupations in North Cleveland, the most male-oriented occupations are Computers, Engineering & Science (100.0%), Architecture & Engineering (100.0%), and Community & Social Service (66.7%), while the most female-oriented occupations are Management (100.0%), Health Diagnosing & Treating (100.0%), and Health Technologists (100.0%).
| Occupation | Male | Female |
| Management | 0 (0.0%) | 5 (100.0%) |
| Business & Financial | 0 (0.0%) | 0 (0.0%) |
| Computers, Engineering & Science | 4 (100.0%) | 0 (0.0%) |
| Computers & Mathematics | 0 (0.0%) | 0 (0.0%) |
| Architecture & Engineering | 4 (100.0%) | 0 (0.0%) |
| Life, Physical & Social Science | 0 (0.0%) | 0 (0.0%) |
| Community & Social Service | 2 (66.7%) | 1 (33.3%) |
| Education, Arts & Media | 0 (0.0%) | 0 (0.0%) |
| Legal Services & Support | 0 (0.0%) | 0 (0.0%) |
| Education Instruction & Library | 2 (66.7%) | 1 (33.3%) |
| Arts, Media & Entertainment | 0 (0.0%) | 0 (0.0%) |
| Health Diagnosing & Treating | 0 (0.0%) | 5 (100.0%) |
| Health Technologists | 0 (0.0%) | 5 (100.0%) |
| Total (Category) | 6 (35.3%) | 11 (64.7%) |
| Total (Overall) | 55 (72.4%) | 21 (27.6%) |
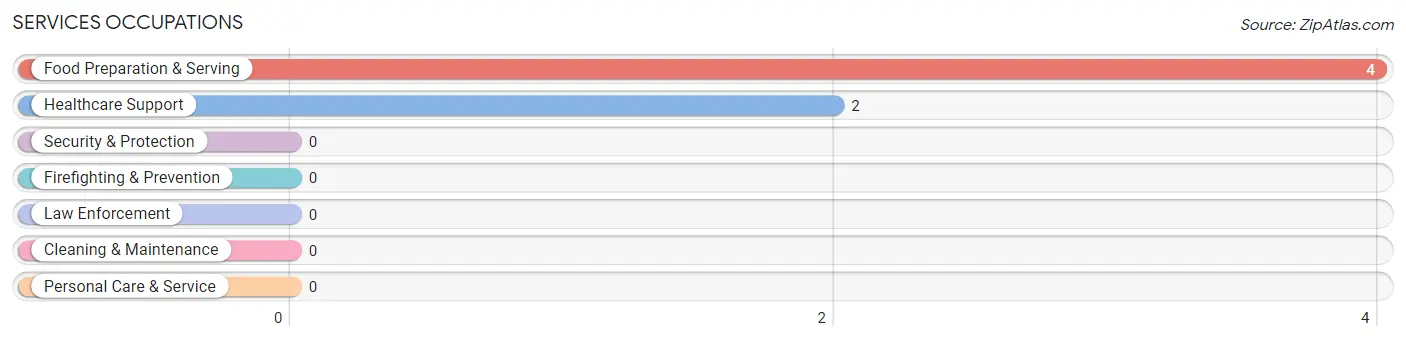
Services Occupations
The most common Services occupations in North Cleveland are Food Preparation & Serving (4 | 5.3%), and Healthcare Support (2 | 2.6%).
Services Occupations by Sex
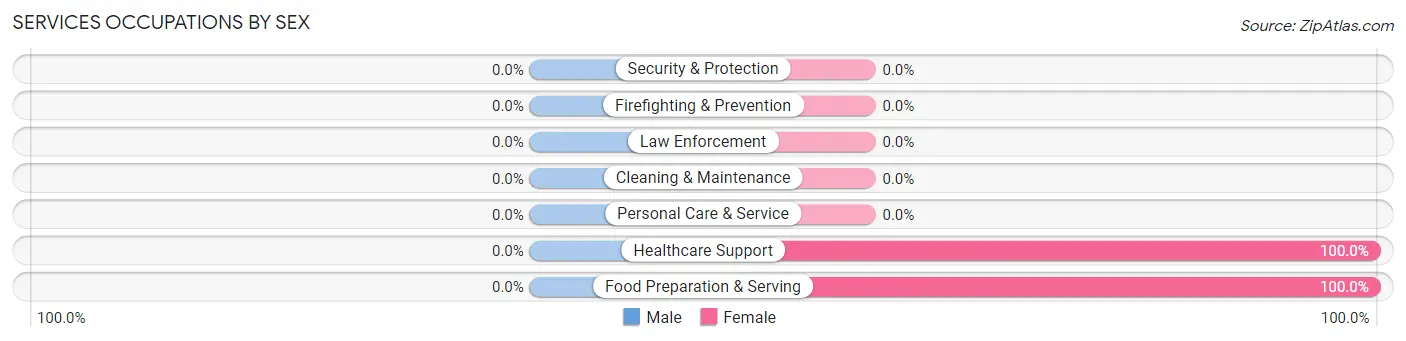
| Occupation | Male | Female |
| Healthcare Support | 0 (0.0%) | 2 (100.0%) |
| Security & Protection | 0 (0.0%) | 0 (0.0%) |
| Firefighting & Prevention | 0 (0.0%) | 0 (0.0%) |
| Law Enforcement | 0 (0.0%) | 0 (0.0%) |
| Food Preparation & Serving | 0 (0.0%) | 4 (100.0%) |
| Cleaning & Maintenance | 0 (0.0%) | 0 (0.0%) |
| Personal Care & Service | 0 (0.0%) | 0 (0.0%) |
| Total (Category) | 0 (0.0%) | 6 (100.0%) |
| Total (Overall) | 55 (72.4%) | 21 (27.6%) |
Sales and Office Occupations
Sales and Office Occupations by Sex
| Occupation | Male | Female |
| Sales & Related | 0 (0.0%) | 0 (0.0%) |
| Office & Administration | 0 (0.0%) | 0 (0.0%) |
| Total (Category) | 0 (0.0%) | 0 (0.0%) |
| Total (Overall) | 55 (72.4%) | 21 (27.6%) |
Natural Resources, Construction and Maintenance Occupations
The most common Natural Resources, Construction and Maintenance occupations in North Cleveland are Construction & Extraction (12 | 15.8%), and Installation, Maintenance & Repair (3 | 4.0%).
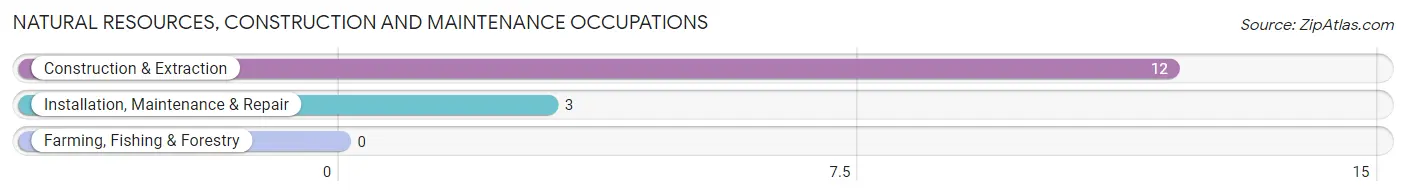
Natural Resources, Construction and Maintenance Occupations by Sex
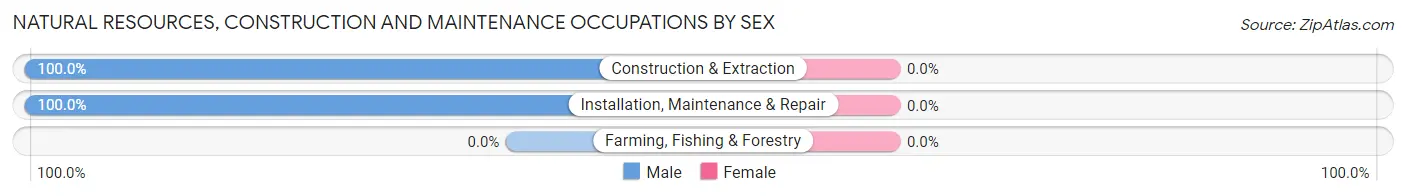
| Occupation | Male | Female |
| Farming, Fishing & Forestry | 0 (0.0%) | 0 (0.0%) |
| Construction & Extraction | 12 (100.0%) | 0 (0.0%) |
| Installation, Maintenance & Repair | 3 (100.0%) | 0 (0.0%) |
| Total (Category) | 15 (100.0%) | 0 (0.0%) |
| Total (Overall) | 55 (72.4%) | 21 (27.6%) |
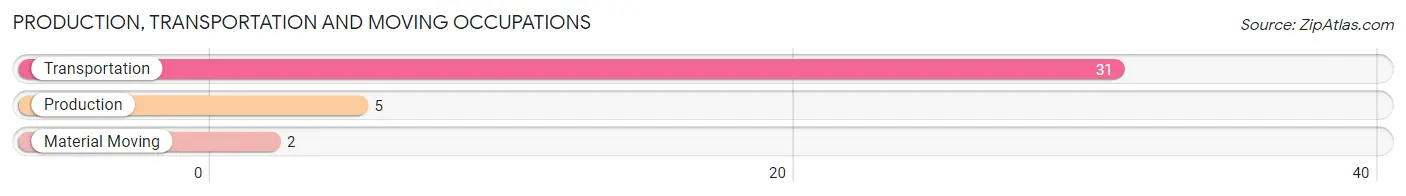
Production, Transportation and Moving Occupations
The most common Production, Transportation and Moving occupations in North Cleveland are Transportation (31 | 40.8%), Production (5 | 6.6%), and Material Moving (2 | 2.6%).
Production, Transportation and Moving Occupations by Sex
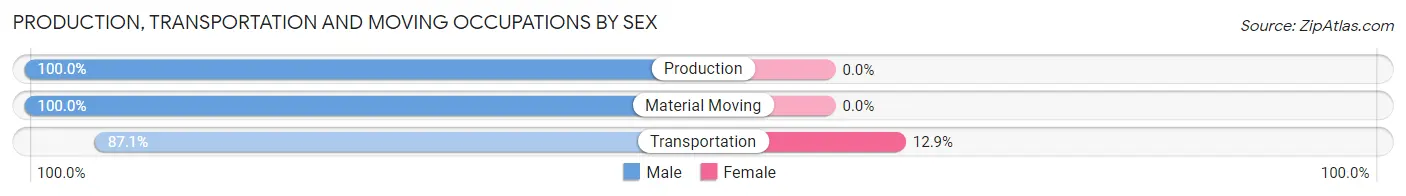
| Occupation | Male | Female |
| Production | 5 (100.0%) | 0 (0.0%) |
| Transportation | 27 (87.1%) | 4 (12.9%) |
| Material Moving | 2 (100.0%) | 0 (0.0%) |
| Total (Category) | 34 (89.5%) | 4 (10.5%) |
| Total (Overall) | 55 (72.4%) | 21 (27.6%) |
Employment Industries by Sex in North Cleveland
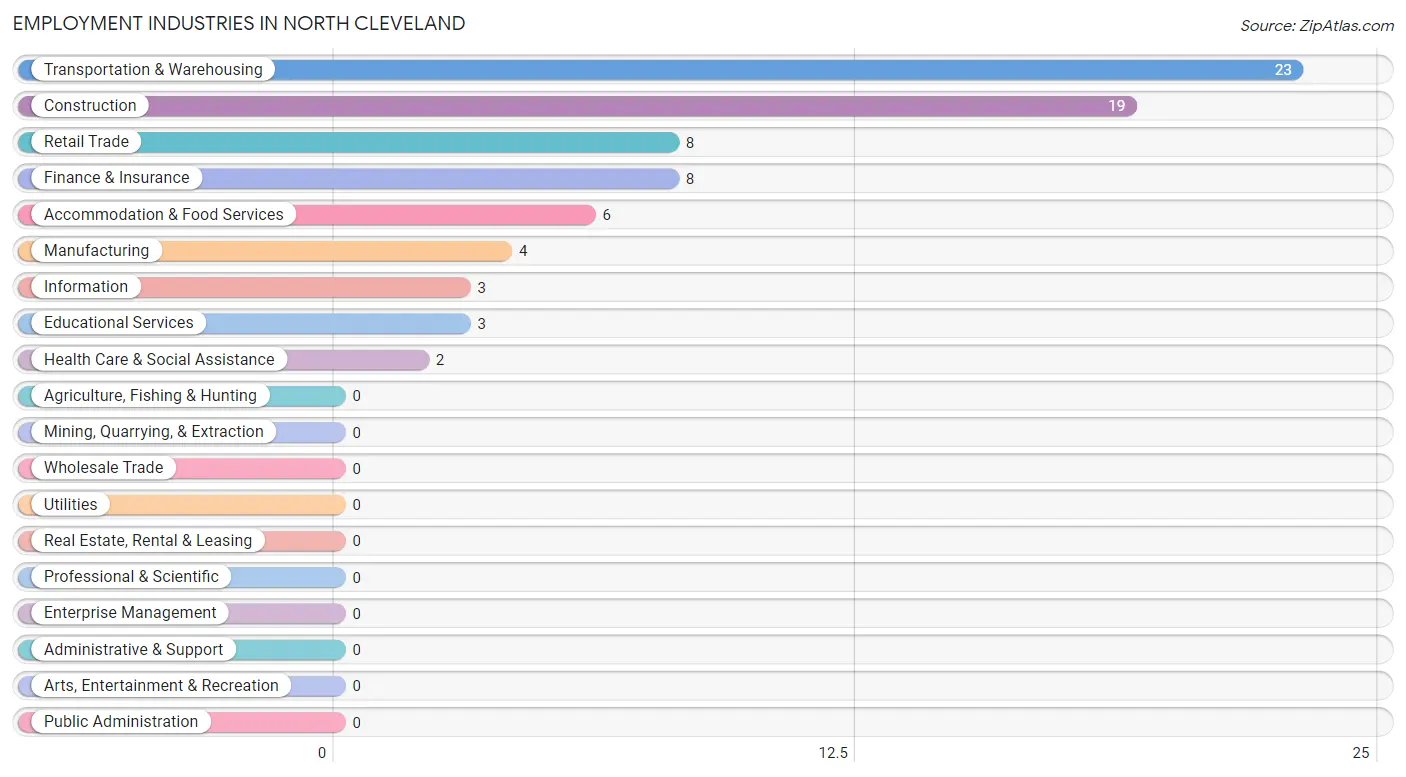
Employment Industries in North Cleveland
The major employment industries in North Cleveland include Transportation & Warehousing (23 | 30.3%), Construction (19 | 25.0%), Retail Trade (8 | 10.5%), Finance & Insurance (8 | 10.5%), and Accommodation & Food Services (6 | 7.9%).
Employment Industries by Sex in North Cleveland
The North Cleveland industries that see more men than women are Construction (100.0%), Manufacturing (100.0%), and Retail Trade (100.0%), whereas the industries that tend to have a higher number of women are Finance & Insurance (100.0%), Health Care & Social Assistance (100.0%), and Accommodation & Food Services (100.0%).
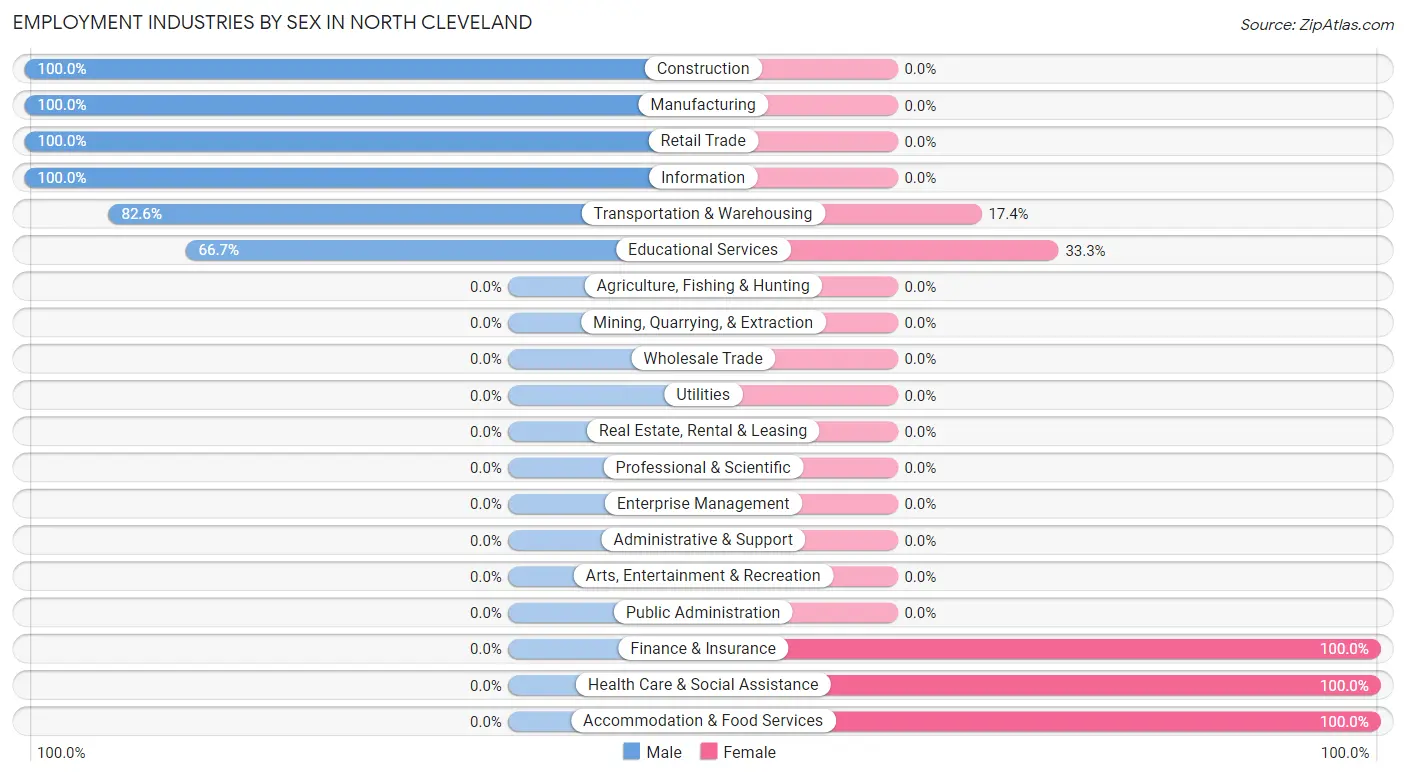
| Industry | Male | Female |
| Agriculture, Fishing & Hunting | 0 (0.0%) | 0 (0.0%) |
| Mining, Quarrying, & Extraction | 0 (0.0%) | 0 (0.0%) |
| Construction | 19 (100.0%) | 0 (0.0%) |
| Manufacturing | 4 (100.0%) | 0 (0.0%) |
| Wholesale Trade | 0 (0.0%) | 0 (0.0%) |
| Retail Trade | 8 (100.0%) | 0 (0.0%) |
| Transportation & Warehousing | 19 (82.6%) | 4 (17.4%) |
| Utilities | 0 (0.0%) | 0 (0.0%) |
| Information | 3 (100.0%) | 0 (0.0%) |
| Finance & Insurance | 0 (0.0%) | 8 (100.0%) |
| Real Estate, Rental & Leasing | 0 (0.0%) | 0 (0.0%) |
| Professional & Scientific | 0 (0.0%) | 0 (0.0%) |
| Enterprise Management | 0 (0.0%) | 0 (0.0%) |
| Administrative & Support | 0 (0.0%) | 0 (0.0%) |
| Educational Services | 2 (66.7%) | 1 (33.3%) |
| Health Care & Social Assistance | 0 (0.0%) | 2 (100.0%) |
| Arts, Entertainment & Recreation | 0 (0.0%) | 0 (0.0%) |
| Accommodation & Food Services | 0 (0.0%) | 6 (100.0%) |
| Public Administration | 0 (0.0%) | 0 (0.0%) |
| Total | 55 (72.4%) | 21 (27.6%) |
Education in North Cleveland
School Enrollment in North Cleveland
The most common levels of schooling among the 27 students in North Cleveland are middle school (13 | 48.1%), college / undergraduate (10 | 37.0%), and nursery / preschool (2 | 7.4%).
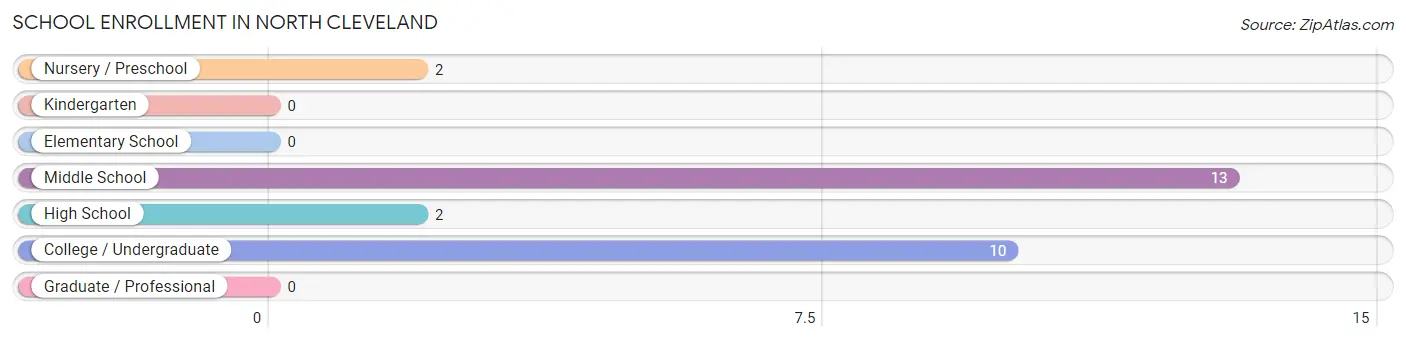
| School Level | # Students | % Students |
| Nursery / Preschool | 2 | 7.4% |
| Kindergarten | 0 | 0.0% |
| Elementary School | 0 | 0.0% |
| Middle School | 13 | 48.1% |
| High School | 2 | 7.4% |
| College / Undergraduate | 10 | 37.0% |
| Graduate / Professional | 0 | 0.0% |
| Total | 27 | 100.0% |
School Enrollment by Age by Funding Source in North Cleveland
Out of a total of 27 students who are enrolled in schools in North Cleveland, 17 (63.0%) attend a private institution, while the remaining 10 (37.0%) are enrolled in public schools. The age group of 10 to 14 year olds has the highest likelihood of being enrolled in private schools, with 10 (100.0% in the age bracket) enrolled. Conversely, the age group of 5 to 9 year old has the lowest likelihood of being enrolled in a private school, with 2 (100.0% in the age bracket) attending a public institution.
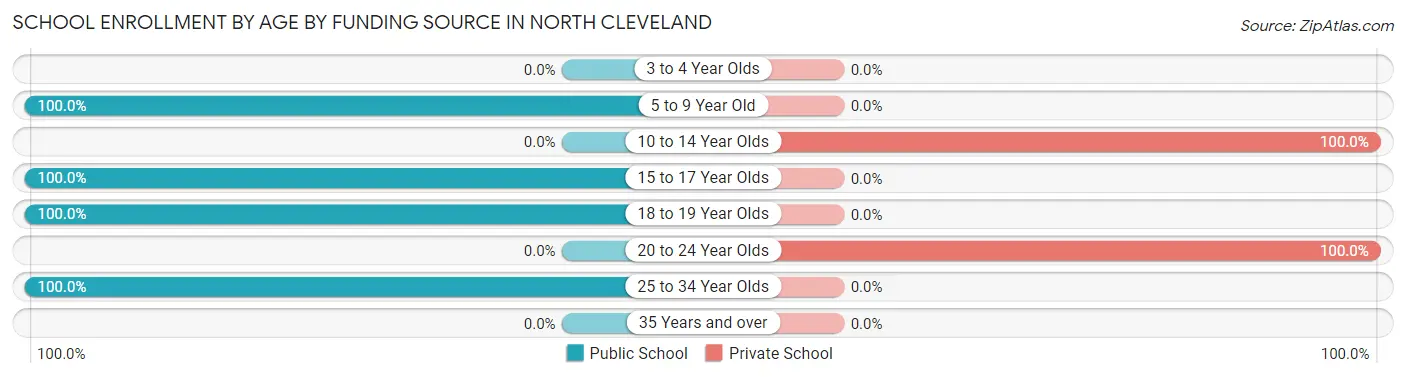
| Age Bracket | Public School | Private School |
| 3 to 4 Year Olds | 0 (0.0%) | 0 (0.0%) |
| 5 to 9 Year Old | 2 (100.0%) | 0 (0.0%) |
| 10 to 14 Year Olds | 0 (0.0%) | 10 (100.0%) |
| 15 to 17 Year Olds | 3 (100.0%) | 0 (0.0%) |
| 18 to 19 Year Olds | 2 (100.0%) | 0 (0.0%) |
| 20 to 24 Year Olds | 0 (0.0%) | 7 (100.0%) |
| 25 to 34 Year Olds | 3 (100.0%) | 0 (0.0%) |
| 35 Years and over | 0 (0.0%) | 0 (0.0%) |
| Total | 10 (37.0%) | 17 (63.0%) |
Educational Attainment by Field of Study in North Cleveland
Education (7 | 58.3%), visual & performing arts (2 | 16.7%), arts & humanities (2 | 16.7%), and engineering (1 | 8.3%) are the most common fields of study among 12 individuals in North Cleveland who have obtained a bachelor's degree or higher.
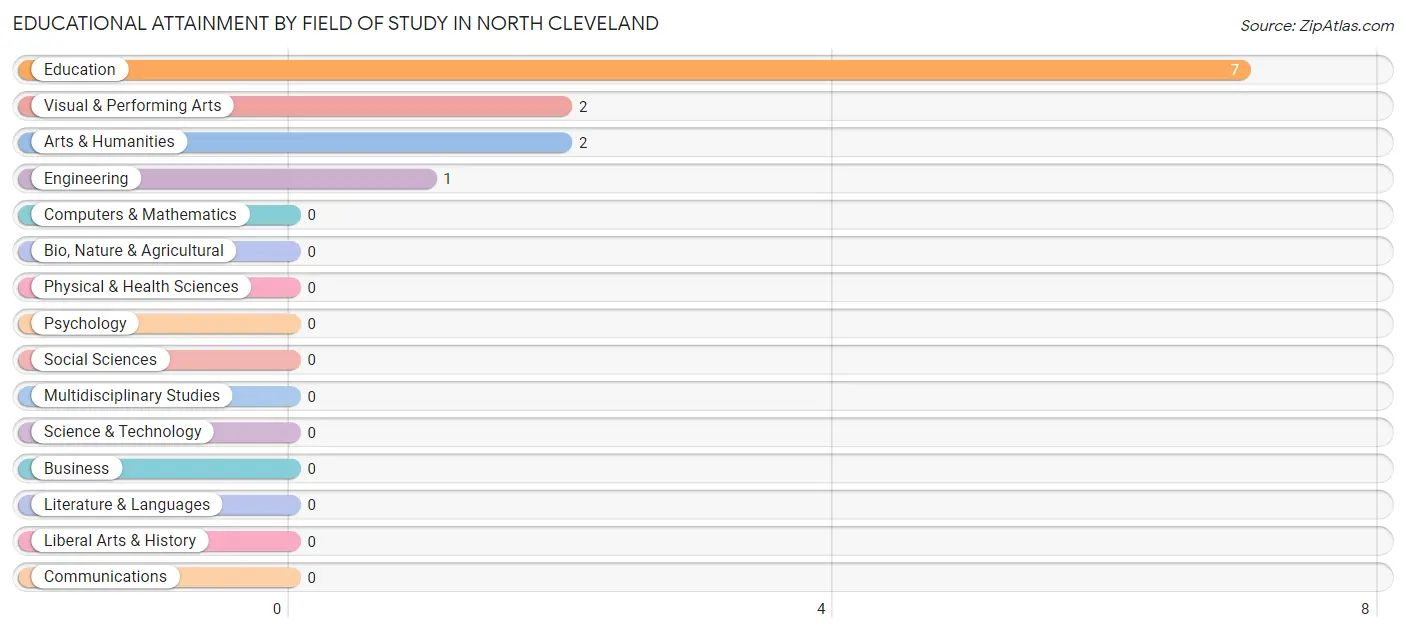
| Field of Study | # Graduates | % Graduates |
| Computers & Mathematics | 0 | 0.0% |
| Bio, Nature & Agricultural | 0 | 0.0% |
| Physical & Health Sciences | 0 | 0.0% |
| Psychology | 0 | 0.0% |
| Social Sciences | 0 | 0.0% |
| Engineering | 1 | 8.3% |
| Multidisciplinary Studies | 0 | 0.0% |
| Science & Technology | 0 | 0.0% |
| Business | 0 | 0.0% |
| Education | 7 | 58.3% |
| Literature & Languages | 0 | 0.0% |
| Liberal Arts & History | 0 | 0.0% |
| Visual & Performing Arts | 2 | 16.7% |
| Communications | 0 | 0.0% |
| Arts & Humanities | 2 | 16.7% |
| Total | 12 | 100.0% |
Transportation & Commute in North Cleveland
Vehicle Availability by Sex in North Cleveland
The most prevalent vehicle ownership categories in North Cleveland are males with 3 vehicles (35, accounting for 63.6%) and females with 3 vehicles (7, making up 166.7%).
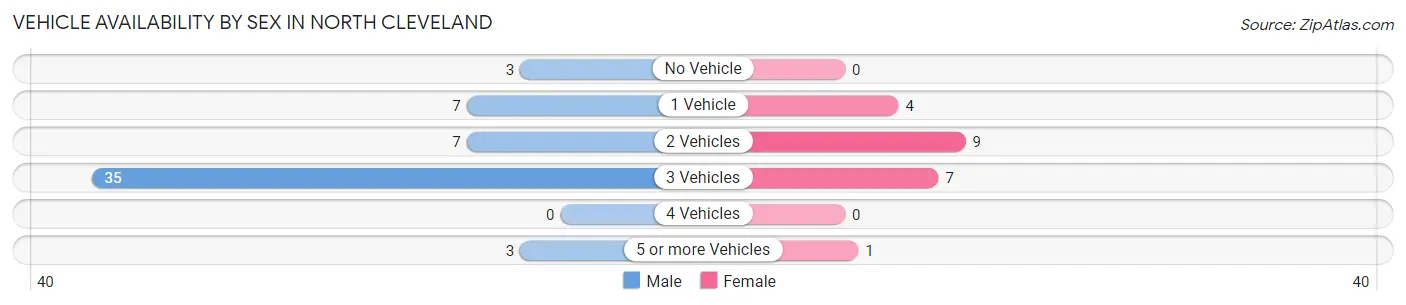
| Vehicles Available | Male | Female |
| No Vehicle | 3 (5.4%) | 0 (0.0%) |
| 1 Vehicle | 7 (12.7%) | 4 (19.1%) |
| 2 Vehicles | 7 (12.7%) | 9 (42.9%) |
| 3 Vehicles | 35 (63.6%) | 7 (33.3%) |
| 4 Vehicles | 0 (0.0%) | 0 (0.0%) |
| 5 or more Vehicles | 3 (5.4%) | 1 (4.8%) |
| Total | 55 (100.0%) | 21 (100.0%) |
Commute Time in North Cleveland
The most frequently occuring commute durations in North Cleveland are 90 or more minutes (29 commuters, 38.2%), 60 to 89 minutes (18 commuters, 23.7%), and 10 to 14 minutes (10 commuters, 13.2%).
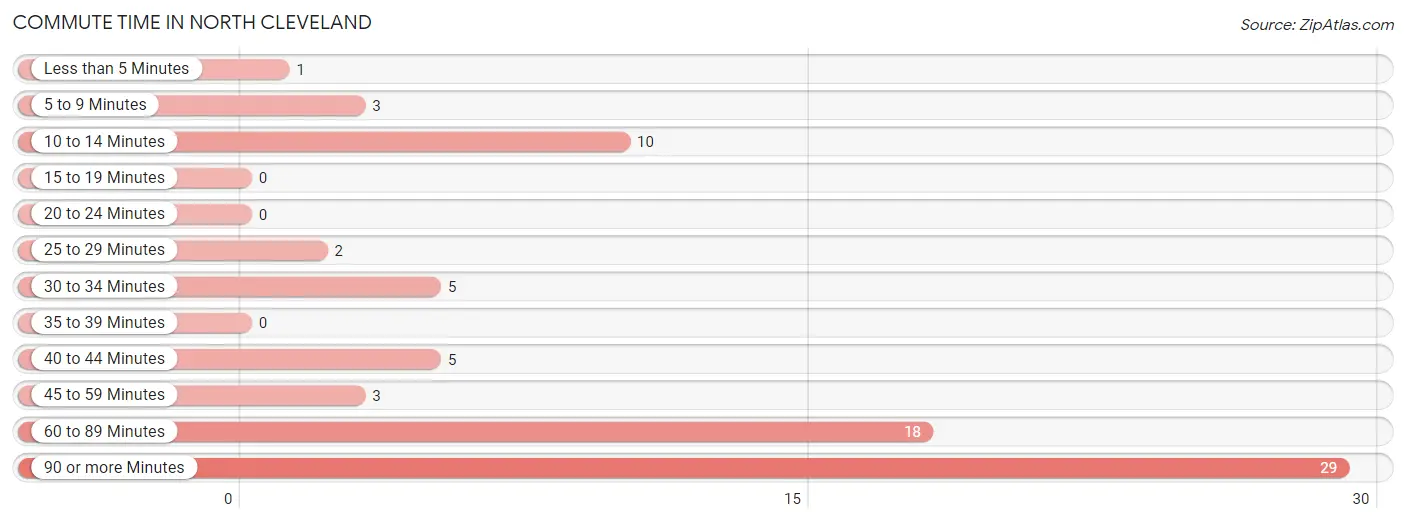
| Commute Time | # Commuters | % Commuters |
| Less than 5 Minutes | 1 | 1.3% |
| 5 to 9 Minutes | 3 | 4.0% |
| 10 to 14 Minutes | 10 | 13.2% |
| 15 to 19 Minutes | 0 | 0.0% |
| 20 to 24 Minutes | 0 | 0.0% |
| 25 to 29 Minutes | 2 | 2.6% |
| 30 to 34 Minutes | 5 | 6.6% |
| 35 to 39 Minutes | 0 | 0.0% |
| 40 to 44 Minutes | 5 | 6.6% |
| 45 to 59 Minutes | 3 | 4.0% |
| 60 to 89 Minutes | 18 | 23.7% |
| 90 or more Minutes | 29 | 38.2% |
Commute Time by Sex in North Cleveland
The most common commute times in North Cleveland are 90 or more minutes (22 commuters, 40.0%) for males and 90 or more minutes (7 commuters, 33.3%) for females.
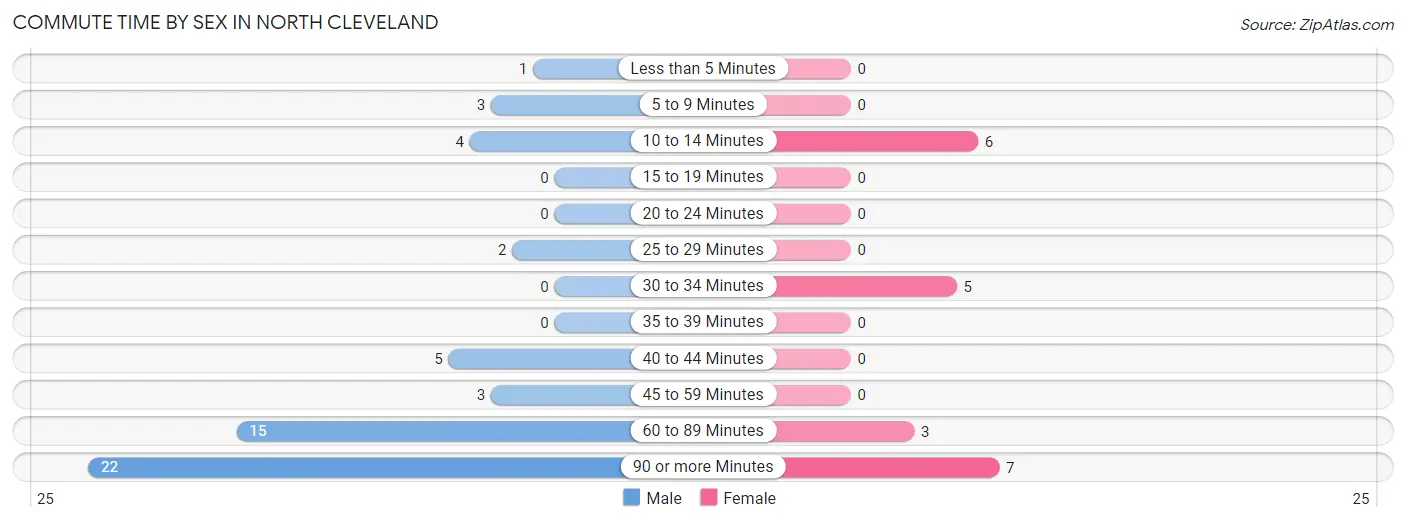
| Commute Time | Male | Female |
| Less than 5 Minutes | 1 (1.8%) | 0 (0.0%) |
| 5 to 9 Minutes | 3 (5.4%) | 0 (0.0%) |
| 10 to 14 Minutes | 4 (7.3%) | 6 (28.6%) |
| 15 to 19 Minutes | 0 (0.0%) | 0 (0.0%) |
| 20 to 24 Minutes | 0 (0.0%) | 0 (0.0%) |
| 25 to 29 Minutes | 2 (3.6%) | 0 (0.0%) |
| 30 to 34 Minutes | 0 (0.0%) | 5 (23.8%) |
| 35 to 39 Minutes | 0 (0.0%) | 0 (0.0%) |
| 40 to 44 Minutes | 5 (9.1%) | 0 (0.0%) |
| 45 to 59 Minutes | 3 (5.4%) | 0 (0.0%) |
| 60 to 89 Minutes | 15 (27.3%) | 3 (14.3%) |
| 90 or more Minutes | 22 (40.0%) | 7 (33.3%) |
Time of Departure to Work by Sex in North Cleveland
The most frequent times of departure to work in North Cleveland are 12:00 AM to 4:59 AM (25, 45.5%) for males and 6:00 AM to 6:29 AM (6, 28.6%) for females.
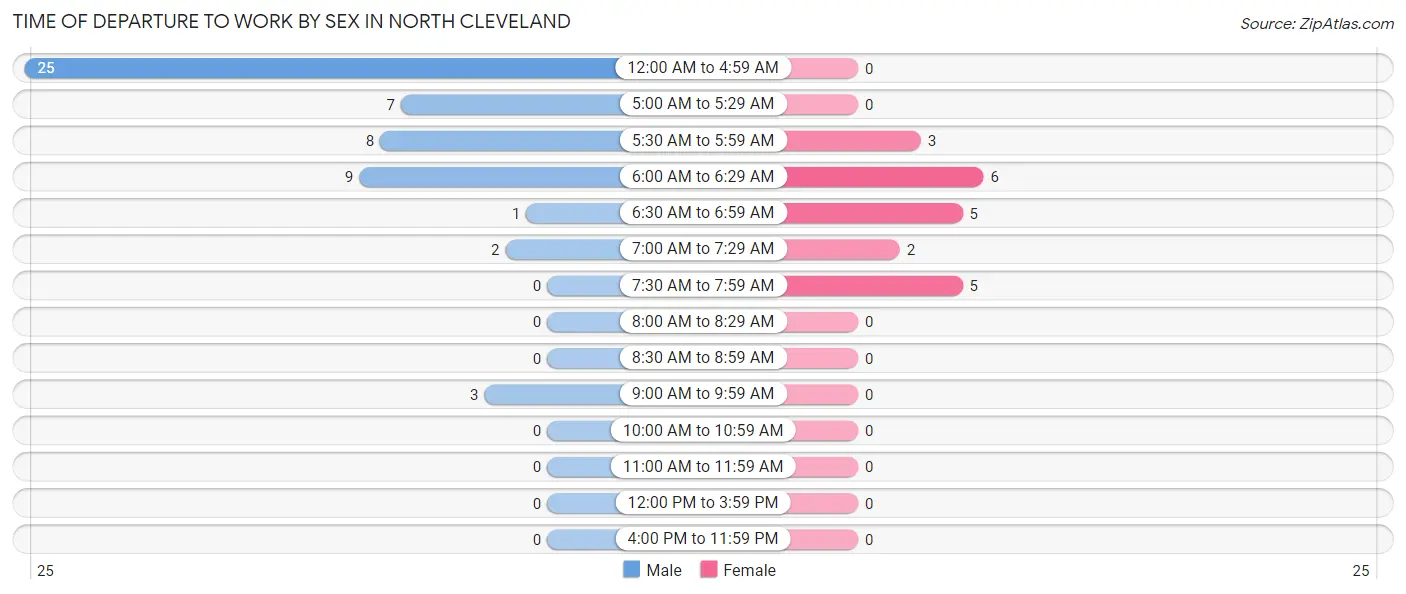
| Time of Departure | Male | Female |
| 12:00 AM to 4:59 AM | 25 (45.5%) | 0 (0.0%) |
| 5:00 AM to 5:29 AM | 7 (12.7%) | 0 (0.0%) |
| 5:30 AM to 5:59 AM | 8 (14.5%) | 3 (14.3%) |
| 6:00 AM to 6:29 AM | 9 (16.4%) | 6 (28.6%) |
| 6:30 AM to 6:59 AM | 1 (1.8%) | 5 (23.8%) |
| 7:00 AM to 7:29 AM | 2 (3.6%) | 2 (9.5%) |
| 7:30 AM to 7:59 AM | 0 (0.0%) | 5 (23.8%) |
| 8:00 AM to 8:29 AM | 0 (0.0%) | 0 (0.0%) |
| 8:30 AM to 8:59 AM | 0 (0.0%) | 0 (0.0%) |
| 9:00 AM to 9:59 AM | 3 (5.4%) | 0 (0.0%) |
| 10:00 AM to 10:59 AM | 0 (0.0%) | 0 (0.0%) |
| 11:00 AM to 11:59 AM | 0 (0.0%) | 0 (0.0%) |
| 12:00 PM to 3:59 PM | 0 (0.0%) | 0 (0.0%) |
| 4:00 PM to 11:59 PM | 0 (0.0%) | 0 (0.0%) |
| Total | 55 (100.0%) | 21 (100.0%) |
Housing Occupancy in North Cleveland
Occupancy by Ownership in North Cleveland
Of the total 88 dwellings in North Cleveland, owner-occupied units account for 85 (96.6%), while renter-occupied units make up 3 (3.4%).
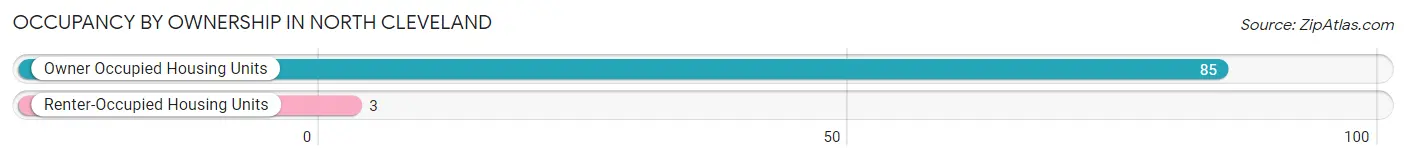
| Occupancy | # Housing Units | % Housing Units |
| Owner Occupied Housing Units | 85 | 96.6% |
| Renter-Occupied Housing Units | 3 | 3.4% |
| Total Occupied Housing Units | 88 | 100.0% |
Occupancy by Household Size in North Cleveland
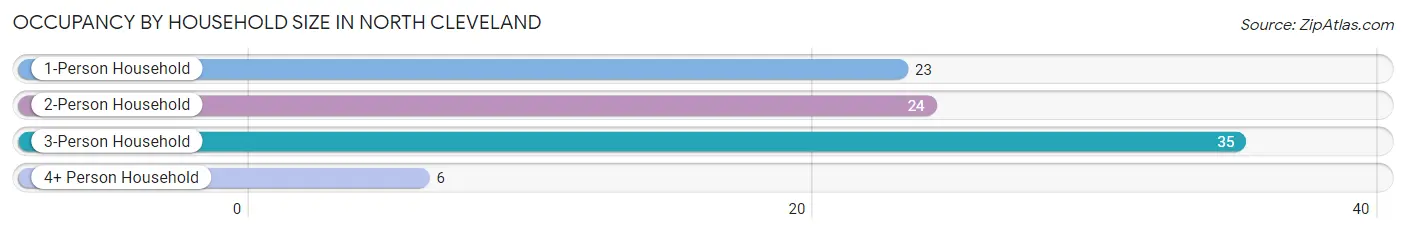
| Household Size | # Housing Units | % Housing Units |
| 1-Person Household | 23 | 26.1% |
| 2-Person Household | 24 | 27.3% |
| 3-Person Household | 35 | 39.8% |
| 4+ Person Household | 6 | 6.8% |
| Total Housing Units | 88 | 100.0% |
Occupancy by Ownership by Household Size in North Cleveland

| Household Size | Owner-occupied | Renter-occupied |
| 1-Person Household | 20 (87.0%) | 3 (13.0%) |
| 2-Person Household | 24 (100.0%) | 0 (0.0%) |
| 3-Person Household | 35 (100.0%) | 0 (0.0%) |
| 4+ Person Household | 6 (100.0%) | 0 (0.0%) |
| Total Housing Units | 85 (96.6%) | 3 (3.4%) |
Occupancy by Educational Attainment in North Cleveland
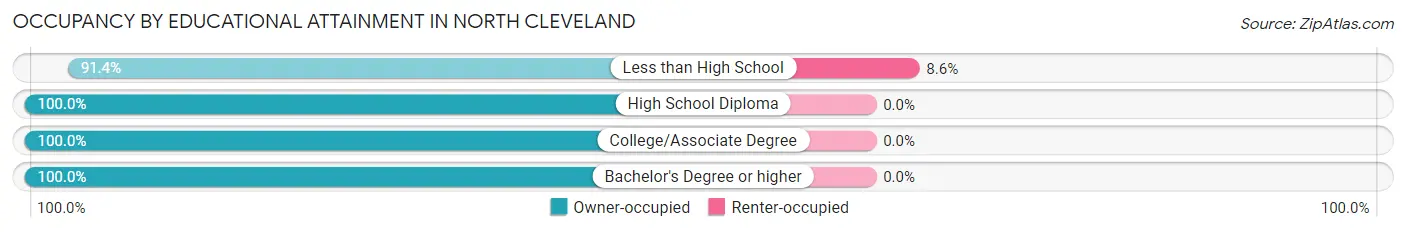
| Household Size | Owner-occupied | Renter-occupied |
| Less than High School | 32 (91.4%) | 3 (8.6%) |
| High School Diploma | 37 (100.0%) | 0 (0.0%) |
| College/Associate Degree | 15 (100.0%) | 0 (0.0%) |
| Bachelor's Degree or higher | 1 (100.0%) | 0 (0.0%) |
Occupancy by Age of Householder in North Cleveland
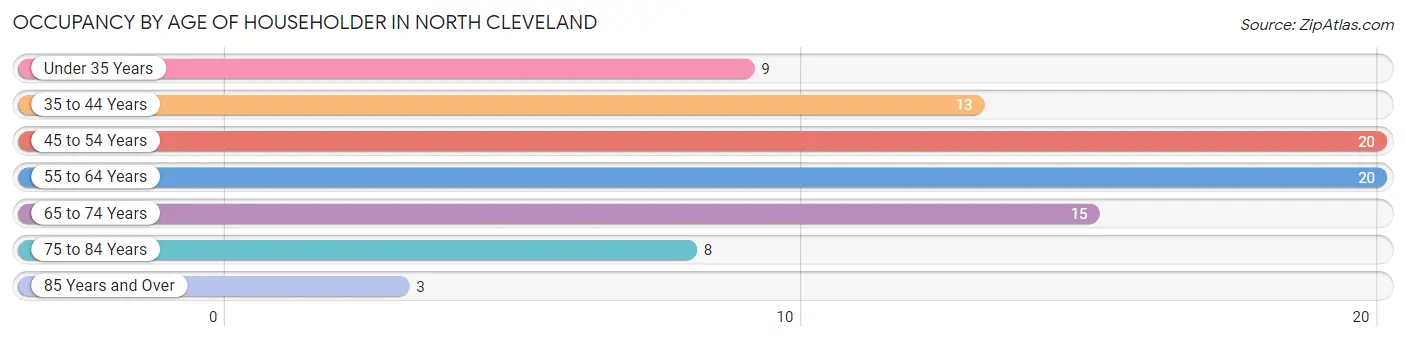
| Age Bracket | # Households | % Households |
| Under 35 Years | 9 | 10.2% |
| 35 to 44 Years | 13 | 14.8% |
| 45 to 54 Years | 20 | 22.7% |
| 55 to 64 Years | 20 | 22.7% |
| 65 to 74 Years | 15 | 17.1% |
| 75 to 84 Years | 8 | 9.1% |
| 85 Years and Over | 3 | 3.4% |
| Total | 88 | 100.0% |
Housing Finances in North Cleveland
Median Income by Occupancy in North Cleveland
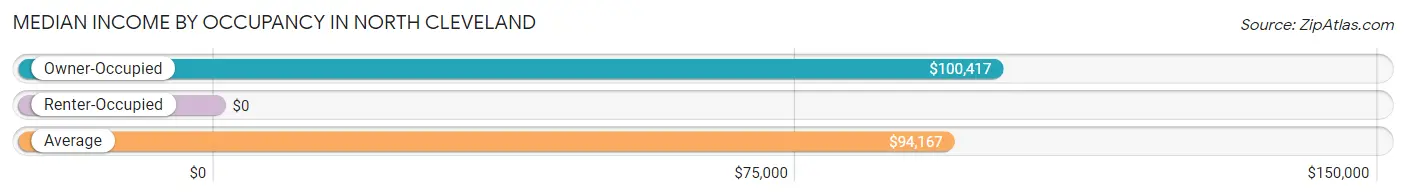
| Occupancy Type | # Households | Median Income |
| Owner-Occupied | 85 (96.6%) | $100,417 |
| Renter-Occupied | 3 (3.4%) | $0 |
| Average | 88 (100.0%) | $94,167 |
Occupancy by Householder Income Bracket in North Cleveland
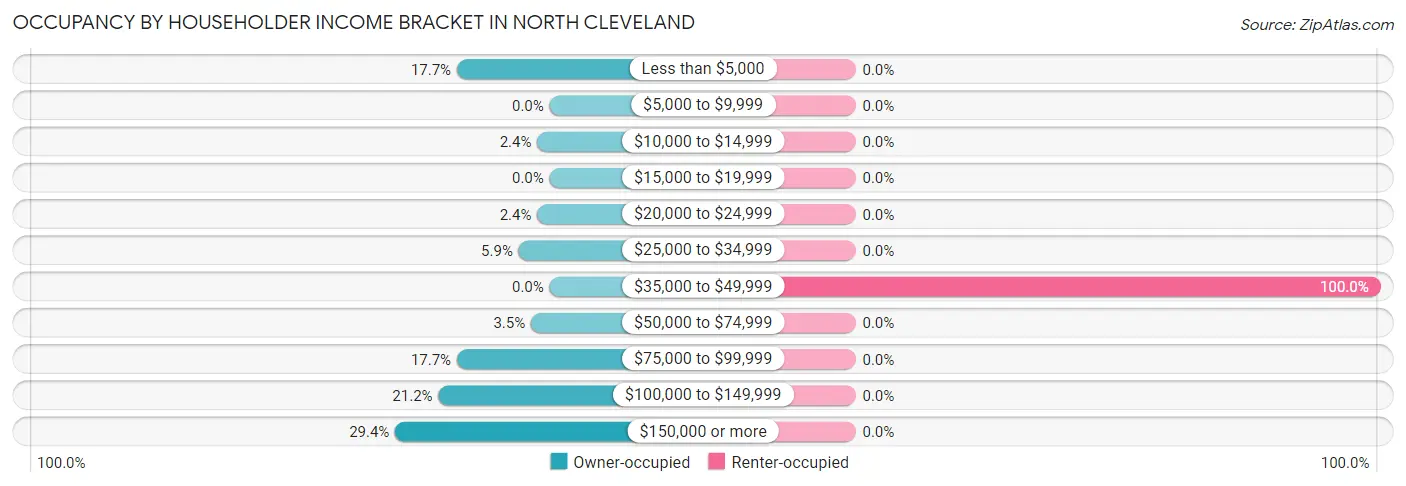
| Income Bracket | Owner-occupied | Renter-occupied |
| Less than $5,000 | 15 (17.6%) | 0 (0.0%) |
| $5,000 to $9,999 | 0 (0.0%) | 0 (0.0%) |
| $10,000 to $14,999 | 2 (2.4%) | 0 (0.0%) |
| $15,000 to $19,999 | 0 (0.0%) | 0 (0.0%) |
| $20,000 to $24,999 | 2 (2.4%) | 0 (0.0%) |
| $25,000 to $34,999 | 5 (5.9%) | 0 (0.0%) |
| $35,000 to $49,999 | 0 (0.0%) | 3 (100.0%) |
| $50,000 to $74,999 | 3 (3.5%) | 0 (0.0%) |
| $75,000 to $99,999 | 15 (17.6%) | 0 (0.0%) |
| $100,000 to $149,999 | 18 (21.2%) | 0 (0.0%) |
| $150,000 or more | 25 (29.4%) | 0 (0.0%) |
| Total | 85 (100.0%) | 3 (100.0%) |
Monthly Housing Cost Tiers in North Cleveland
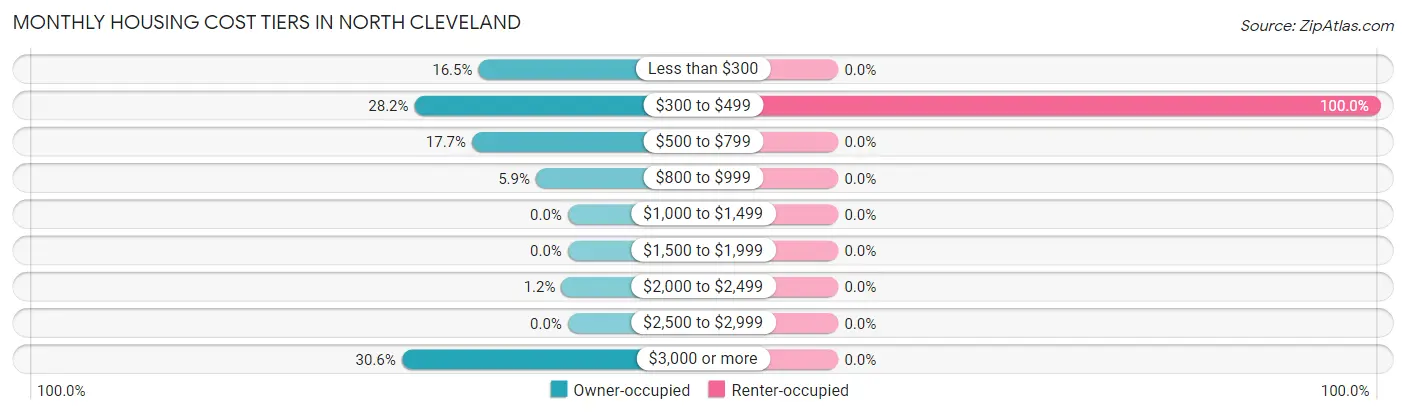
| Monthly Cost | Owner-occupied | Renter-occupied |
| Less than $300 | 14 (16.5%) | 0 (0.0%) |
| $300 to $499 | 24 (28.2%) | 3 (100.0%) |
| $500 to $799 | 15 (17.6%) | 0 (0.0%) |
| $800 to $999 | 5 (5.9%) | 0 (0.0%) |
| $1,000 to $1,499 | 0 (0.0%) | 0 (0.0%) |
| $1,500 to $1,999 | 0 (0.0%) | 0 (0.0%) |
| $2,000 to $2,499 | 1 (1.2%) | 0 (0.0%) |
| $2,500 to $2,999 | 0 (0.0%) | 0 (0.0%) |
| $3,000 or more | 26 (30.6%) | 0 (0.0%) |
| Total | 85 (100.0%) | 3 (100.0%) |
Physical Housing Characteristics in North Cleveland
Housing Structures in North Cleveland
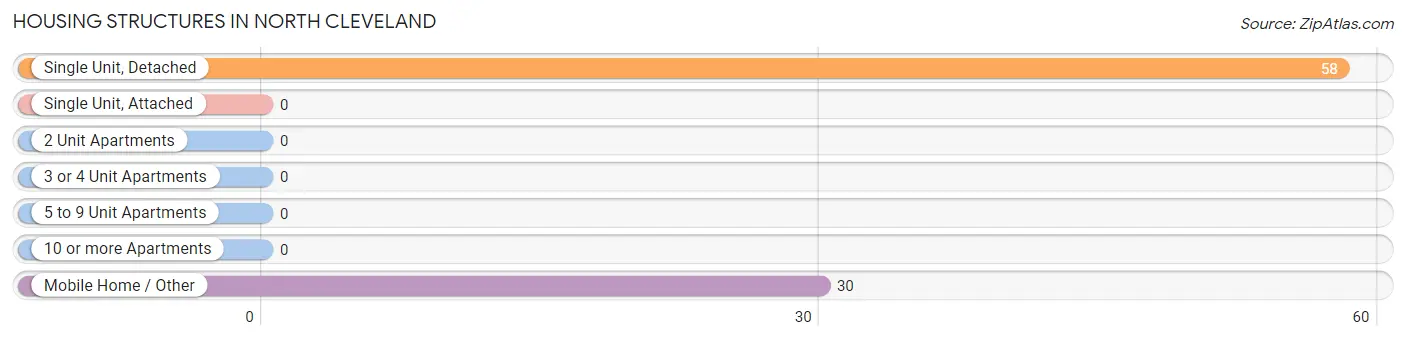
| Structure Type | # Housing Units | % Housing Units |
| Single Unit, Detached | 58 | 65.9% |
| Single Unit, Attached | 0 | 0.0% |
| 2 Unit Apartments | 0 | 0.0% |
| 3 or 4 Unit Apartments | 0 | 0.0% |
| 5 to 9 Unit Apartments | 0 | 0.0% |
| 10 or more Apartments | 0 | 0.0% |
| Mobile Home / Other | 30 | 34.1% |
| Total | 88 | 100.0% |
Housing Structures by Occupancy in North Cleveland
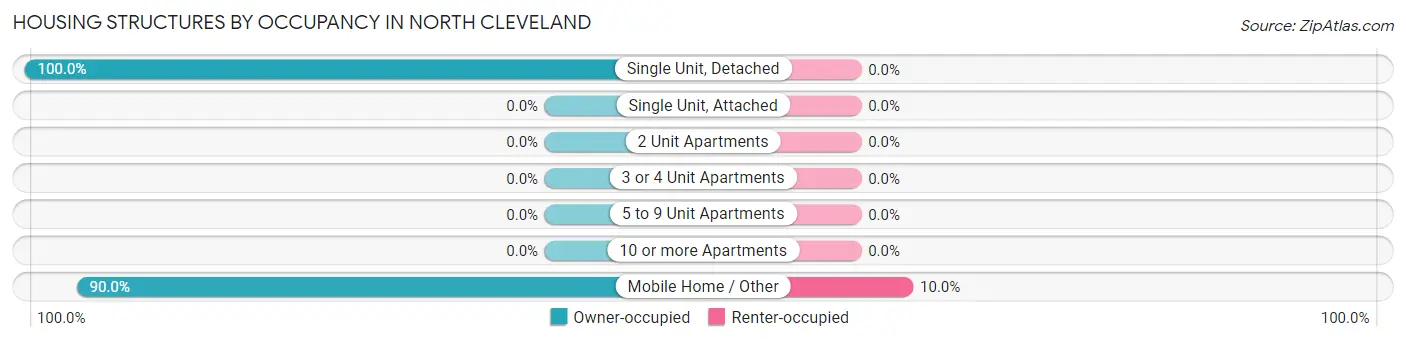
| Structure Type | Owner-occupied | Renter-occupied |
| Single Unit, Detached | 58 (100.0%) | 0 (0.0%) |
| Single Unit, Attached | 0 (0.0%) | 0 (0.0%) |
| 2 Unit Apartments | 0 (0.0%) | 0 (0.0%) |
| 3 or 4 Unit Apartments | 0 (0.0%) | 0 (0.0%) |
| 5 to 9 Unit Apartments | 0 (0.0%) | 0 (0.0%) |
| 10 or more Apartments | 0 (0.0%) | 0 (0.0%) |
| Mobile Home / Other | 27 (90.0%) | 3 (10.0%) |
| Total | 85 (96.6%) | 3 (3.4%) |
Housing Structures by Number of Rooms in North Cleveland
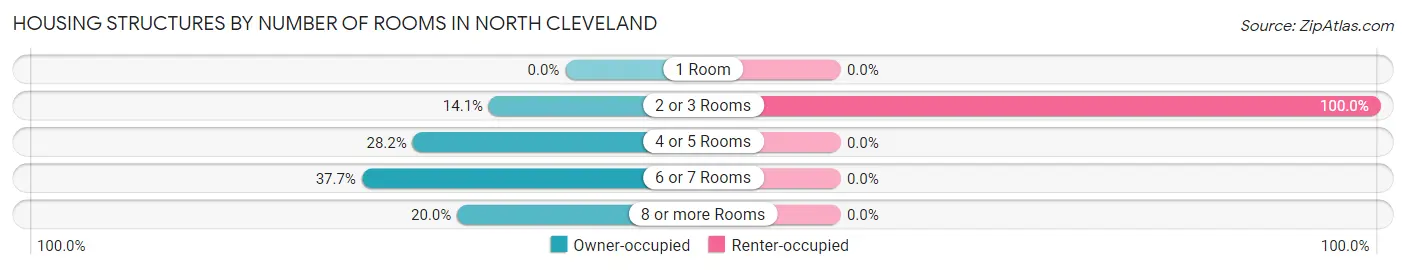
| Number of Rooms | Owner-occupied | Renter-occupied |
| 1 Room | 0 (0.0%) | 0 (0.0%) |
| 2 or 3 Rooms | 12 (14.1%) | 3 (100.0%) |
| 4 or 5 Rooms | 24 (28.2%) | 0 (0.0%) |
| 6 or 7 Rooms | 32 (37.7%) | 0 (0.0%) |
| 8 or more Rooms | 17 (20.0%) | 0 (0.0%) |
| Total | 85 (100.0%) | 3 (100.0%) |
Housing Structure by Heating Type in North Cleveland
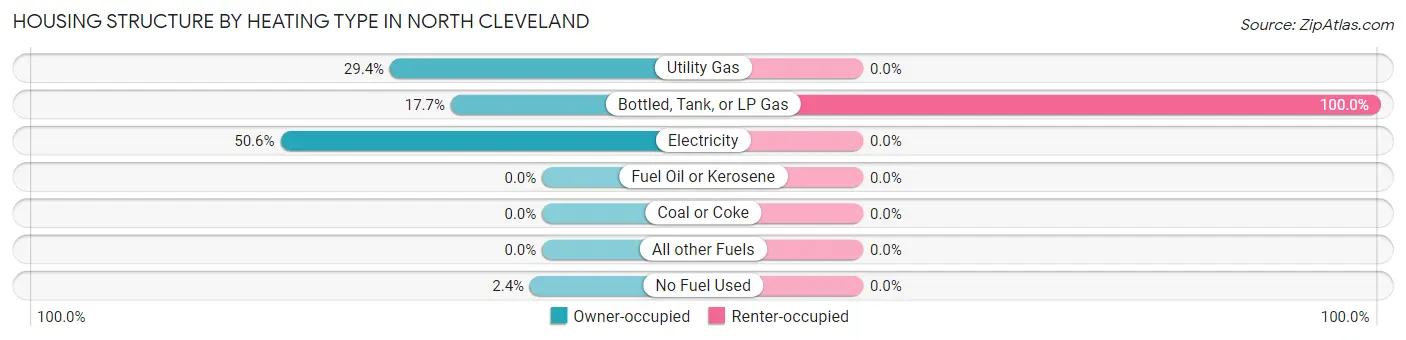
| Heating Type | Owner-occupied | Renter-occupied |
| Utility Gas | 25 (29.4%) | 0 (0.0%) |
| Bottled, Tank, or LP Gas | 15 (17.6%) | 3 (100.0%) |
| Electricity | 43 (50.6%) | 0 (0.0%) |
| Fuel Oil or Kerosene | 0 (0.0%) | 0 (0.0%) |
| Coal or Coke | 0 (0.0%) | 0 (0.0%) |
| All other Fuels | 0 (0.0%) | 0 (0.0%) |
| No Fuel Used | 2 (2.4%) | 0 (0.0%) |
| Total | 85 (100.0%) | 3 (100.0%) |
Household Vehicle Usage in North Cleveland
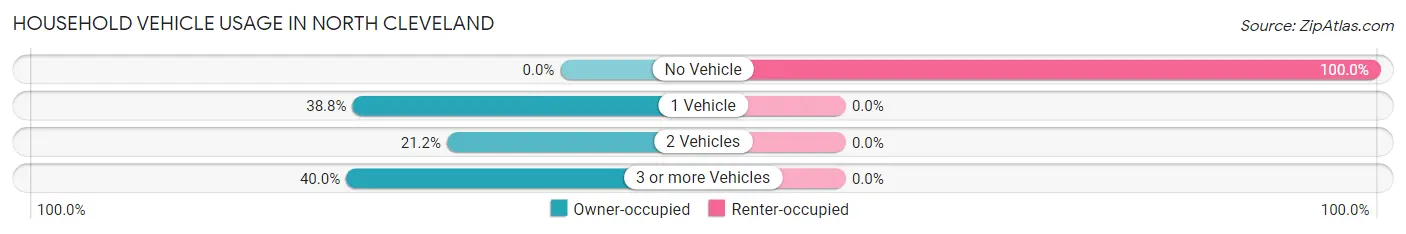
| Vehicles per Household | Owner-occupied | Renter-occupied |
| No Vehicle | 0 (0.0%) | 3 (100.0%) |
| 1 Vehicle | 33 (38.8%) | 0 (0.0%) |
| 2 Vehicles | 18 (21.2%) | 0 (0.0%) |
| 3 or more Vehicles | 34 (40.0%) | 0 (0.0%) |
| Total | 85 (100.0%) | 3 (100.0%) |
Real Estate & Mortgages in North Cleveland
Real Estate and Mortgage Overview in North Cleveland
| Characteristic | Without Mortgage | With Mortgage |
| Housing Units | 58 | 27 |
| Median Property Value | $138,600 | $205,800 |
| Median Household Income | $94,167 | $15 |
| Monthly Housing Costs | $457 | $26 |
| Real Estate Taxes | $1,250 | $0 |
Property Value by Mortgage Status in North Cleveland
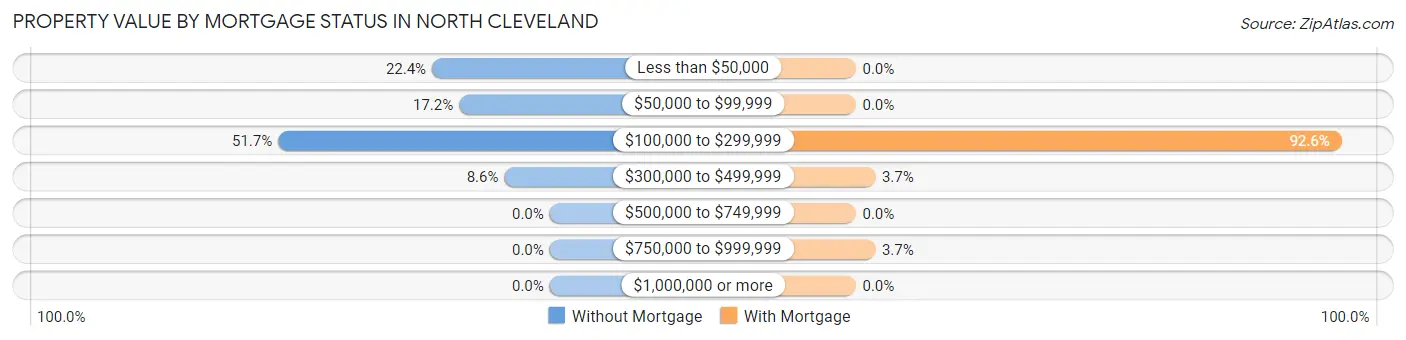
| Property Value | Without Mortgage | With Mortgage |
| Less than $50,000 | 13 (22.4%) | 0 (0.0%) |
| $50,000 to $99,999 | 10 (17.2%) | 0 (0.0%) |
| $100,000 to $299,999 | 30 (51.7%) | 25 (92.6%) |
| $300,000 to $499,999 | 5 (8.6%) | 1 (3.7%) |
| $500,000 to $749,999 | 0 (0.0%) | 0 (0.0%) |
| $750,000 to $999,999 | 0 (0.0%) | 1 (3.7%) |
| $1,000,000 or more | 0 (0.0%) | 0 (0.0%) |
| Total | 58 (100.0%) | 27 (100.0%) |
Household Income by Mortgage Status in North Cleveland
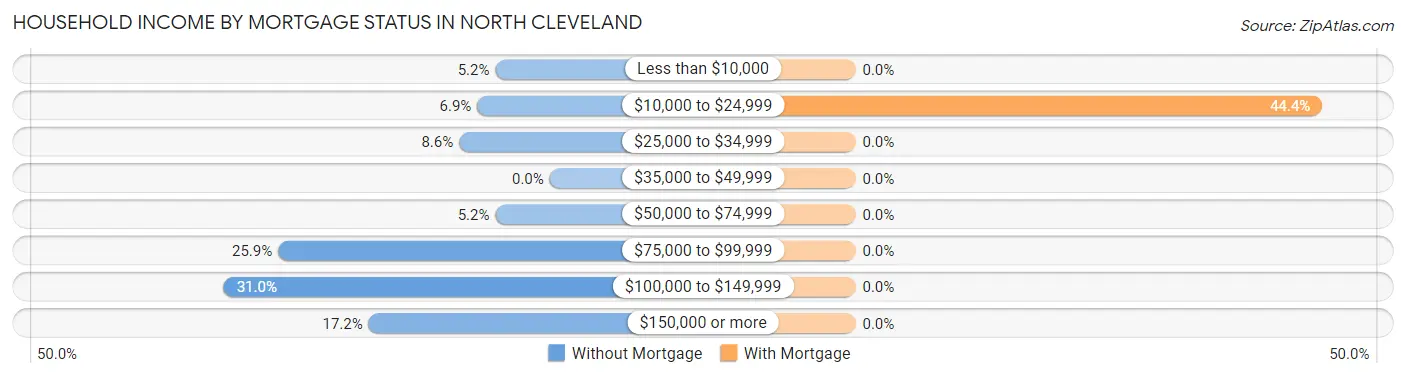
| Household Income | Without Mortgage | With Mortgage |
| Less than $10,000 | 3 (5.2%) | 0 (0.0%) |
| $10,000 to $24,999 | 4 (6.9%) | 12 (44.4%) |
| $25,000 to $34,999 | 5 (8.6%) | 0 (0.0%) |
| $35,000 to $49,999 | 0 (0.0%) | 0 (0.0%) |
| $50,000 to $74,999 | 3 (5.2%) | 0 (0.0%) |
| $75,000 to $99,999 | 15 (25.9%) | 0 (0.0%) |
| $100,000 to $149,999 | 18 (31.0%) | 0 (0.0%) |
| $150,000 or more | 10 (17.2%) | 0 (0.0%) |
| Total | 58 (100.0%) | 27 (100.0%) |
Property Value to Household Income Ratio in North Cleveland
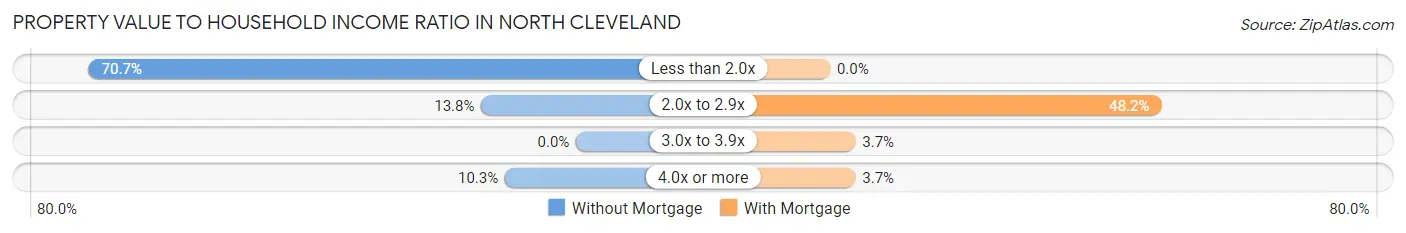
| Value-to-Income Ratio | Without Mortgage | With Mortgage |
| Less than 2.0x | 41 (70.7%) | 0 (0.0%) |
| 2.0x to 2.9x | 8 (13.8%) | 13 (48.1%) |
| 3.0x to 3.9x | 0 (0.0%) | 1 (3.7%) |
| 4.0x or more | 6 (10.3%) | 1 (3.7%) |
| Total | 58 (100.0%) | 27 (100.0%) |
Real Estate Taxes by Mortgage Status in North Cleveland
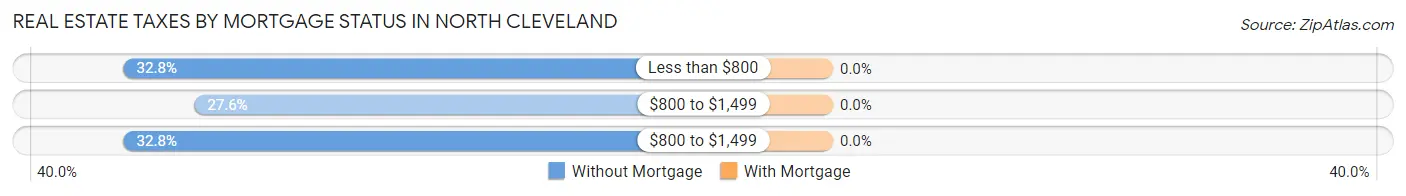
| Property Taxes | Without Mortgage | With Mortgage |
| Less than $800 | 19 (32.8%) | 0 (0.0%) |
| $800 to $1,499 | 16 (27.6%) | 0 (0.0%) |
| $800 to $1,499 | 19 (32.8%) | 0 (0.0%) |
| Total | 58 (100.0%) | 27 (100.0%) |
Health & Disability in North Cleveland
Health Insurance Coverage by Age in North Cleveland
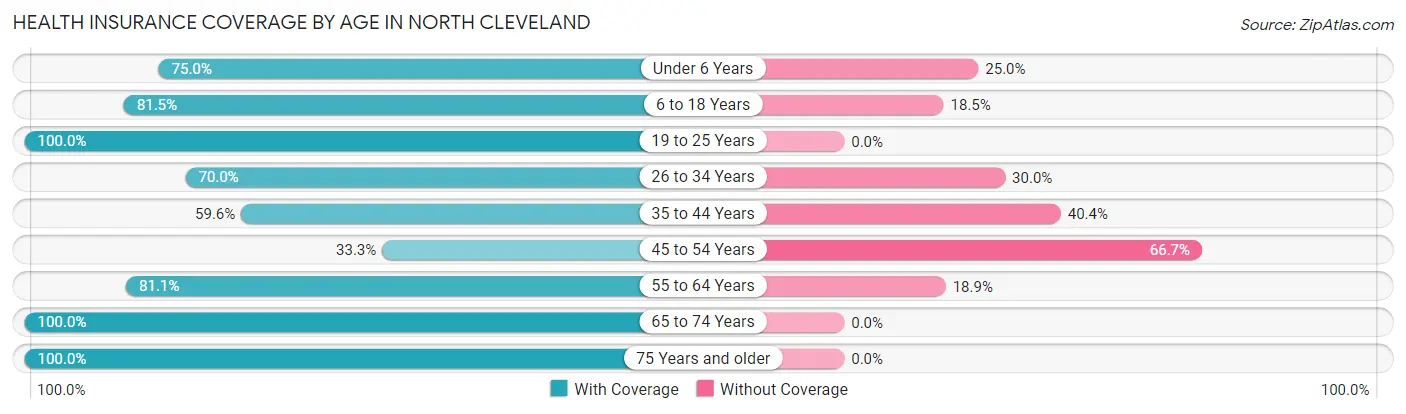
| Age Bracket | With Coverage | Without Coverage |
| Under 6 Years | 3 (75.0%) | 1 (25.0%) |
| 6 to 18 Years | 22 (81.5%) | 5 (18.5%) |
| 19 to 25 Years | 7 (100.0%) | 0 (0.0%) |
| 26 to 34 Years | 14 (70.0%) | 6 (30.0%) |
| 35 to 44 Years | 31 (59.6%) | 21 (40.4%) |
| 45 to 54 Years | 8 (33.3%) | 16 (66.7%) |
| 55 to 64 Years | 30 (81.1%) | 7 (18.9%) |
| 65 to 74 Years | 16 (100.0%) | 0 (0.0%) |
| 75 Years and older | 19 (100.0%) | 0 (0.0%) |
| Total | 150 (72.8%) | 56 (27.2%) |
Health Insurance Coverage by Citizenship Status in North Cleveland
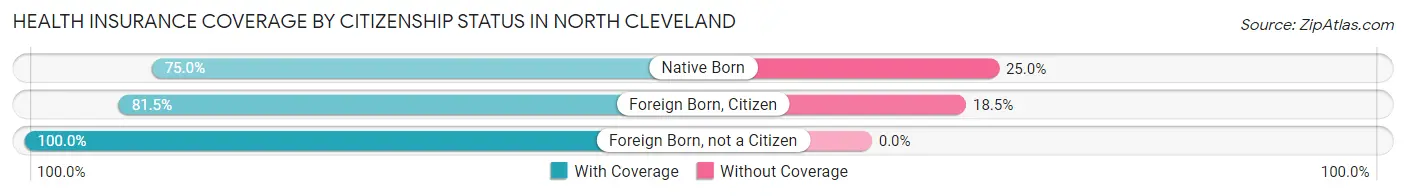
| Citizenship Status | With Coverage | Without Coverage |
| Native Born | 3 (75.0%) | 1 (25.0%) |
| Foreign Born, Citizen | 22 (81.5%) | 5 (18.5%) |
| Foreign Born, not a Citizen | 7 (100.0%) | 0 (0.0%) |
Health Insurance Coverage by Household Income in North Cleveland
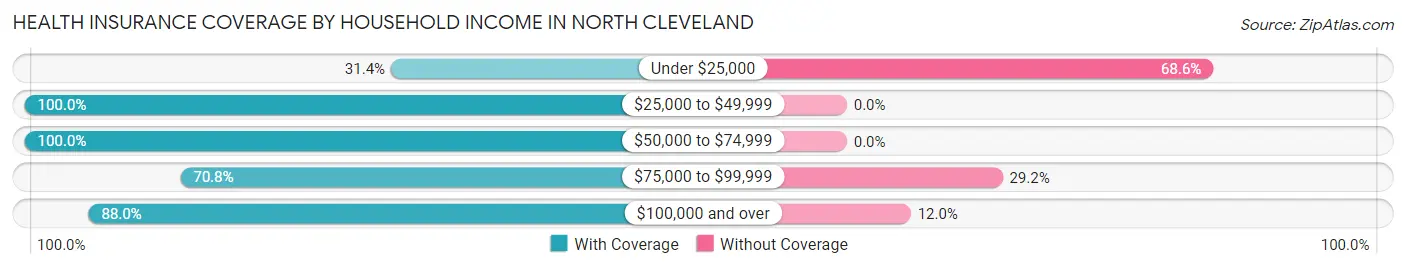
| Household Income | With Coverage | Without Coverage |
| Under $25,000 | 16 (31.4%) | 35 (68.6%) |
| $25,000 to $49,999 | 8 (100.0%) | 0 (0.0%) |
| $50,000 to $74,999 | 6 (100.0%) | 0 (0.0%) |
| $75,000 to $99,999 | 17 (70.8%) | 7 (29.2%) |
| $100,000 and over | 103 (88.0%) | 14 (12.0%) |
Public vs Private Health Insurance Coverage by Age in North Cleveland
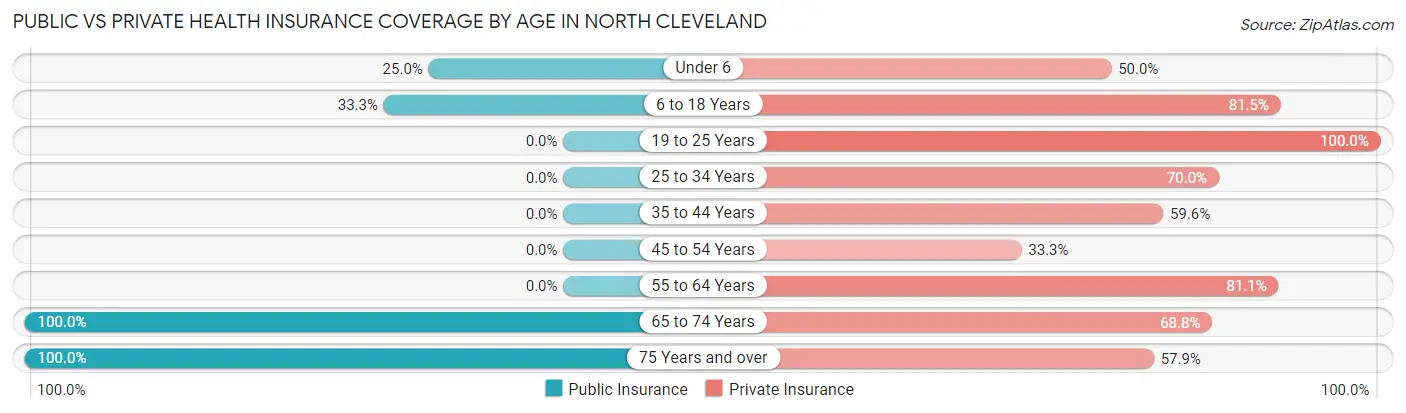
| Age Bracket | Public Insurance | Private Insurance |
| Under 6 | 1 (25.0%) | 2 (50.0%) |
| 6 to 18 Years | 9 (33.3%) | 22 (81.5%) |
| 19 to 25 Years | 0 (0.0%) | 7 (100.0%) |
| 25 to 34 Years | 0 (0.0%) | 14 (70.0%) |
| 35 to 44 Years | 0 (0.0%) | 31 (59.6%) |
| 45 to 54 Years | 0 (0.0%) | 8 (33.3%) |
| 55 to 64 Years | 0 (0.0%) | 30 (81.1%) |
| 65 to 74 Years | 16 (100.0%) | 11 (68.8%) |
| 75 Years and over | 19 (100.0%) | 11 (57.9%) |
| Total | 45 (21.8%) | 136 (66.0%) |
Disability Status by Sex by Age in North Cleveland
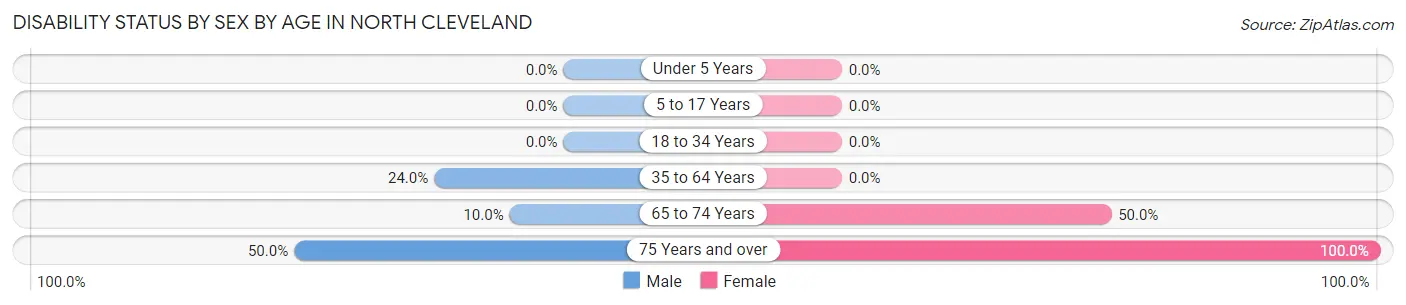
| Age Bracket | Male | Female |
| Under 5 Years | 0 (0.0%) | 0 (0.0%) |
| 5 to 17 Years | 0 (0.0%) | 0 (0.0%) |
| 18 to 34 Years | 0 (0.0%) | 0 (0.0%) |
| 35 to 64 Years | 12 (24.0%) | 0 (0.0%) |
| 65 to 74 Years | 1 (10.0%) | 3 (50.0%) |
| 75 Years and over | 4 (50.0%) | 11 (100.0%) |
Disability Class by Sex by Age in North Cleveland
Disability Class: Hearing Difficulty
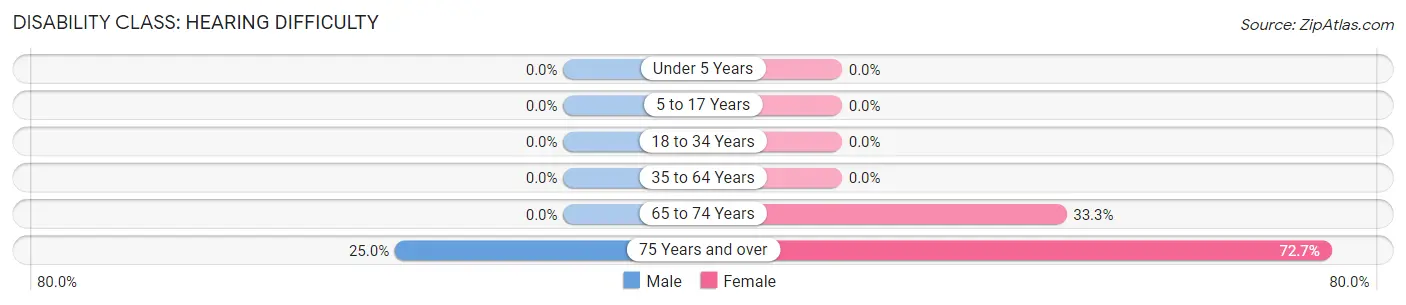
| Age Bracket | Male | Female |
| Under 5 Years | 0 (0.0%) | 0 (0.0%) |
| 5 to 17 Years | 0 (0.0%) | 0 (0.0%) |
| 18 to 34 Years | 0 (0.0%) | 0 (0.0%) |
| 35 to 64 Years | 0 (0.0%) | 0 (0.0%) |
| 65 to 74 Years | 0 (0.0%) | 2 (33.3%) |
| 75 Years and over | 2 (25.0%) | 8 (72.7%) |
Disability Class: Vision Difficulty
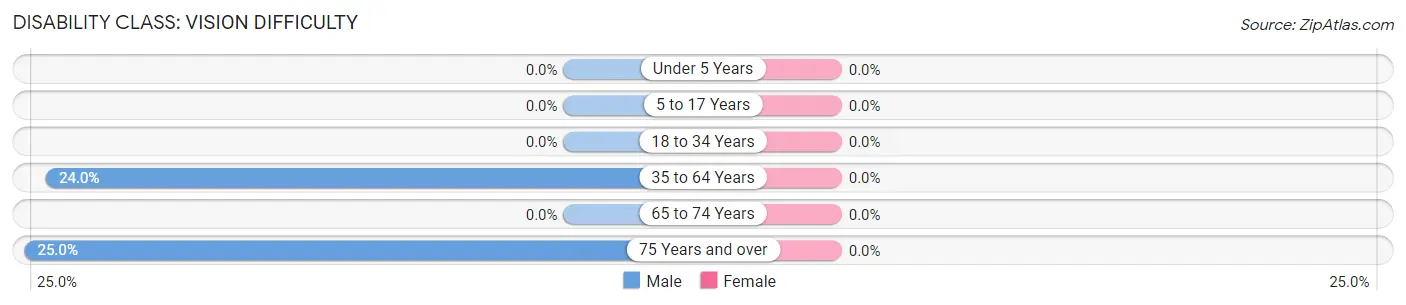
| Age Bracket | Male | Female |
| Under 5 Years | 0 (0.0%) | 0 (0.0%) |
| 5 to 17 Years | 0 (0.0%) | 0 (0.0%) |
| 18 to 34 Years | 0 (0.0%) | 0 (0.0%) |
| 35 to 64 Years | 12 (24.0%) | 0 (0.0%) |
| 65 to 74 Years | 0 (0.0%) | 0 (0.0%) |
| 75 Years and over | 2 (25.0%) | 0 (0.0%) |
Disability Class: Cognitive Difficulty
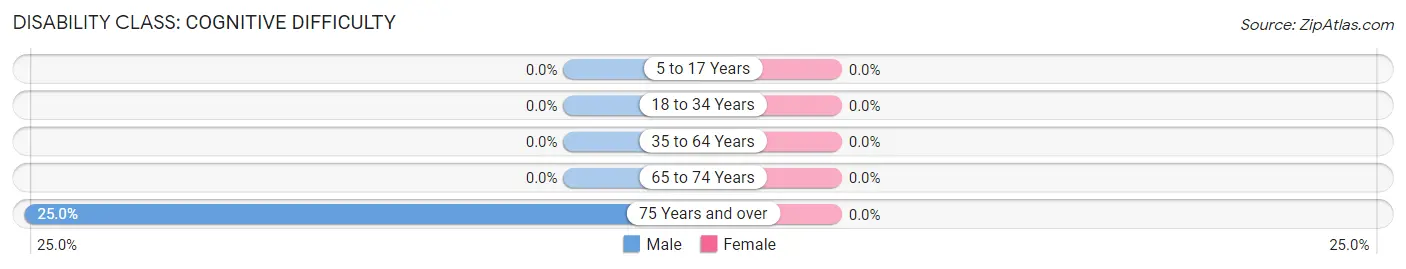
| Age Bracket | Male | Female |
| 5 to 17 Years | 0 (0.0%) | 0 (0.0%) |
| 18 to 34 Years | 0 (0.0%) | 0 (0.0%) |
| 35 to 64 Years | 0 (0.0%) | 0 (0.0%) |
| 65 to 74 Years | 0 (0.0%) | 0 (0.0%) |
| 75 Years and over | 2 (25.0%) | 0 (0.0%) |
Disability Class: Ambulatory Difficulty
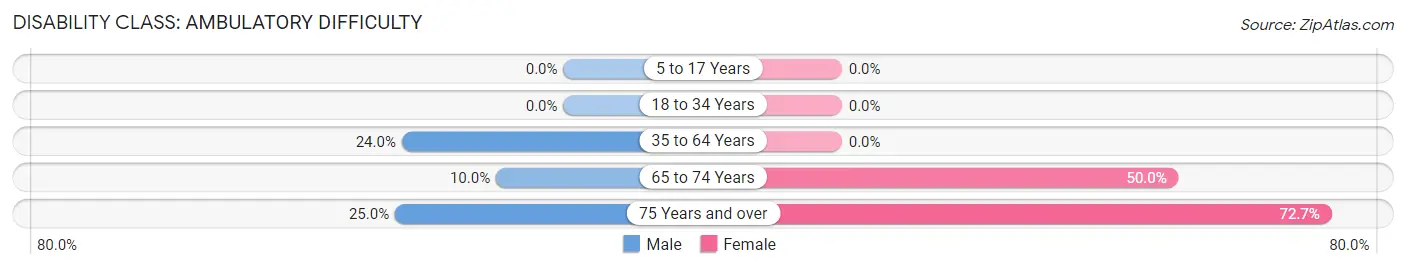
| Age Bracket | Male | Female |
| 5 to 17 Years | 0 (0.0%) | 0 (0.0%) |
| 18 to 34 Years | 0 (0.0%) | 0 (0.0%) |
| 35 to 64 Years | 12 (24.0%) | 0 (0.0%) |
| 65 to 74 Years | 1 (10.0%) | 3 (50.0%) |
| 75 Years and over | 2 (25.0%) | 8 (72.7%) |
Disability Class: Self-Care Difficulty
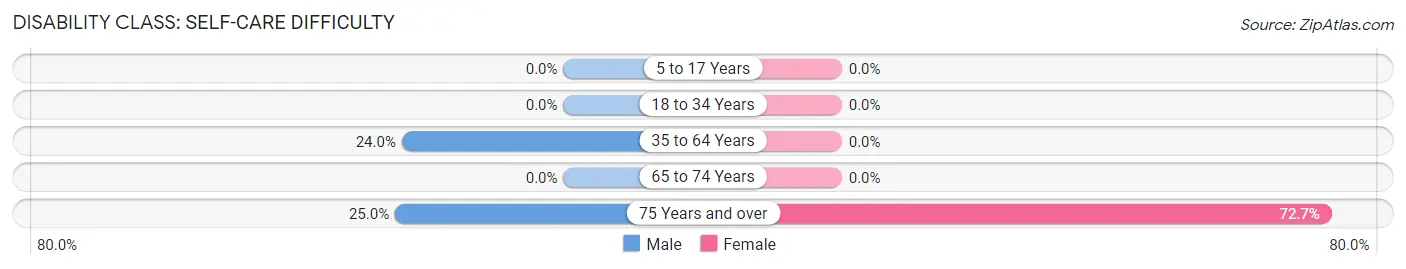
| Age Bracket | Male | Female |
| 5 to 17 Years | 0 (0.0%) | 0 (0.0%) |
| 18 to 34 Years | 0 (0.0%) | 0 (0.0%) |
| 35 to 64 Years | 12 (24.0%) | 0 (0.0%) |
| 65 to 74 Years | 0 (0.0%) | 0 (0.0%) |
| 75 Years and over | 2 (25.0%) | 8 (72.7%) |
Technology Access in North Cleveland
Computing Device Access in North Cleveland
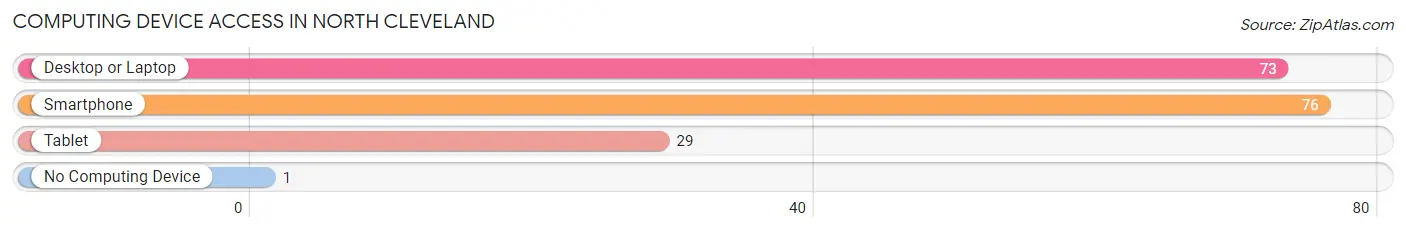
| Device Type | # Households | % Households |
| Desktop or Laptop | 73 | 83.0% |
| Smartphone | 76 | 86.4% |
| Tablet | 29 | 33.0% |
| No Computing Device | 1 | 1.1% |
| Total | 88 | 100.0% |
Internet Access in North Cleveland
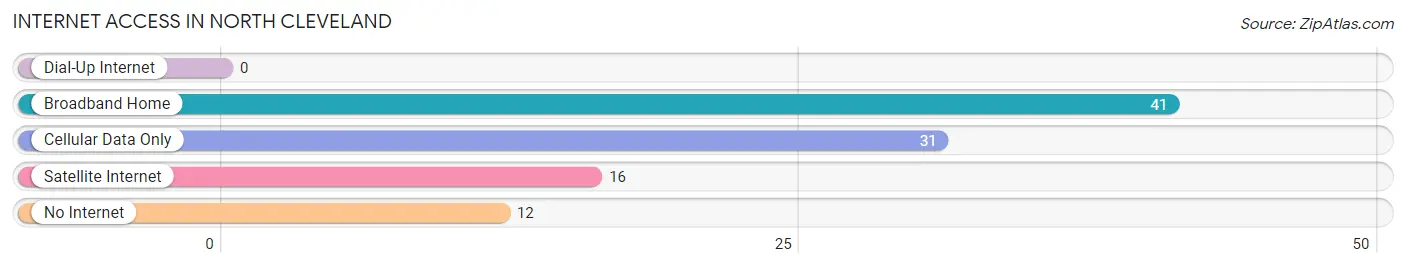
| Internet Type | # Households | % Households |
| Dial-Up Internet | 0 | 0.0% |
| Broadband Home | 41 | 46.6% |
| Cellular Data Only | 31 | 35.2% |
| Satellite Internet | 16 | 18.2% |
| No Internet | 12 | 13.6% |
| Total | 88 | 100.0% |
North Cleveland Summary
Cleveland, Texas is a city located in Liberty County, Texas, United States. The population was 8,715 at the 2010 census. It is the county seat of Liberty County. The city is located in the southeastern part of the county, approximately 40 miles northeast of Houston.
History
The area that is now Cleveland was first settled in the early 1830s by settlers from the United States. The settlement was originally known as "Cleveland's Settlement" after the first settler, John Cleveland. The settlement was later renamed "Cleveland" in 1837.
In 1837, the town was officially incorporated and the first post office was established. The town was named after President Grover Cleveland.
In 1845, the town was chosen as the county seat of Liberty County. The town was then incorporated again in 1858.
In 1871, the Houston and Great Northern Railroad was built through the town, which helped to spur growth. The town was then incorporated again in 1873.
In 1876, the town was chosen as the site of the first county courthouse. The courthouse was completed in 1878.
In 1881, the town was chosen as the site of the first public school in the county. The school was completed in 1883.
In 1884 the town was chosen as the site of the first county jail The jail was completed in 1886
In 1887, the town was chosen as the site of the first county hospital. The hospital was completed in 1889.
In 1895, the town was chosen as the site of the first county fair. The fair was held annually until the early 1900s.
In 1901, the town was chosen as the site of the first county library. The library was completed in 1903.
In 1906, the town was chosen as the site of the first county courthouse. The courthouse was completed in 1908.
In 1910 the town was chosen as the site of the first county jail The jail was completed in 1912
In 1913, the town was chosen as the site of the first county hospital. The hospital was completed in 1915.
In 1920, the town was chosen as the site of the first county fair. The fair was held annually until the early 1940s.
In 1925, the town was chosen as the site of the first county library. The library was completed in 1927.
In 1930, the town was chosen as the site of the first county courthouse. The courthouse was completed in 1932.
In 1935 the town was chosen as the site of the first county jail The jail was completed in 1937
In 1940, the town was chosen as the site of the first county hospital. The hospital was completed in 1942.
In 1945, the town was chosen as the site of the first county fair. The fair was held annually until the early 1960s.
In 1950, the town was chosen as the site of the first county library. The library was completed in 1952.
Geography
Cleveland is located at the intersection of U.S. Highway 59 and State Highway 105, approximately 40 miles northeast of Houston. The city is situated on the banks of the Trinity River.
The city has a total area of 8.3 square miles, of which 8.2 square miles is land and 0.1 square miles is water.
Economy
Cleveland is a major center for the oil and gas industry. The city is home to several major oil and gas companies, including Chevron, ExxonMobil, and Shell.
The city is also home to several manufacturing companies, including a paper mill, a steel mill, and a plastics plant.
The city is also home to several retail stores including Walmart Target and Home Depot
Demographics
As of the 2010 census, there were 8,715 people, 3,072 households, and 2,092 families residing in the city. The population density was 1,053.7 people per square mile. The racial makeup of the city was 68.2% White, 17.3% African American, 0.7% Native American, 0.7% Asian, 0.1% Pacific Islander, 10.7% from other races, and 2.1% from two or more races. Hispanic or Latino of any race were 24.3% of the population.
The median income for a household in the city was $37,917, and the median income for a family was $45,917. The per capita income for the city was $17,917. About 17.3% of families and 20.7% of the population were below the poverty line, including 28.3% of those under age 18 and 14.3% of those age 65 or over.
Common Questions
What is the Total Population of North Cleveland?
Total Population of North Cleveland is 206.
What is the Total Male Population of North Cleveland?
Total Male Population of North Cleveland is 104.
What is the Total Female Population of North Cleveland?
Total Female Population of North Cleveland is 102.
What is the Ratio of Males per 100 Females in North Cleveland?
There are 101.96 Males per 100 Females in North Cleveland.
What is the Ratio of Females per 100 Males in North Cleveland?
There are 98.08 Females per 100 Males in North Cleveland.
What is the Median Population Age in North Cleveland?
Median Population Age in North Cleveland is 42.6 Years.
What is the Average Family Size in North Cleveland
Average Family Size in North Cleveland is 2.4 People.
What is the Average Household Size in North Cleveland
Average Household Size in North Cleveland is 2.3 People.
What is Per Capita Income in North Cleveland?
Per Capita income in North Cleveland is $41,473.
What is the Median Family Income in North Cleveland?
Median Family Income in North Cleveland is $126,250.
What is the Median Household income in North Cleveland?
Median Household Income in North Cleveland is $94,167.
What is Income or Wage Gap in North Cleveland?
Income or Wage Gap in North Cleveland is 62.3%.
Women in North Cleveland earn 37.7 cents for every dollar earned by a man.
What is Inequality or Gini Index in North Cleveland?
Inequality or Gini Index in North Cleveland is 0.40.
How Large is the Labor Force in North Cleveland?
There are 88 People in the Labor Forcein in North Cleveland.
What is the Percentage of People in the Labor Force in North Cleveland?
49.7% of People are in the Labor Force in North Cleveland.
What is the Unemployment Rate in North Cleveland?
Unemployment Rate in North Cleveland is 13.6%.