Terlingua, TX
Terlingua Map
Terlingua Overview
154
TOTAL POPULATION
60
MALE POPULATION
94
FEMALE POPULATION
63.83
MALES / 100 FEMALES
156.67
FEMALES / 100 MALES
61.4
MEDIAN AGE
2.2
AVG FAMILY SIZE
1.4
AVG HOUSEHOLD SIZE
$21,510
PER CAPITA INCOME
$43,088
AVG HOUSEHOLD INCOME
0.30
INEQUALITY / GINI INDEX
68
LABOR FORCE [ PEOPLE ]
63.6%
PERCENT IN LABOR FORCE
14.7%
UNEMPLOYMENT RATE
Terlingua Zip Codes
Terlingua Area Codes
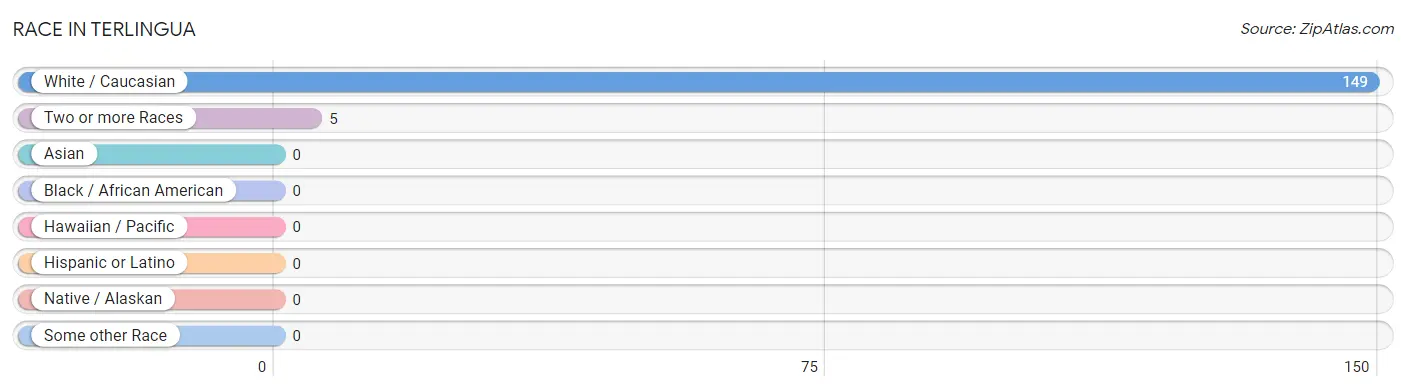
Race in Terlingua
The most populous races in Terlingua are White / Caucasian (149 | 96.8%), and Two or more Races (5 | 3.3%).
| Race | # Population | % Population |
| Asian | 0 | 0.0% |
| Black / African American | 0 | 0.0% |
| Hawaiian / Pacific | 0 | 0.0% |
| Hispanic or Latino | 0 | 0.0% |
| Native / Alaskan | 0 | 0.0% |
| White / Caucasian | 149 | 96.8% |
| Two or more Races | 5 | 3.3% |
| Some other Race | 0 | 0.0% |
| Total | 154 | 100.0% |
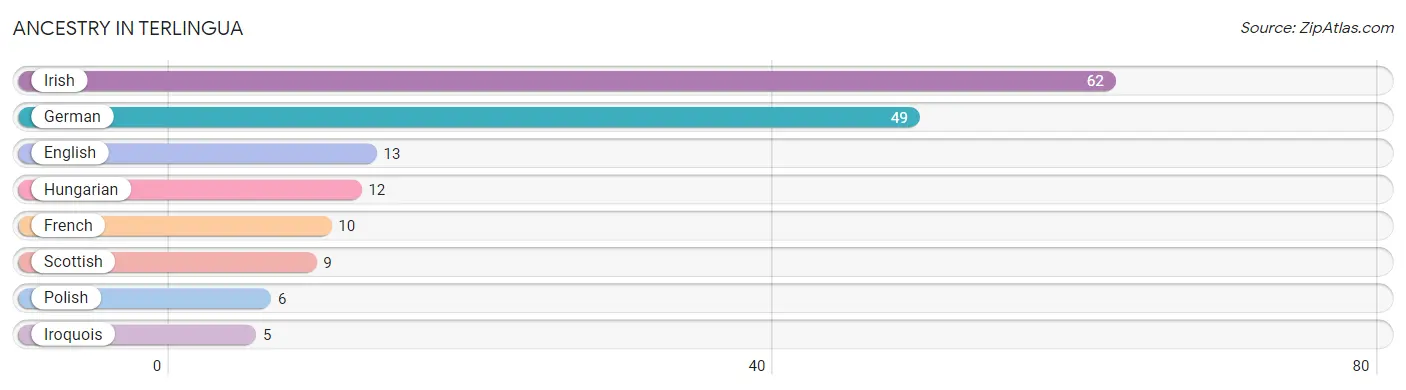
Ancestry in Terlingua
The most populous ancestries reported in Terlingua are Irish (62 | 40.3%), German (49 | 31.8%), English (13 | 8.4%), Hungarian (12 | 7.8%), and French (10 | 6.5%), together accounting for 94.8% of all Terlingua residents.
| Ancestry | # Population | % Population |
| English | 13 | 8.4% |
| French | 10 | 6.5% |
| German | 49 | 31.8% |
| Hungarian | 12 | 7.8% |
| Irish | 62 | 40.3% |
| Iroquois | 5 | 3.3% |
| Polish | 6 | 3.9% |
| Scottish | 9 | 5.8% | View All 8 Rows |
Immigrants in Terlingua

| Immigration Origin | # Population | % Population | View All 0 Rows |
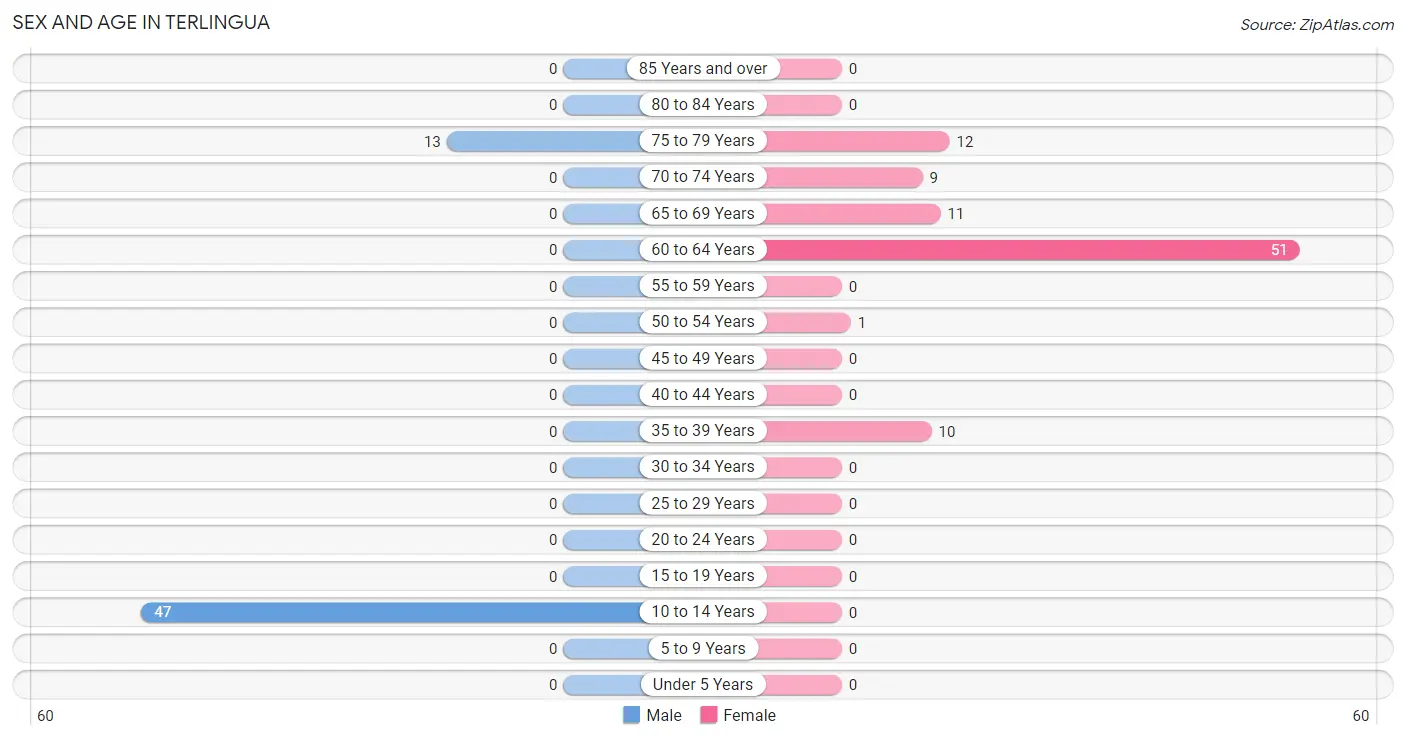
Sex and Age in Terlingua
Sex and Age in Terlingua
The most populous age groups in Terlingua are 10 to 14 Years (47 | 78.3%) for men and 60 to 64 Years (51 | 54.3%) for women.
| Age Bracket | Male | Female |
| Under 5 Years | 0 (0.0%) | 0 (0.0%) |
| 5 to 9 Years | 0 (0.0%) | 0 (0.0%) |
| 10 to 14 Years | 47 (78.3%) | 0 (0.0%) |
| 15 to 19 Years | 0 (0.0%) | 0 (0.0%) |
| 20 to 24 Years | 0 (0.0%) | 0 (0.0%) |
| 25 to 29 Years | 0 (0.0%) | 0 (0.0%) |
| 30 to 34 Years | 0 (0.0%) | 0 (0.0%) |
| 35 to 39 Years | 0 (0.0%) | 10 (10.6%) |
| 40 to 44 Years | 0 (0.0%) | 0 (0.0%) |
| 45 to 49 Years | 0 (0.0%) | 0 (0.0%) |
| 50 to 54 Years | 0 (0.0%) | 1 (1.1%) |
| 55 to 59 Years | 0 (0.0%) | 0 (0.0%) |
| 60 to 64 Years | 0 (0.0%) | 51 (54.3%) |
| 65 to 69 Years | 0 (0.0%) | 11 (11.7%) |
| 70 to 74 Years | 0 (0.0%) | 9 (9.6%) |
| 75 to 79 Years | 13 (21.7%) | 12 (12.8%) |
| 80 to 84 Years | 0 (0.0%) | 0 (0.0%) |
| 85 Years and over | 0 (0.0%) | 0 (0.0%) |
| Total | 60 (100.0%) | 94 (100.0%) |
Families and Households in Terlingua
Median Family Size in Terlingua
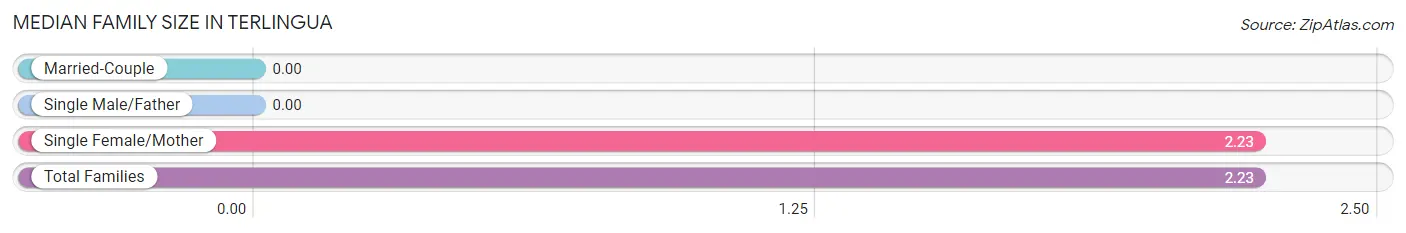
| Family Type | # Families | Family Size |
| Married-Couple | 0 (0.0%) | - |
| Single Male/Father | 0 (0.0%) | - |
| Single Female/Mother | 39 (100.0%) | 2.23 |
| Total Families | 39 (100.0%) | 2.23 |
Median Household Size in Terlingua
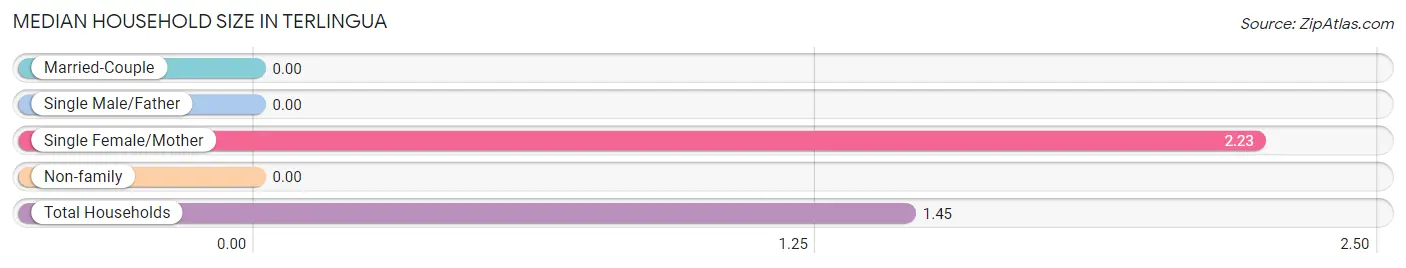
| Household Type | # Households | Household Size |
| Married-Couple | 0 (0.0%) | - |
| Single Male/Father | 0 (0.0%) | - |
| Single Female/Mother | 39 (36.8%) | 2.23 |
| Non-family | 67 (63.2%) | - |
| Total Households | 106 (100.0%) | 1.45 |
Household Size by Marriage Status in Terlingua
Out of a total of 106 households in Terlingua, 39 (36.8%) are family households, while 67 (63.2%) are nonfamily households. The most numerous type of family households are 2-person households, comprising 39, and the most common type of nonfamily households are 1-person households, comprising 67.
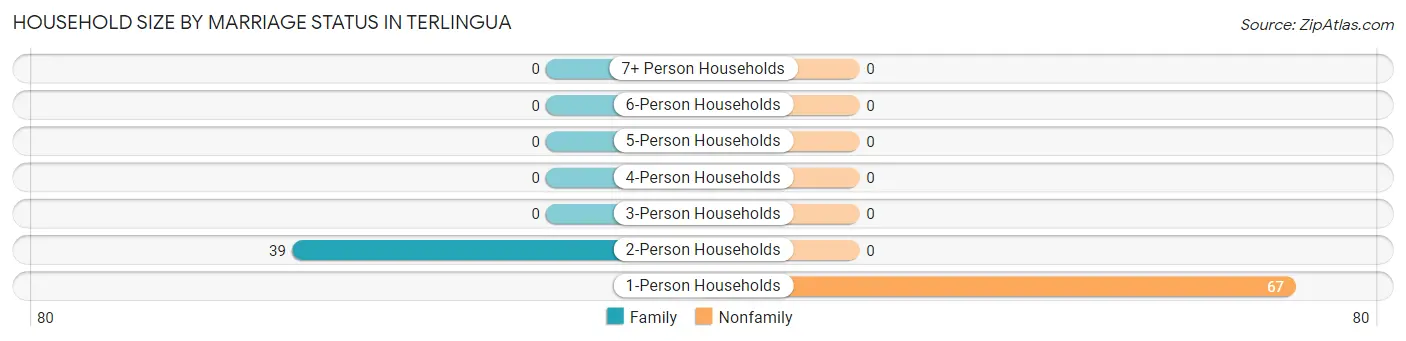
| Household Size | Family Households | Nonfamily Households |
| 1-Person Households | - | 67 (63.2%) |
| 2-Person Households | 39 (36.8%) | 0 (0.0%) |
| 3-Person Households | 0 (0.0%) | 0 (0.0%) |
| 4-Person Households | 0 (0.0%) | 0 (0.0%) |
| 5-Person Households | 0 (0.0%) | 0 (0.0%) |
| 6-Person Households | 0 (0.0%) | 0 (0.0%) |
| 7+ Person Households | 0 (0.0%) | 0 (0.0%) |
| Total | 39 (36.8%) | 67 (63.2%) |
Female Fertility in Terlingua
Fertility by Age in Terlingua
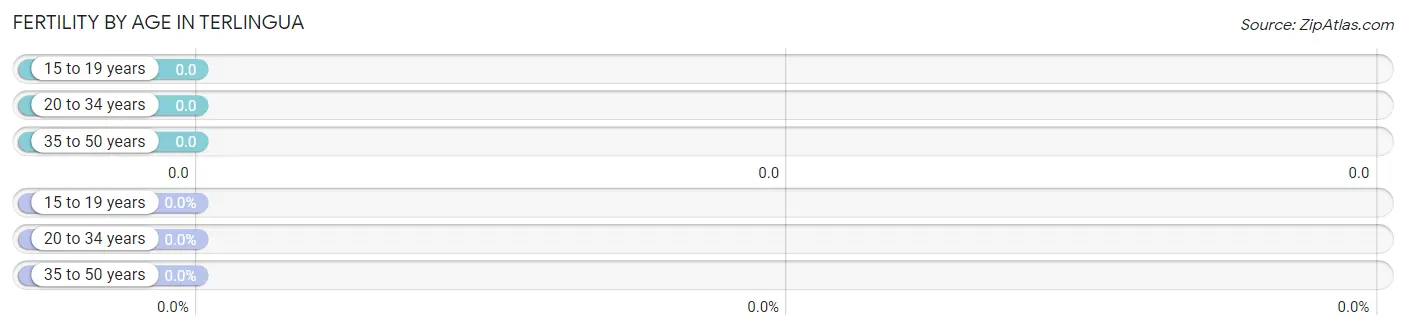
| Age Bracket | Women with Births | Births / 1,000 Women |
| 15 to 19 years | 0 (0.0%) | 0.0 |
| 20 to 34 years | 0 (0.0%) | 0.0 |
| 35 to 50 years | 0 (0.0%) | 0.0 |
| Total | 0 (0.0%) | 0.0 |
Fertility by Age by Marriage Status in Terlingua
| Age Bracket | Married | Unmarried |
| 15 to 19 years | 0 (0.0%) | 0 (0.0%) |
| 20 to 34 years | 0 (0.0%) | 0 (0.0%) |
| 35 to 50 years | 0 (0.0%) | 0 (0.0%) |
| Total | 0 (0.0%) | 0 (0.0%) |
Fertility by Education in Terlingua
| Educational Attainment | Women with Births | Births / 1,000 Women |
| Less than High School | 0 (0.0%) | 0.0 |
| High School Diploma | 0 (0.0%) | 0.0 |
| College or Associate's Degree | 0 (0.0%) | 0.0 |
| Bachelor's Degree | 0 (0.0%) | 0.0 |
| Graduate Degree | 0 (0.0%) | 0.0 |
| Total | 0 (0.0%) | 0.0 |
Fertility by Education by Marriage Status in Terlingua
| Educational Attainment | Married | Unmarried |
| Less than High School | 0 (0.0%) | 0 (0.0%) |
| High School Diploma | 0 (0.0%) | 0 (0.0%) |
| College or Associate's Degree | 0 (0.0%) | 0 (0.0%) |
| Bachelor's Degree | 0 (0.0%) | 0 (0.0%) |
| Graduate Degree | 0 (0.0%) | 0 (0.0%) |
| Total | 0 (0.0%) | 0 (0.0%) |
Income in Terlingua
Income Overview in Terlingua
| Characteristic | Number | Measure |
| Per Capita Income | 154 | $21,510 |
| Median Family Income | 39 | $0 |
| Mean Family Income | 39 | $0 |
| Median Household Income | 106 | $43,088 |
| Mean Household Income | 106 | $32,036 |
| Income Deficit | 39 | $0 |
| Wage / Income Gap (%) | 154 | 0.00% |
| Wage / Income Gap ($) | 154 | 100.00¢ per $1 |
| Gini / Inequality Index | 154 | 0.30 |
Earnings by Sex in Terlingua
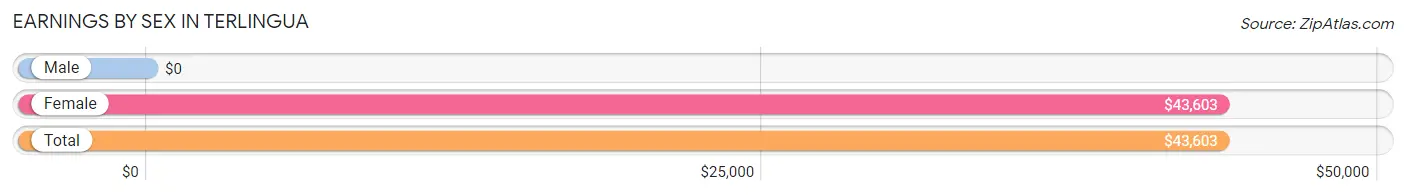
| Sex | Number | Average Earnings |
| Male | 0 (0.0%) | $0 |
| Female | 68 (100.0%) | $43,603 |
| Total | 68 (100.0%) | $43,603 |
Earnings by Sex by Income Bracket in Terlingua
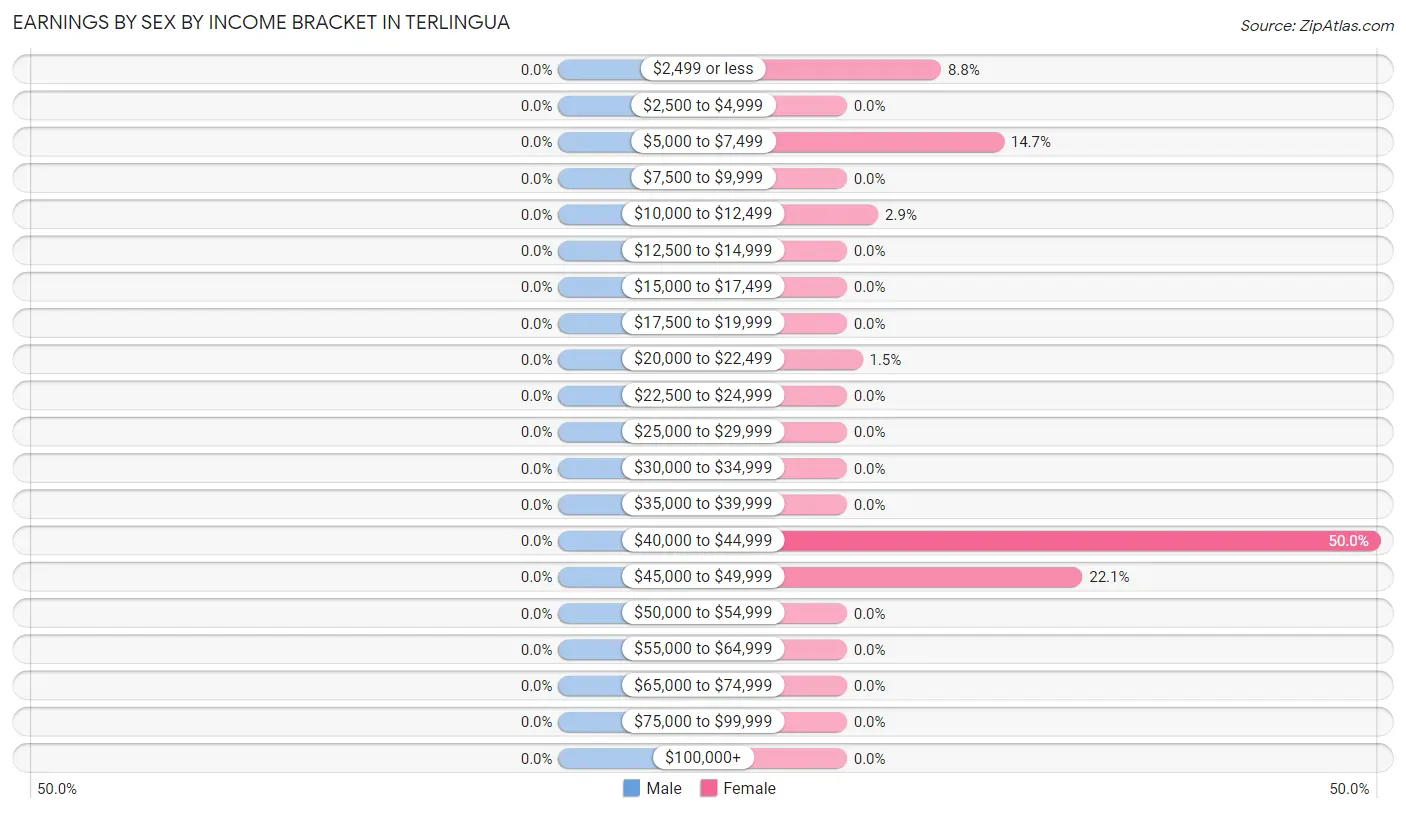
| Income | Male | Female |
| $2,499 or less | 0 (0.0%) | 6 (8.8%) |
| $2,500 to $4,999 | 0 (0.0%) | 0 (0.0%) |
| $5,000 to $7,499 | 0 (0.0%) | 10 (14.7%) |
| $7,500 to $9,999 | 0 (0.0%) | 0 (0.0%) |
| $10,000 to $12,499 | 0 (0.0%) | 2 (2.9%) |
| $12,500 to $14,999 | 0 (0.0%) | 0 (0.0%) |
| $15,000 to $17,499 | 0 (0.0%) | 0 (0.0%) |
| $17,500 to $19,999 | 0 (0.0%) | 0 (0.0%) |
| $20,000 to $22,499 | 0 (0.0%) | 1 (1.5%) |
| $22,500 to $24,999 | 0 (0.0%) | 0 (0.0%) |
| $25,000 to $29,999 | 0 (0.0%) | 0 (0.0%) |
| $30,000 to $34,999 | 0 (0.0%) | 0 (0.0%) |
| $35,000 to $39,999 | 0 (0.0%) | 0 (0.0%) |
| $40,000 to $44,999 | 0 (0.0%) | 34 (50.0%) |
| $45,000 to $49,999 | 0 (0.0%) | 15 (22.1%) |
| $50,000 to $54,999 | 0 (0.0%) | 0 (0.0%) |
| $55,000 to $64,999 | 0 (0.0%) | 0 (0.0%) |
| $65,000 to $74,999 | 0 (0.0%) | 0 (0.0%) |
| $75,000 to $99,999 | 0 (0.0%) | 0 (0.0%) |
| $100,000+ | 0 (0.0%) | 0 (0.0%) |
| Total | 0 (0.0%) | 68 (100.0%) |
Earnings by Sex by Educational Attainment in Terlingua
| Educational Attainment | Male Income | Female Income |
| Less than High School | - | - |
| High School Diploma | - | - |
| College or Associate's Degree | - | - |
| Bachelor's Degree | - | - |
| Graduate Degree | - | - |
| Total | - | - |
Family Income in Terlingua
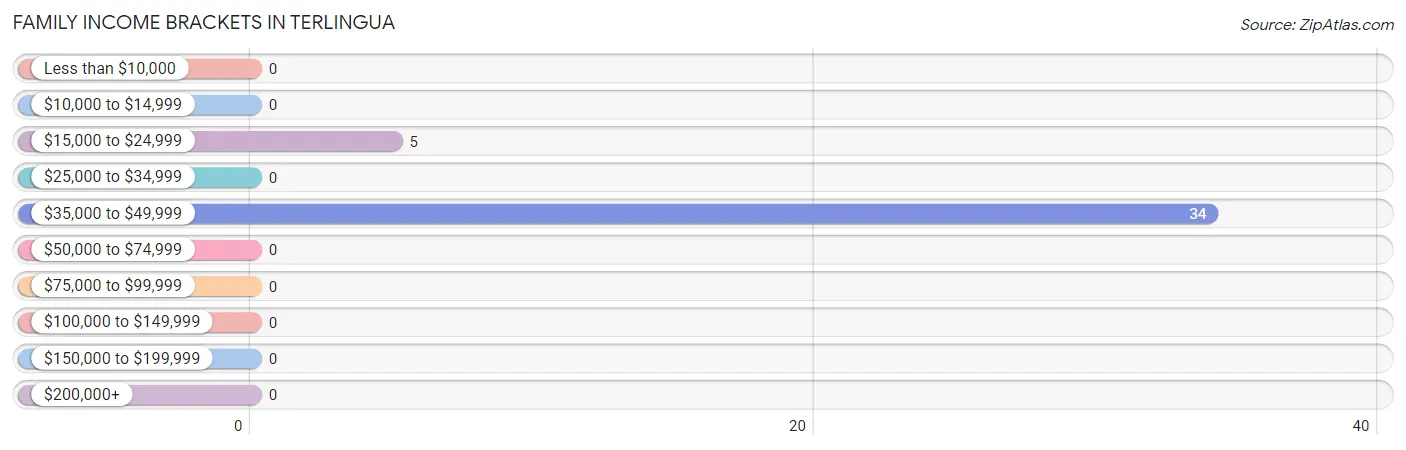
Family Income Brackets in Terlingua
According to the Terlingua family income data, there are 34 families falling into the $35,000 to $49,999 income range, which is the most common income bracket and makes up 87.2% of all families.
| Income Bracket | # Families | % Families |
| Less than $10,000 | 0 | 0.0% |
| $10,000 to $14,999 | 0 | 0.0% |
| $15,000 to $24,999 | 5 | 12.8% |
| $25,000 to $34,999 | 0 | 0.0% |
| $35,000 to $49,999 | 34 | 87.2% |
| $50,000 to $74,999 | 0 | 0.0% |
| $75,000 to $99,999 | 0 | 0.0% |
| $100,000 to $149,999 | 0 | 0.0% |
| $150,000 to $199,999 | 0 | 0.0% |
| $200,000+ | 0 | 0.0% |
Family Income by Famaliy Size in Terlingua
| Income Bracket | # Families | Median Income |
| 2-Person Families | 39 (100.0%) | $0 |
| 3-Person Families | 0 (0.0%) | $0 |
| 4-Person Families | 0 (0.0%) | $0 |
| 5-Person Families | 0 (0.0%) | $0 |
| 6-Person Families | 0 (0.0%) | $0 |
| 7+ Person Families | 0 (0.0%) | $0 |
| Total | 39 (100.0%) | $0 |
Family Income by Number of Earners in Terlingua
| Number of Earners | # Families | Median Income |
| No Earners | 0 (0.0%) | $0 |
| 1 Earner | 39 (100.0%) | $0 |
| 2 Earners | 0 (0.0%) | $0 |
| 3+ Earners | 0 (0.0%) | $0 |
| Total | 39 (100.0%) | $0 |
Household Income in Terlingua
Household Income Brackets in Terlingua
With 49 households falling in the category, the $35,000 to $49,999 income range is the most frequent in Terlingua, accounting for 46.2% of all households.
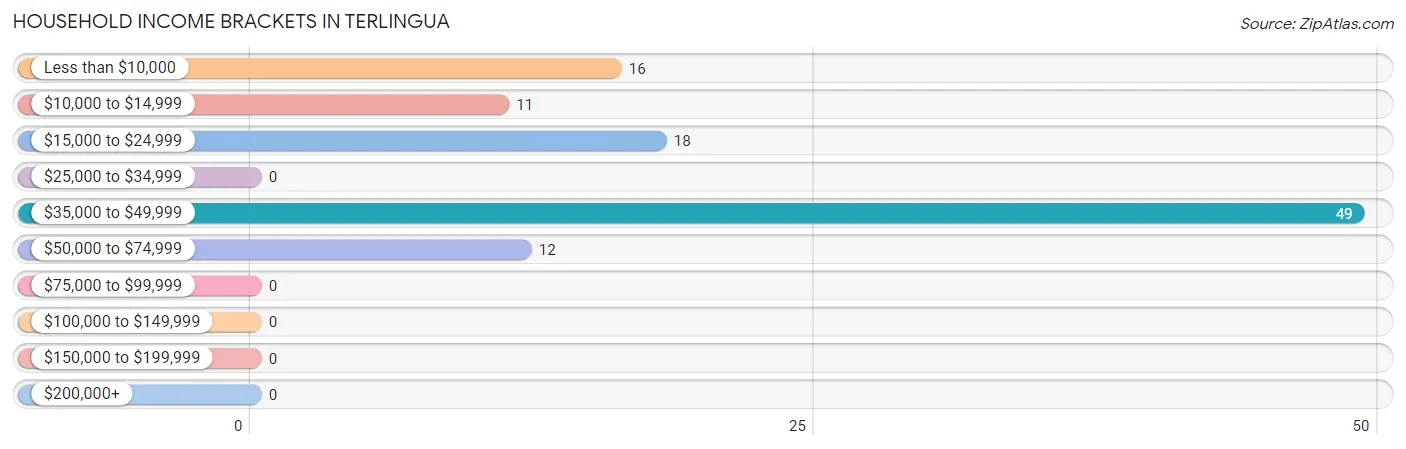
| Income Bracket | # Households | % Households |
| Less than $10,000 | 16 | 15.1% |
| $10,000 to $14,999 | 11 | 10.4% |
| $15,000 to $24,999 | 18 | 17.0% |
| $25,000 to $34,999 | 0 | 0.0% |
| $35,000 to $49,999 | 49 | 46.2% |
| $50,000 to $74,999 | 12 | 11.3% |
| $75,000 to $99,999 | 0 | 0.0% |
| $100,000 to $149,999 | 0 | 0.0% |
| $150,000 to $199,999 | 0 | 0.0% |
| $200,000+ | 0 | 0.0% |
Household Income by Householder Age in Terlingua
The median household income in Terlingua is $43,088, with the highest median household income of $44,228 found in the 45 to 64 years age bracket for the primary householder. A total of 51 households (48.1%) fall into this category.
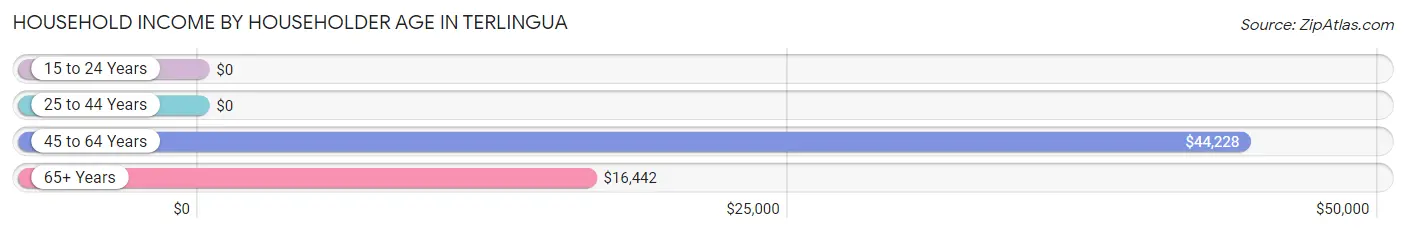
| Income Bracket | # Households | Median Income |
| 15 to 24 Years | 0 (0.0%) | $0 |
| 25 to 44 Years | 10 (9.4%) | $0 |
| 45 to 64 Years | 51 (48.1%) | $44,228 |
| 65+ Years | 45 (42.4%) | $16,442 |
| Total | 106 (100.0%) | $43,088 |
Poverty in Terlingua
Income Below Poverty by Sex and Age in Terlingua
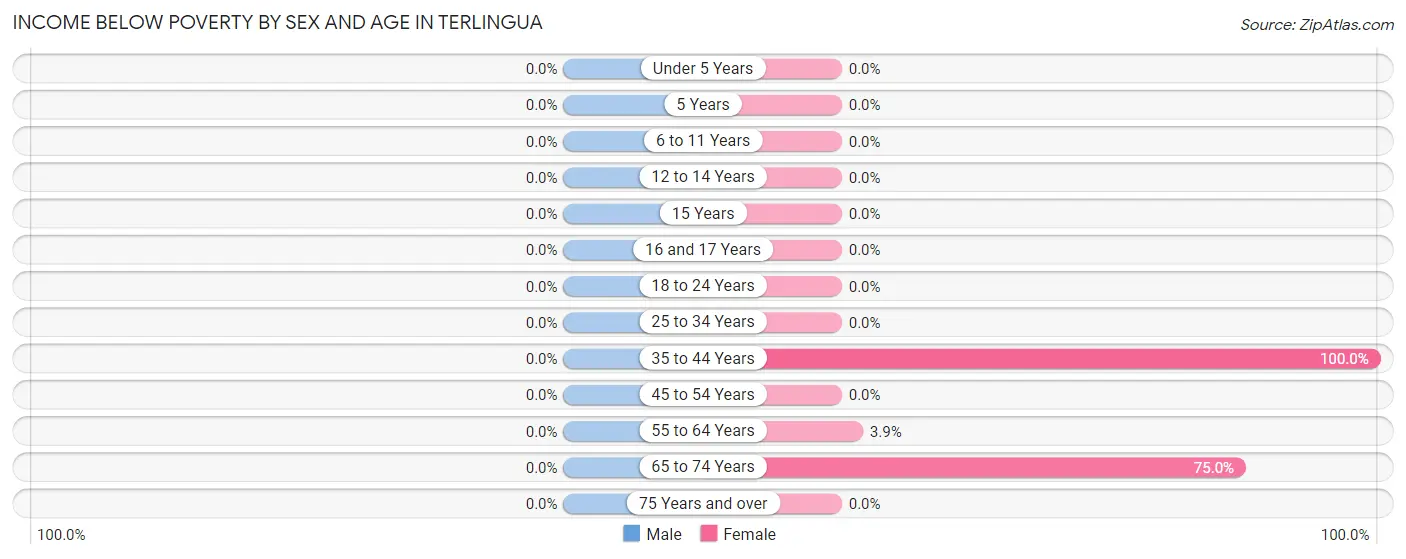
| Age Bracket | Male | Female |
| Under 5 Years | 0 (0.0%) | 0 (0.0%) |
| 5 Years | 0 (0.0%) | 0 (0.0%) |
| 6 to 11 Years | 0 (0.0%) | 0 (0.0%) |
| 12 to 14 Years | 0 (0.0%) | 0 (0.0%) |
| 15 Years | 0 (0.0%) | 0 (0.0%) |
| 16 and 17 Years | 0 (0.0%) | 0 (0.0%) |
| 18 to 24 Years | 0 (0.0%) | 0 (0.0%) |
| 25 to 34 Years | 0 (0.0%) | 0 (0.0%) |
| 35 to 44 Years | 0 (0.0%) | 10 (100.0%) |
| 45 to 54 Years | 0 (0.0%) | 0 (0.0%) |
| 55 to 64 Years | 0 (0.0%) | 2 (3.9%) |
| 65 to 74 Years | 0 (0.0%) | 15 (75.0%) |
| 75 Years and over | 0 (0.0%) | 0 (0.0%) |
| Total | 0 (0.0%) | 27 (28.7%) |
Income Above Poverty by Sex and Age in Terlingua
According to the poverty statistics in Terlingua, males aged 12 to 14 years and females aged 45 to 54 years are the age groups that are most secure financially, with 100.0% of males and 100.0% of females in these age groups living above the poverty line.
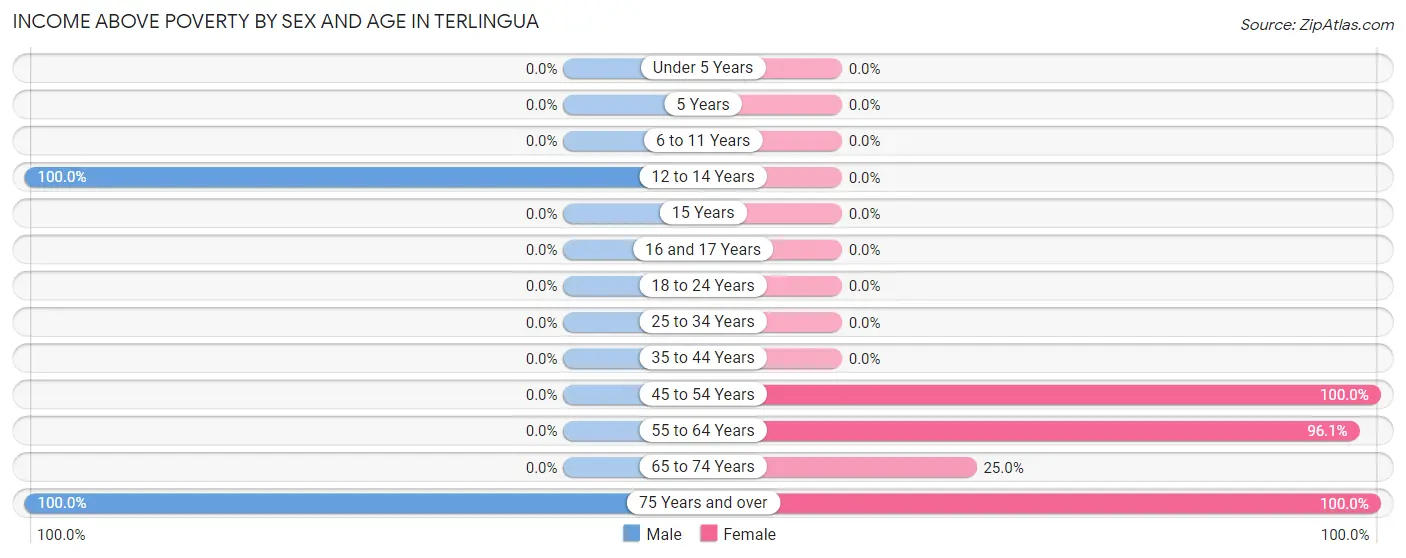
| Age Bracket | Male | Female |
| Under 5 Years | 0 (0.0%) | 0 (0.0%) |
| 5 Years | 0 (0.0%) | 0 (0.0%) |
| 6 to 11 Years | 0 (0.0%) | 0 (0.0%) |
| 12 to 14 Years | 47 (100.0%) | 0 (0.0%) |
| 15 Years | 0 (0.0%) | 0 (0.0%) |
| 16 and 17 Years | 0 (0.0%) | 0 (0.0%) |
| 18 to 24 Years | 0 (0.0%) | 0 (0.0%) |
| 25 to 34 Years | 0 (0.0%) | 0 (0.0%) |
| 35 to 44 Years | 0 (0.0%) | 0 (0.0%) |
| 45 to 54 Years | 0 (0.0%) | 1 (100.0%) |
| 55 to 64 Years | 0 (0.0%) | 49 (96.1%) |
| 65 to 74 Years | 0 (0.0%) | 5 (25.0%) |
| 75 Years and over | 13 (100.0%) | 12 (100.0%) |
| Total | 60 (100.0%) | 67 (71.3%) |
Income Below Poverty Among Married-Couple Families in Terlingua
| Children | Above Poverty | Below Poverty |
| No Children | 0 (0.0%) | 0 (0.0%) |
| 1 or 2 Children | 0 (0.0%) | 0 (0.0%) |
| 3 or 4 Children | 0 (0.0%) | 0 (0.0%) |
| 5 or more Children | 0 (0.0%) | 0 (0.0%) |
| Total | 0 (0.0%) | 0 (0.0%) |
Income Below Poverty Among Single-Parent Households in Terlingua
| Children | Single Father | Single Mother |
| No Children | 0 (0.0%) | 0 (0.0%) |
| 1 or 2 Children | 0 (0.0%) | 0 (0.0%) |
| 3 or 4 Children | 0 (0.0%) | 0 (0.0%) |
| 5 or more Children | 0 (0.0%) | 0 (0.0%) |
| Total | 0 (0.0%) | 0 (0.0%) |
Income Below Poverty Among Married-Couple vs Single-Parent Households in Terlingua
| Children | Married-Couple Families | Single-Parent Households |
| No Children | 0 (0.0%) | 0 (0.0%) |
| 1 or 2 Children | 0 (0.0%) | 0 (0.0%) |
| 3 or 4 Children | 0 (0.0%) | 0 (0.0%) |
| 5 or more Children | 0 (0.0%) | 0 (0.0%) |
| Total | 0 (0.0%) | 0 (0.0%) |
Employment Characteristics in Terlingua
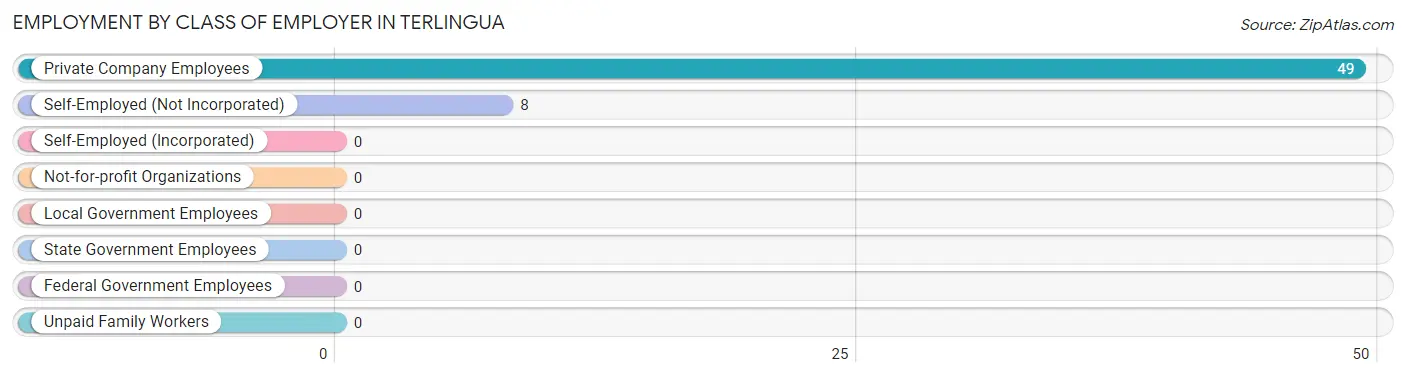
Employment by Class of Employer in Terlingua
Among the 57 employed individuals in Terlingua, private company employees (49 | 86.0%), and self-employed (not incorporated) (8 | 14.0%) make up the most common classes of employment.
| Employer Class | # Employees | % Employees |
| Private Company Employees | 49 | 86.0% |
| Self-Employed (Incorporated) | 0 | 0.0% |
| Self-Employed (Not Incorporated) | 8 | 14.0% |
| Not-for-profit Organizations | 0 | 0.0% |
| Local Government Employees | 0 | 0.0% |
| State Government Employees | 0 | 0.0% |
| Federal Government Employees | 0 | 0.0% |
| Unpaid Family Workers | 0 | 0.0% |
| Total | 57 | 100.0% |
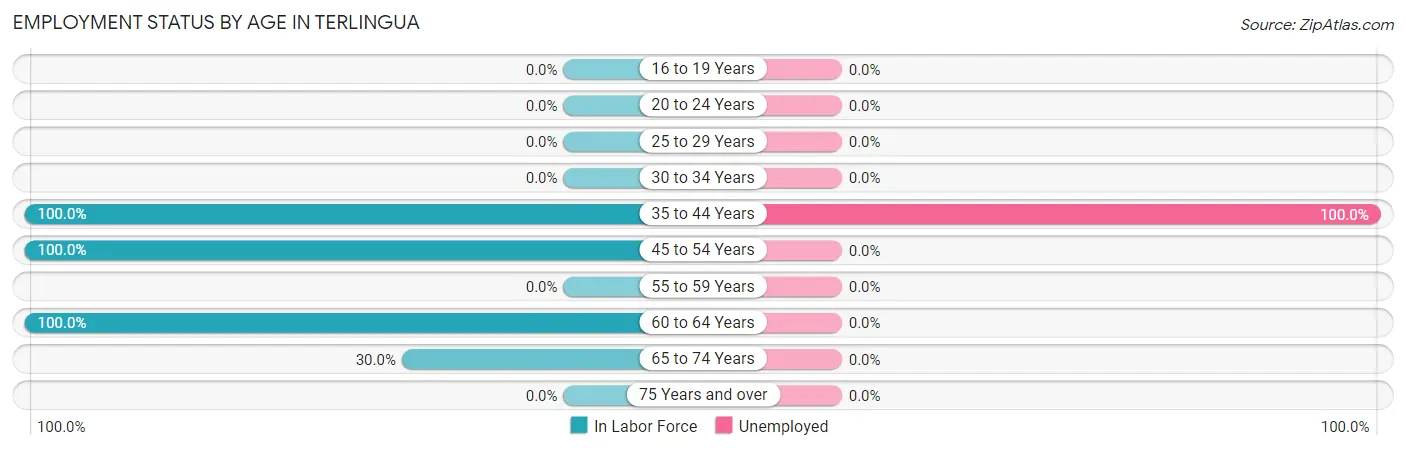
Employment Status by Age in Terlingua
According to the labor force statistics for Terlingua, out of the total population over 16 years of age (107), 63.6% or 68 individuals are in the labor force, with 14.7% or 10 of them unemployed. The age group with the highest labor force participation rate is 35 to 44 years, with 100.0% or 10 individuals in the labor force. Within the labor force, the 35 to 44 years age range has the highest percentage of unemployed individuals, with 100.0% or 10 of them being unemployed.
| Age Bracket | In Labor Force | Unemployed |
| 16 to 19 Years | 0 (0.0%) | 0 (0.0%) |
| 20 to 24 Years | 0 (0.0%) | 0 (0.0%) |
| 25 to 29 Years | 0 (0.0%) | 0 (0.0%) |
| 30 to 34 Years | 0 (0.0%) | 0 (0.0%) |
| 35 to 44 Years | 10 (100.0%) | 10 (100.0%) |
| 45 to 54 Years | 1 (100.0%) | 0 (0.0%) |
| 55 to 59 Years | 0 (0.0%) | 0 (0.0%) |
| 60 to 64 Years | 51 (100.0%) | 0 (0.0%) |
| 65 to 74 Years | 6 (30.0%) | 0 (0.0%) |
| 75 Years and over | 0 (0.0%) | 0 (0.0%) |
| Total | 68 (63.6%) | 10 (14.7%) |
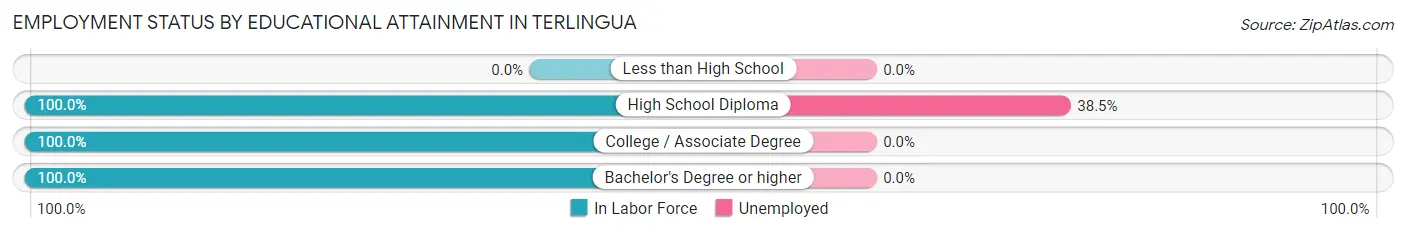
Employment Status by Educational Attainment in Terlingua
According to labor force statistics for Terlingua, 100.0% of individuals (62) out of the total population between 25 and 64 years of age (62) are in the labor force, with 16.1% or 10 of them being unemployed. The group with the highest labor force participation rate are those with the educational attainment of high school diploma, with 100.0% or 26 individuals in the labor force. Within the labor force, individuals with high school diploma education have the highest percentage of unemployment, with 38.5% or 10 of them being unemployed.
| Educational Attainment | In Labor Force | Unemployed |
| Less than High School | 0 (0.0%) | 0 (0.0%) |
| High School Diploma | 26 (100.0%) | 10 (38.5%) |
| College / Associate Degree | 34 (100.0%) | 0 (0.0%) |
| Bachelor's Degree or higher | 2 (100.0%) | 0 (0.0%) |
| Total | 62 (100.0%) | 10 (16.1%) |
Employment Occupations by Sex in Terlingua
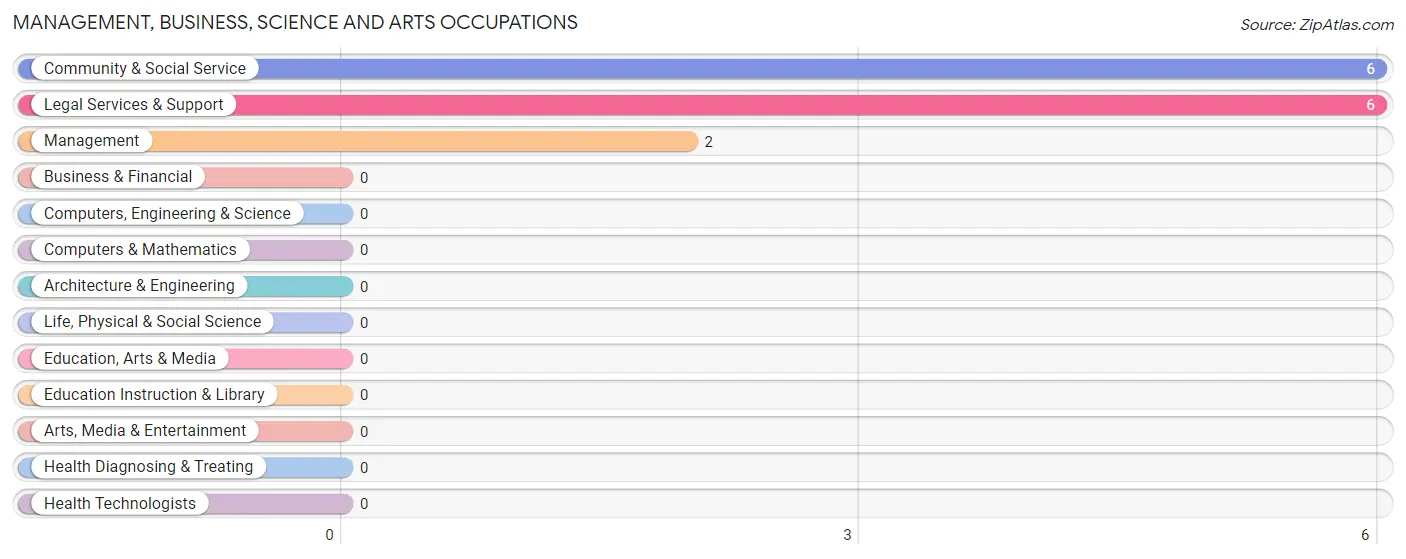
Management, Business, Science and Arts Occupations
The most common Management, Business, Science and Arts occupations in Terlingua are Community & Social Service (6 | 10.3%), Legal Services & Support (6 | 10.3%), and Management (2 | 3.5%).
Management, Business, Science and Arts Occupations by Sex
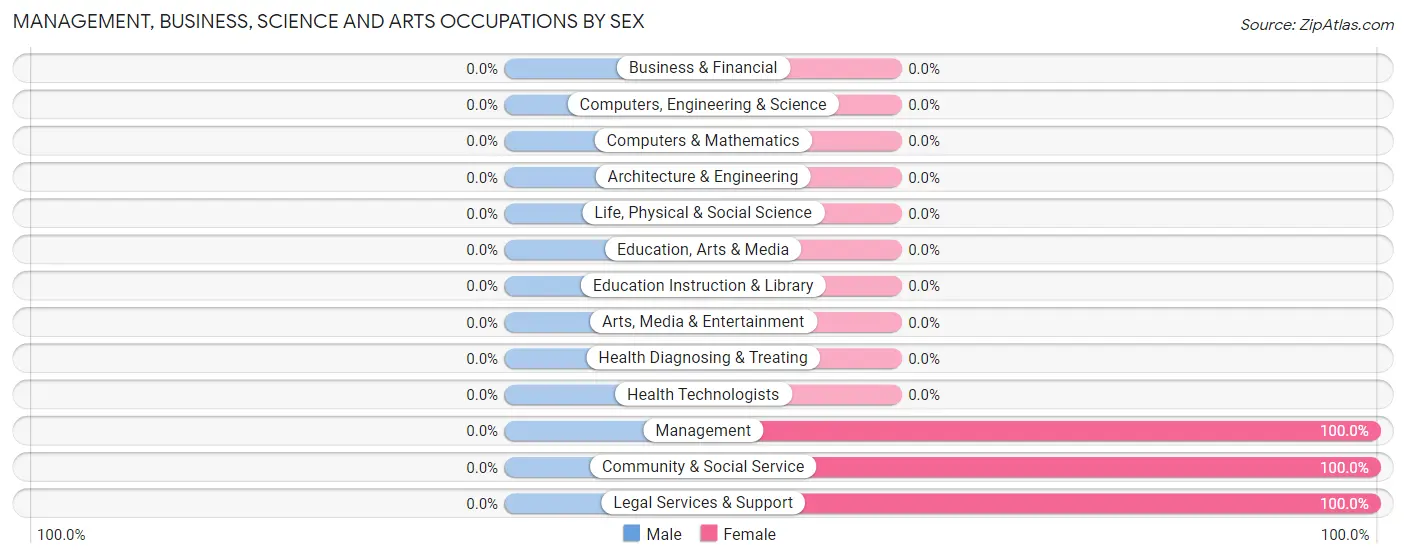
| Occupation | Male | Female |
| Management | 0 (0.0%) | 2 (100.0%) |
| Business & Financial | 0 (0.0%) | 0 (0.0%) |
| Computers, Engineering & Science | 0 (0.0%) | 0 (0.0%) |
| Computers & Mathematics | 0 (0.0%) | 0 (0.0%) |
| Architecture & Engineering | 0 (0.0%) | 0 (0.0%) |
| Life, Physical & Social Science | 0 (0.0%) | 0 (0.0%) |
| Community & Social Service | 0 (0.0%) | 6 (100.0%) |
| Education, Arts & Media | 0 (0.0%) | 0 (0.0%) |
| Legal Services & Support | 0 (0.0%) | 6 (100.0%) |
| Education Instruction & Library | 0 (0.0%) | 0 (0.0%) |
| Arts, Media & Entertainment | 0 (0.0%) | 0 (0.0%) |
| Health Diagnosing & Treating | 0 (0.0%) | 0 (0.0%) |
| Health Technologists | 0 (0.0%) | 0 (0.0%) |
| Total (Category) | 0 (0.0%) | 8 (100.0%) |
| Total (Overall) | 0 (0.0%) | 58 (100.0%) |
Services Occupations
The most common Services occupations in Terlingua are , and Food Preparation & Serving (1 | 1.7%).
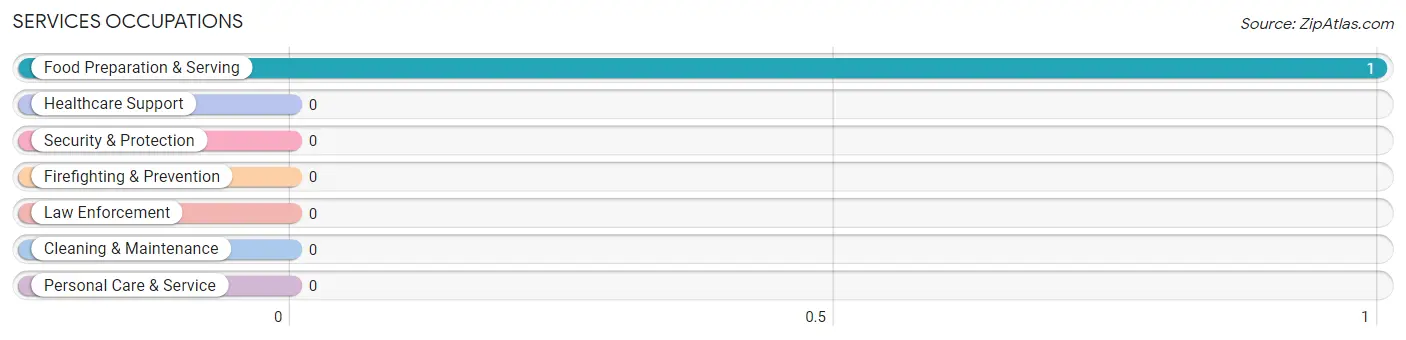
Services Occupations by Sex
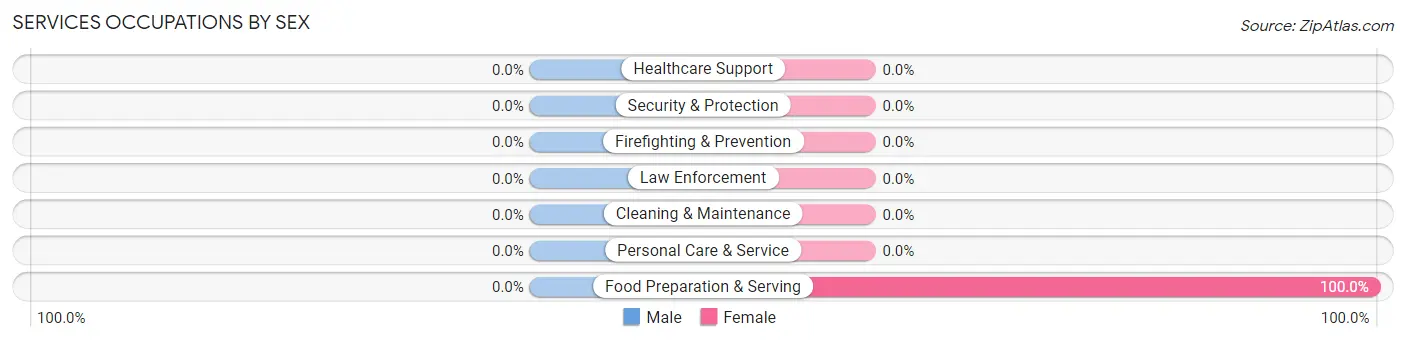
| Occupation | Male | Female |
| Healthcare Support | 0 (0.0%) | 0 (0.0%) |
| Security & Protection | 0 (0.0%) | 0 (0.0%) |
| Firefighting & Prevention | 0 (0.0%) | 0 (0.0%) |
| Law Enforcement | 0 (0.0%) | 0 (0.0%) |
| Food Preparation & Serving | 0 (0.0%) | 1 (100.0%) |
| Cleaning & Maintenance | 0 (0.0%) | 0 (0.0%) |
| Personal Care & Service | 0 (0.0%) | 0 (0.0%) |
| Total (Category) | 0 (0.0%) | 1 (100.0%) |
| Total (Overall) | 0 (0.0%) | 58 (100.0%) |
Sales and Office Occupations
The most common Sales and Office occupations in Terlingua are Office & Administration (34 | 58.6%), and Sales & Related (15 | 25.9%).

Sales and Office Occupations by Sex

| Occupation | Male | Female |
| Sales & Related | 0 (0.0%) | 15 (100.0%) |
| Office & Administration | 0 (0.0%) | 34 (100.0%) |
| Total (Category) | 0 (0.0%) | 49 (100.0%) |
| Total (Overall) | 0 (0.0%) | 58 (100.0%) |
Natural Resources, Construction and Maintenance Occupations
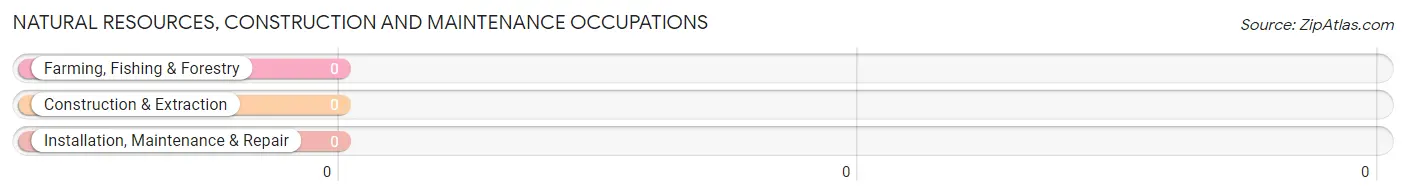
Natural Resources, Construction and Maintenance Occupations by Sex
| Occupation | Male | Female |
| Farming, Fishing & Forestry | 0 (0.0%) | 0 (0.0%) |
| Construction & Extraction | 0 (0.0%) | 0 (0.0%) |
| Installation, Maintenance & Repair | 0 (0.0%) | 0 (0.0%) |
| Total (Category) | 0 (0.0%) | 0 (0.0%) |
| Total (Overall) | 0 (0.0%) | 58 (100.0%) |
Production, Transportation and Moving Occupations
Production, Transportation and Moving Occupations by Sex
| Occupation | Male | Female |
| Production | 0 (0.0%) | 0 (0.0%) |
| Transportation | 0 (0.0%) | 0 (0.0%) |
| Material Moving | 0 (0.0%) | 0 (0.0%) |
| Total (Category) | 0 (0.0%) | 0 (0.0%) |
| Total (Overall) | 0 (0.0%) | 58 (100.0%) |
Employment Industries by Sex in Terlingua
Employment Industries in Terlingua
The major employment industries in Terlingua include Finance & Insurance (34 | 58.6%), Retail Trade (15 | 25.9%), Professional & Scientific (6 | 10.3%), and Accommodation & Food Services (3 | 5.2%).
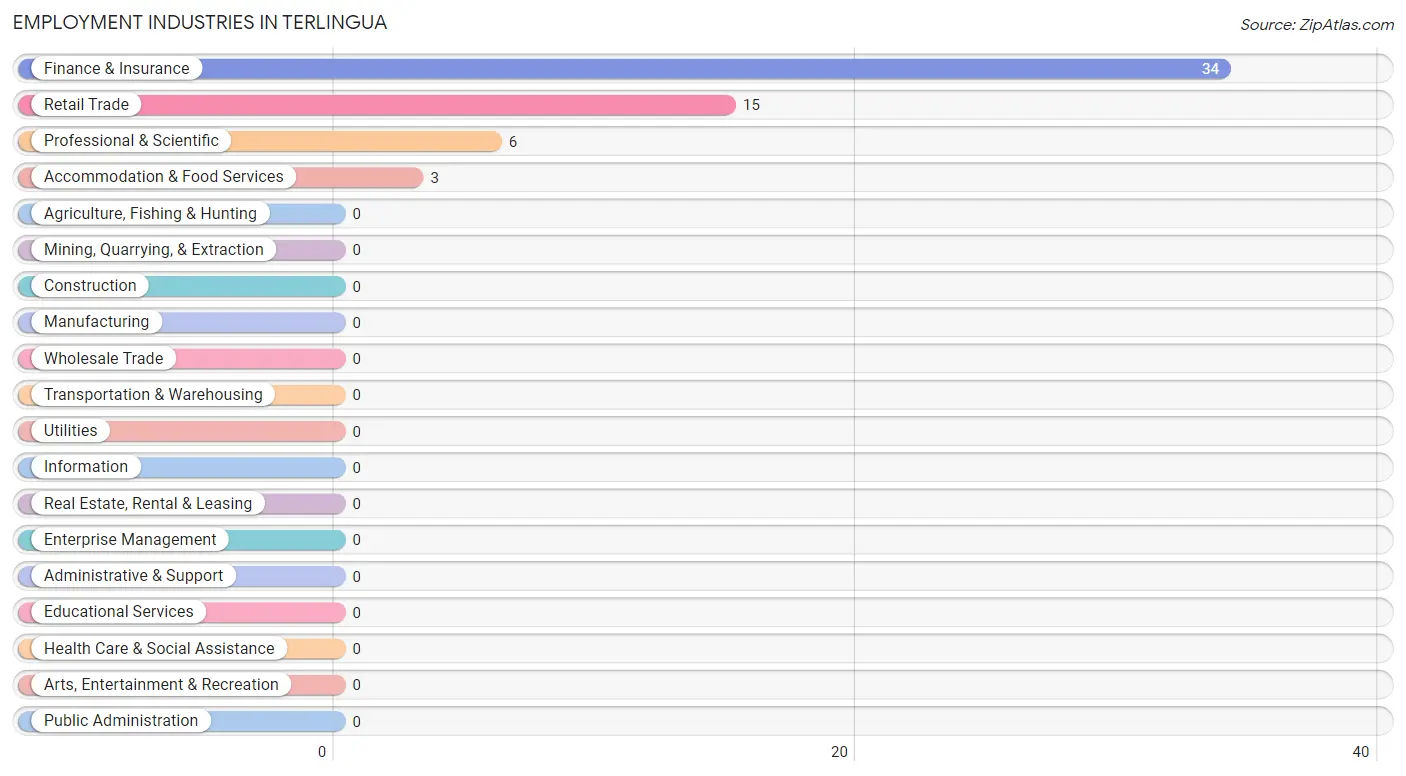
Employment Industries by Sex in Terlingua
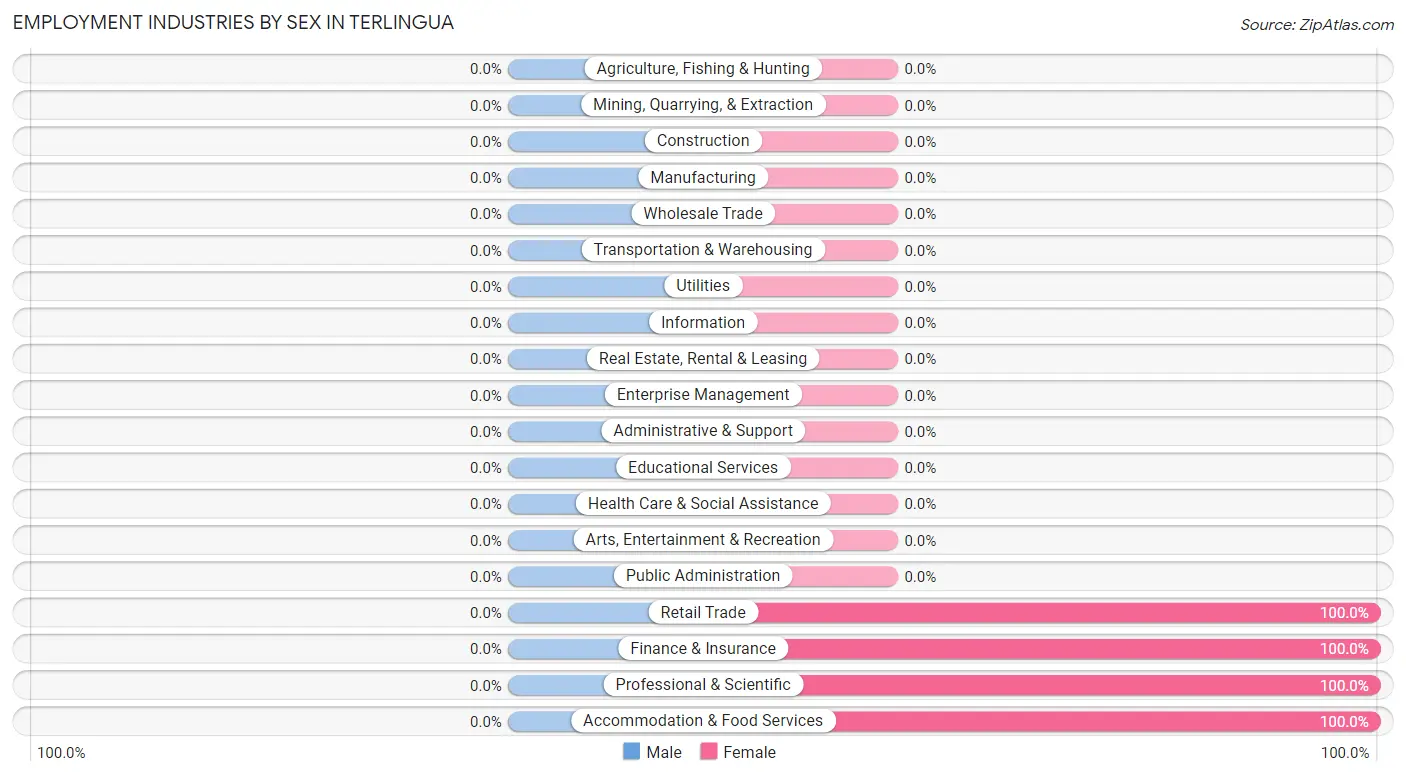
| Industry | Male | Female |
| Agriculture, Fishing & Hunting | 0 (0.0%) | 0 (0.0%) |
| Mining, Quarrying, & Extraction | 0 (0.0%) | 0 (0.0%) |
| Construction | 0 (0.0%) | 0 (0.0%) |
| Manufacturing | 0 (0.0%) | 0 (0.0%) |
| Wholesale Trade | 0 (0.0%) | 0 (0.0%) |
| Retail Trade | 0 (0.0%) | 15 (100.0%) |
| Transportation & Warehousing | 0 (0.0%) | 0 (0.0%) |
| Utilities | 0 (0.0%) | 0 (0.0%) |
| Information | 0 (0.0%) | 0 (0.0%) |
| Finance & Insurance | 0 (0.0%) | 34 (100.0%) |
| Real Estate, Rental & Leasing | 0 (0.0%) | 0 (0.0%) |
| Professional & Scientific | 0 (0.0%) | 6 (100.0%) |
| Enterprise Management | 0 (0.0%) | 0 (0.0%) |
| Administrative & Support | 0 (0.0%) | 0 (0.0%) |
| Educational Services | 0 (0.0%) | 0 (0.0%) |
| Health Care & Social Assistance | 0 (0.0%) | 0 (0.0%) |
| Arts, Entertainment & Recreation | 0 (0.0%) | 0 (0.0%) |
| Accommodation & Food Services | 0 (0.0%) | 3 (100.0%) |
| Public Administration | 0 (0.0%) | 0 (0.0%) |
| Total | 0 (0.0%) | 58 (100.0%) |
Education in Terlingua
School Enrollment in Terlingua
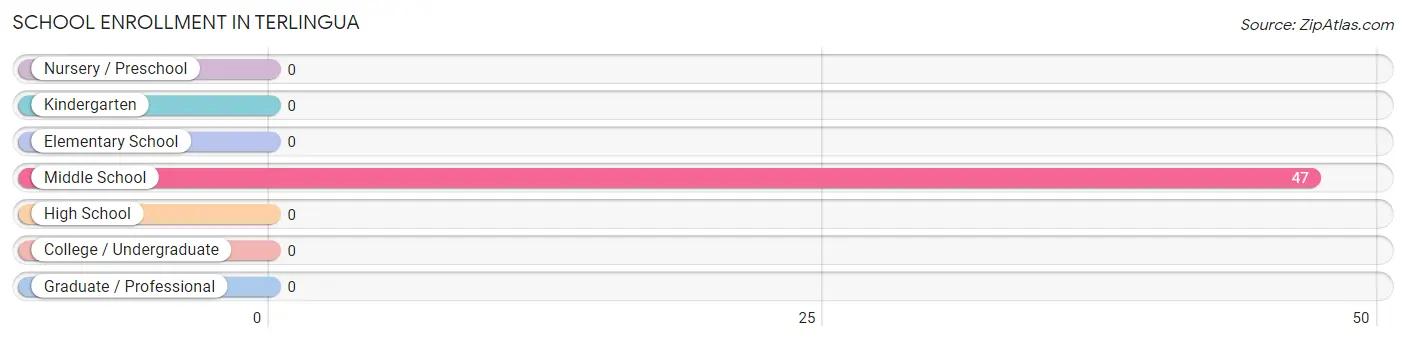
| School Level | # Students | % Students |
| Nursery / Preschool | 0 | 0.0% |
| Kindergarten | 0 | 0.0% |
| Elementary School | 0 | 0.0% |
| Middle School | 47 | 100.0% |
| High School | 0 | 0.0% |
| College / Undergraduate | 0 | 0.0% |
| Graduate / Professional | 0 | 0.0% |
| Total | 47 | 100.0% |
School Enrollment by Age by Funding Source in Terlingua
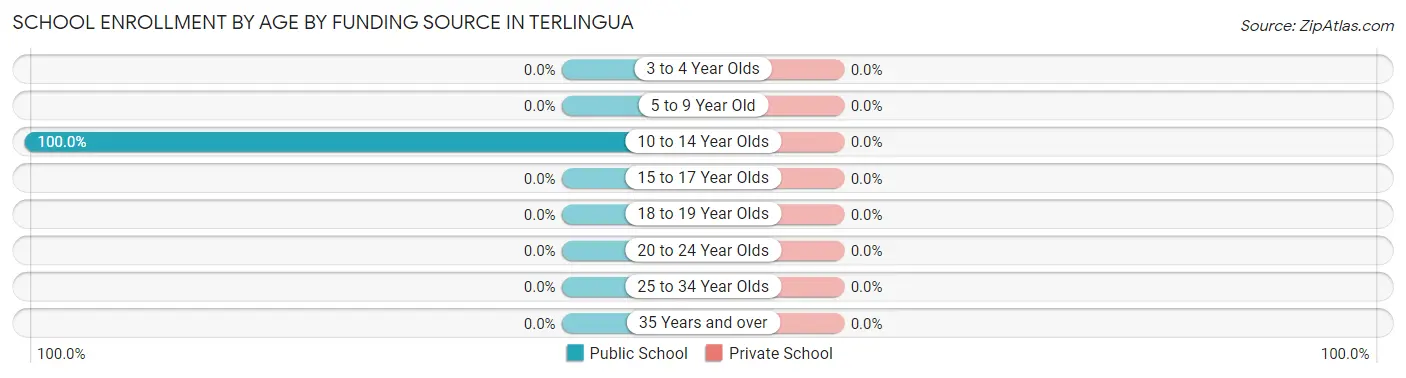
| Age Bracket | Public School | Private School |
| 3 to 4 Year Olds | 0 (0.0%) | 0 (0.0%) |
| 5 to 9 Year Old | 0 (0.0%) | 0 (0.0%) |
| 10 to 14 Year Olds | 47 (100.0%) | 0 (0.0%) |
| 15 to 17 Year Olds | 0 (0.0%) | 0 (0.0%) |
| 18 to 19 Year Olds | 0 (0.0%) | 0 (0.0%) |
| 20 to 24 Year Olds | 0 (0.0%) | 0 (0.0%) |
| 25 to 34 Year Olds | 0 (0.0%) | 0 (0.0%) |
| 35 Years and over | 0 (0.0%) | 0 (0.0%) |
| Total | 47 (100.0%) | 0 (0.0%) |
Educational Attainment by Field of Study in Terlingua
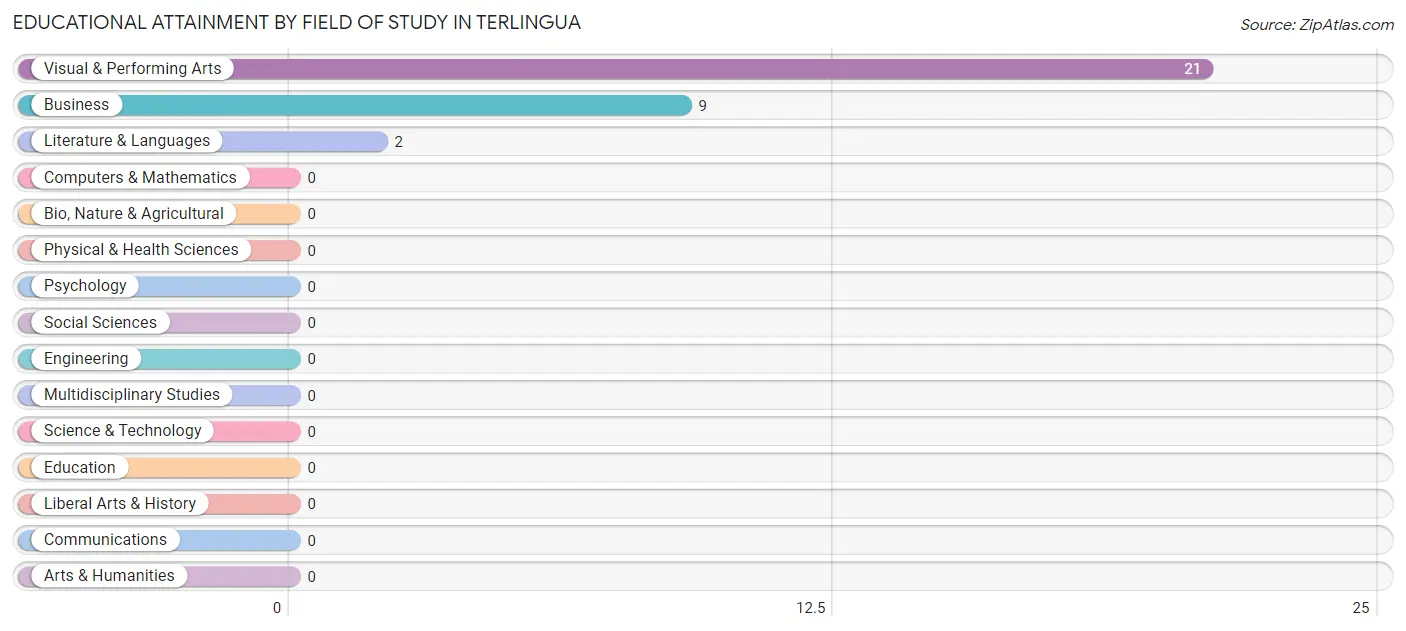
Visual & performing arts (21 | 65.6%), business (9 | 28.1%), and literature & languages (2 | 6.2%) are the most common fields of study among 32 individuals in Terlingua who have obtained a bachelor's degree or higher.
| Field of Study | # Graduates | % Graduates |
| Computers & Mathematics | 0 | 0.0% |
| Bio, Nature & Agricultural | 0 | 0.0% |
| Physical & Health Sciences | 0 | 0.0% |
| Psychology | 0 | 0.0% |
| Social Sciences | 0 | 0.0% |
| Engineering | 0 | 0.0% |
| Multidisciplinary Studies | 0 | 0.0% |
| Science & Technology | 0 | 0.0% |
| Business | 9 | 28.1% |
| Education | 0 | 0.0% |
| Literature & Languages | 2 | 6.2% |
| Liberal Arts & History | 0 | 0.0% |
| Visual & Performing Arts | 21 | 65.6% |
| Communications | 0 | 0.0% |
| Arts & Humanities | 0 | 0.0% |
| Total | 32 | 100.0% |
Transportation & Commute in Terlingua
Vehicle Availability by Sex in Terlingua
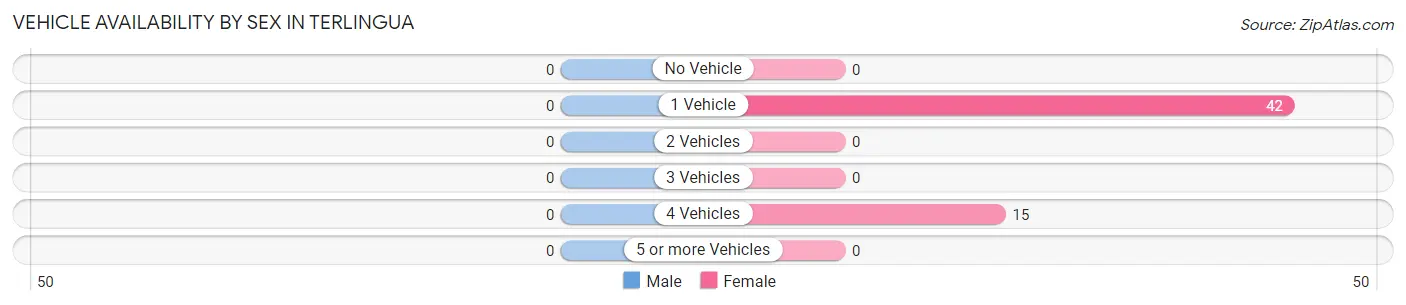
| Vehicles Available | Male | Female |
| No Vehicle | 0 (0.0%) | 0 (0.0%) |
| 1 Vehicle | 0 (0.0%) | 42 (73.7%) |
| 2 Vehicles | 0 (0.0%) | 0 (0.0%) |
| 3 Vehicles | 0 (0.0%) | 0 (0.0%) |
| 4 Vehicles | 0 (0.0%) | 15 (26.3%) |
| 5 or more Vehicles | 0 (0.0%) | 0 (0.0%) |
| Total | 0 (0.0%) | 57 (100.0%) |
Commute Time in Terlingua
The most frequently occuring commute durations in Terlingua are less than 5 minutes (34 commuters, 69.4%), 5 to 9 minutes (15 commuters, 30.6%), and 10 to 14 minutes (0 commuters, 0.0%).
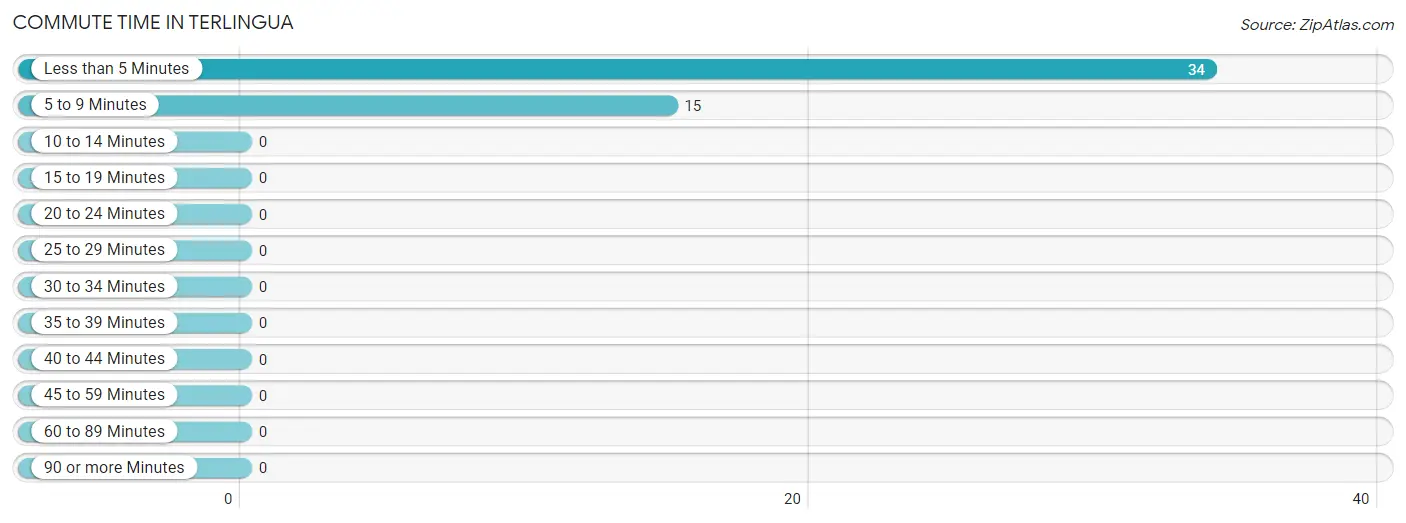
| Commute Time | # Commuters | % Commuters |
| Less than 5 Minutes | 34 | 69.4% |
| 5 to 9 Minutes | 15 | 30.6% |
| 10 to 14 Minutes | 0 | 0.0% |
| 15 to 19 Minutes | 0 | 0.0% |
| 20 to 24 Minutes | 0 | 0.0% |
| 25 to 29 Minutes | 0 | 0.0% |
| 30 to 34 Minutes | 0 | 0.0% |
| 35 to 39 Minutes | 0 | 0.0% |
| 40 to 44 Minutes | 0 | 0.0% |
| 45 to 59 Minutes | 0 | 0.0% |
| 60 to 89 Minutes | 0 | 0.0% |
| 90 or more Minutes | 0 | 0.0% |
Commute Time by Sex in Terlingua
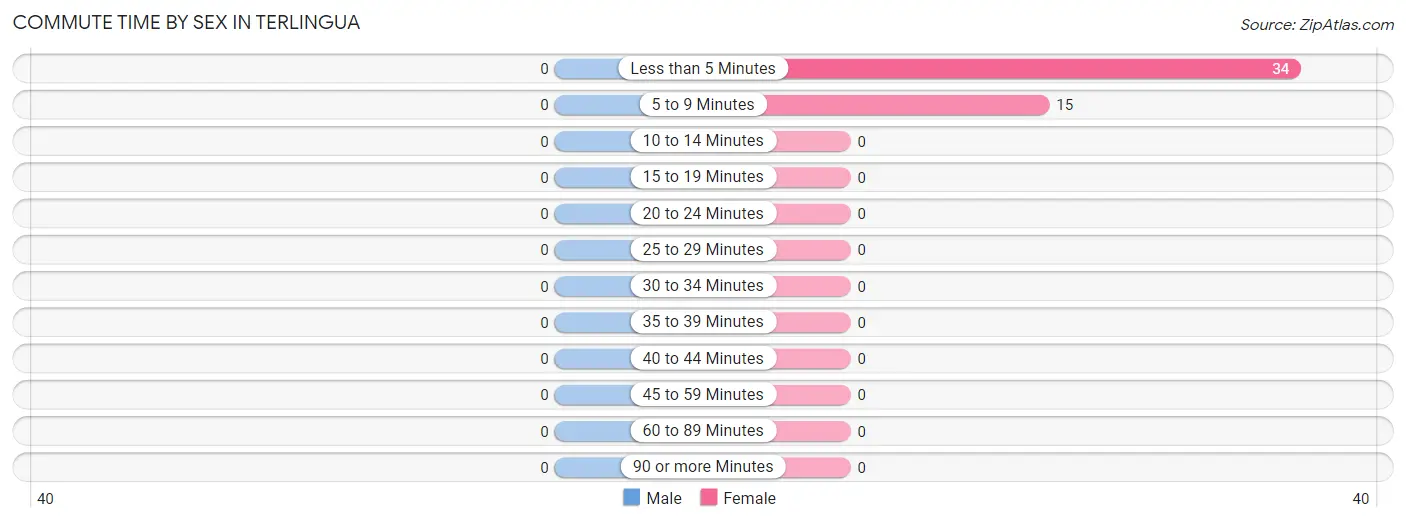
| Commute Time | Male | Female |
| Less than 5 Minutes | 0 (0.0%) | 34 (69.4%) |
| 5 to 9 Minutes | 0 (0.0%) | 15 (30.6%) |
| 10 to 14 Minutes | 0 (0.0%) | 0 (0.0%) |
| 15 to 19 Minutes | 0 (0.0%) | 0 (0.0%) |
| 20 to 24 Minutes | 0 (0.0%) | 0 (0.0%) |
| 25 to 29 Minutes | 0 (0.0%) | 0 (0.0%) |
| 30 to 34 Minutes | 0 (0.0%) | 0 (0.0%) |
| 35 to 39 Minutes | 0 (0.0%) | 0 (0.0%) |
| 40 to 44 Minutes | 0 (0.0%) | 0 (0.0%) |
| 45 to 59 Minutes | 0 (0.0%) | 0 (0.0%) |
| 60 to 89 Minutes | 0 (0.0%) | 0 (0.0%) |
| 90 or more Minutes | 0 (0.0%) | 0 (0.0%) |
Time of Departure to Work by Sex in Terlingua
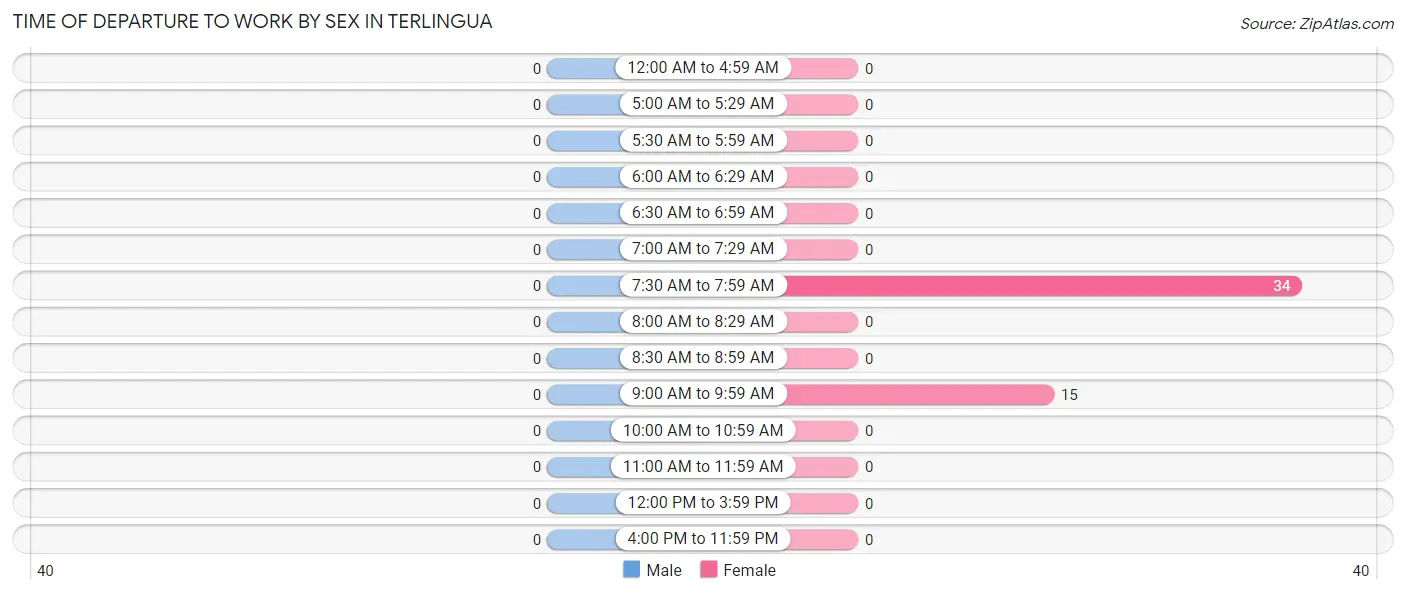
| Time of Departure | Male | Female |
| 12:00 AM to 4:59 AM | 0 (0.0%) | 0 (0.0%) |
| 5:00 AM to 5:29 AM | 0 (0.0%) | 0 (0.0%) |
| 5:30 AM to 5:59 AM | 0 (0.0%) | 0 (0.0%) |
| 6:00 AM to 6:29 AM | 0 (0.0%) | 0 (0.0%) |
| 6:30 AM to 6:59 AM | 0 (0.0%) | 0 (0.0%) |
| 7:00 AM to 7:29 AM | 0 (0.0%) | 0 (0.0%) |
| 7:30 AM to 7:59 AM | 0 (0.0%) | 34 (69.4%) |
| 8:00 AM to 8:29 AM | 0 (0.0%) | 0 (0.0%) |
| 8:30 AM to 8:59 AM | 0 (0.0%) | 0 (0.0%) |
| 9:00 AM to 9:59 AM | 0 (0.0%) | 15 (30.6%) |
| 10:00 AM to 10:59 AM | 0 (0.0%) | 0 (0.0%) |
| 11:00 AM to 11:59 AM | 0 (0.0%) | 0 (0.0%) |
| 12:00 PM to 3:59 PM | 0 (0.0%) | 0 (0.0%) |
| 4:00 PM to 11:59 PM | 0 (0.0%) | 0 (0.0%) |
| Total | 0 (0.0%) | 49 (100.0%) |
Housing Occupancy in Terlingua
Occupancy by Ownership in Terlingua
Of the total 106 dwellings in Terlingua, owner-occupied units account for 93 (87.7%), while renter-occupied units make up 13 (12.3%).
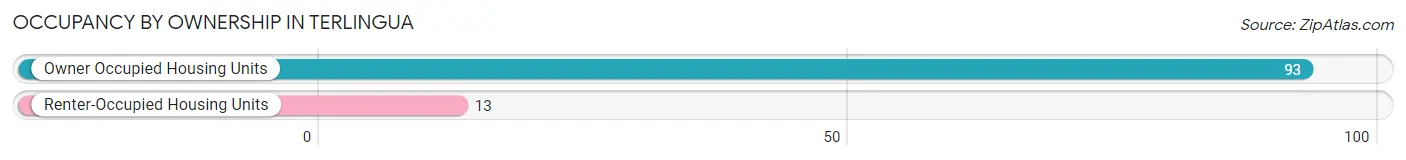
| Occupancy | # Housing Units | % Housing Units |
| Owner Occupied Housing Units | 93 | 87.7% |
| Renter-Occupied Housing Units | 13 | 12.3% |
| Total Occupied Housing Units | 106 | 100.0% |
Occupancy by Household Size in Terlingua
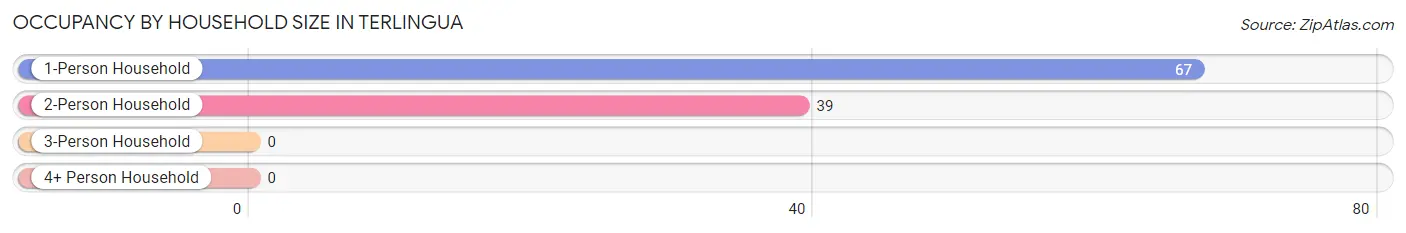
| Household Size | # Housing Units | % Housing Units |
| 1-Person Household | 67 | 63.2% |
| 2-Person Household | 39 | 36.8% |
| 3-Person Household | 0 | 0.0% |
| 4+ Person Household | 0 | 0.0% |
| Total Housing Units | 106 | 100.0% |
Occupancy by Ownership by Household Size in Terlingua
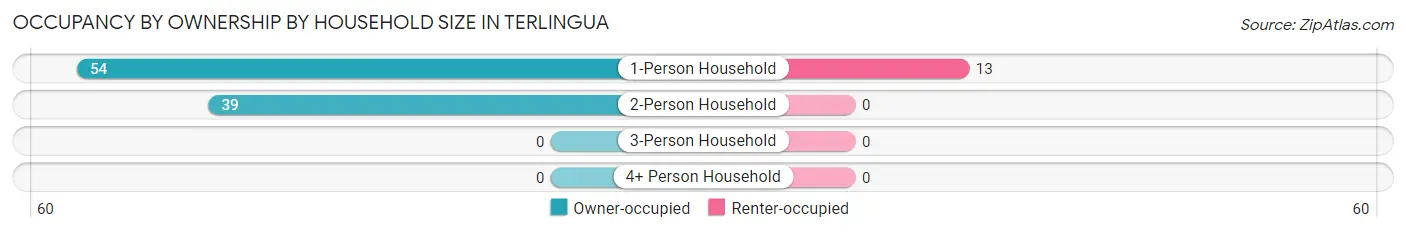
| Household Size | Owner-occupied | Renter-occupied |
| 1-Person Household | 54 (80.6%) | 13 (19.4%) |
| 2-Person Household | 39 (100.0%) | 0 (0.0%) |
| 3-Person Household | 0 (0.0%) | 0 (0.0%) |
| 4+ Person Household | 0 (0.0%) | 0 (0.0%) |
| Total Housing Units | 93 (87.7%) | 13 (12.3%) |
Occupancy by Educational Attainment in Terlingua
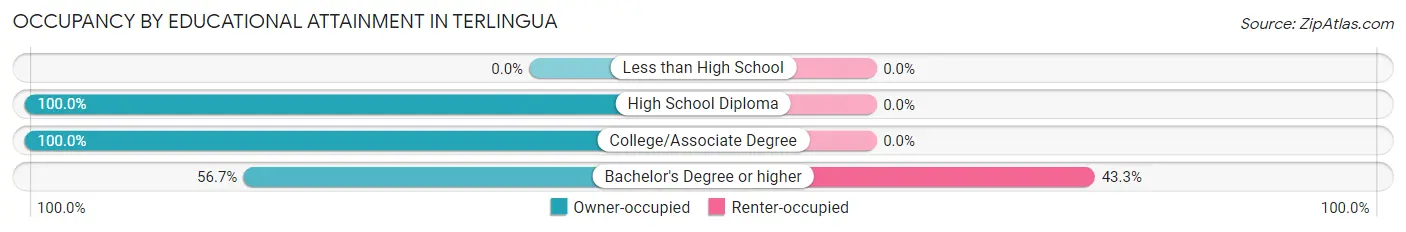
| Household Size | Owner-occupied | Renter-occupied |
| Less than High School | 0 (0.0%) | 0 (0.0%) |
| High School Diploma | 25 (100.0%) | 0 (0.0%) |
| College/Associate Degree | 51 (100.0%) | 0 (0.0%) |
| Bachelor's Degree or higher | 17 (56.7%) | 13 (43.3%) |
Occupancy by Age of Householder in Terlingua
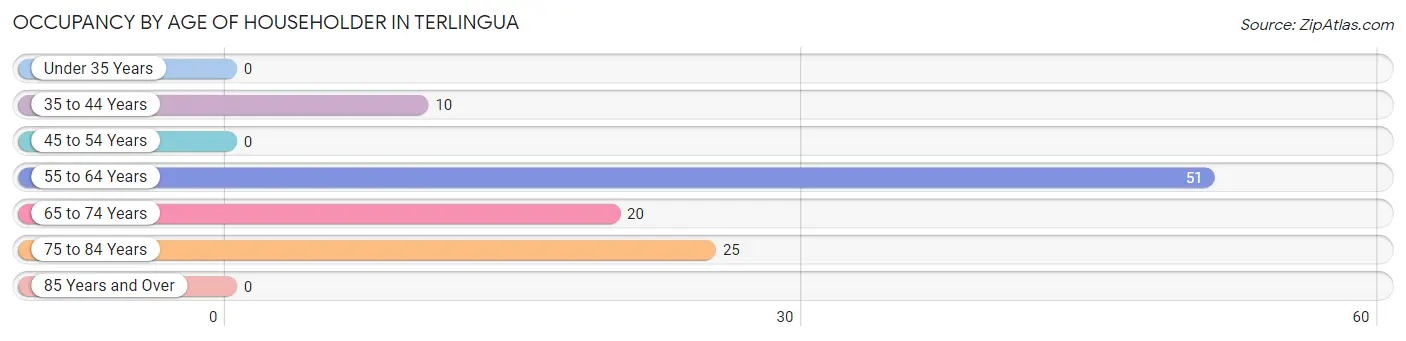
| Age Bracket | # Households | % Households |
| Under 35 Years | 0 | 0.0% |
| 35 to 44 Years | 10 | 9.4% |
| 45 to 54 Years | 0 | 0.0% |
| 55 to 64 Years | 51 | 48.1% |
| 65 to 74 Years | 20 | 18.9% |
| 75 to 84 Years | 25 | 23.6% |
| 85 Years and Over | 0 | 0.0% |
| Total | 106 | 100.0% |
Housing Finances in Terlingua
Median Income by Occupancy in Terlingua
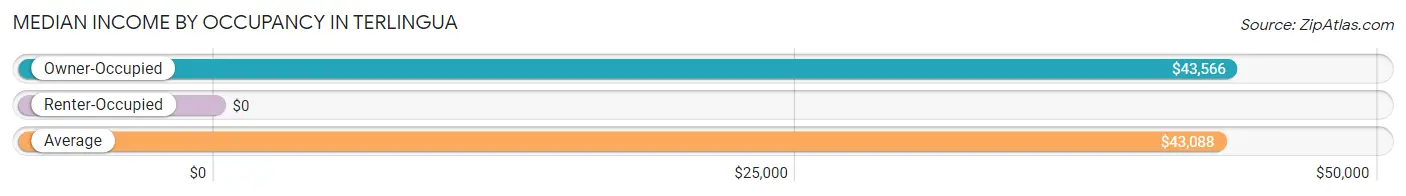
| Occupancy Type | # Households | Median Income |
| Owner-Occupied | 93 (87.7%) | $43,566 |
| Renter-Occupied | 13 (12.3%) | $0 |
| Average | 106 (100.0%) | $43,088 |
Occupancy by Householder Income Bracket in Terlingua
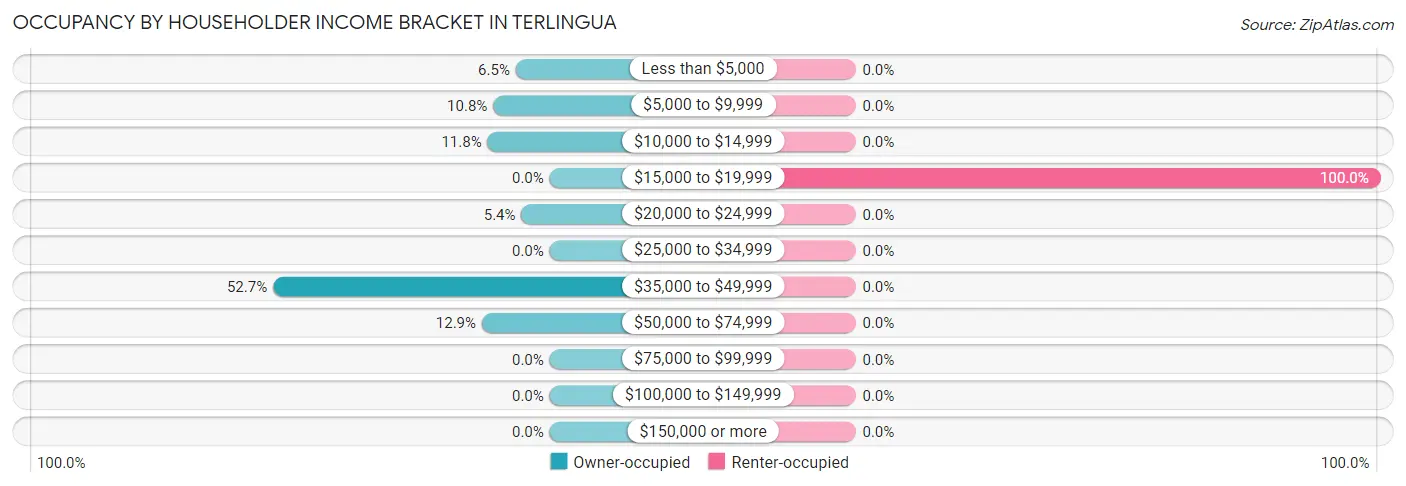
| Income Bracket | Owner-occupied | Renter-occupied |
| Less than $5,000 | 6 (6.5%) | 0 (0.0%) |
| $5,000 to $9,999 | 10 (10.7%) | 0 (0.0%) |
| $10,000 to $14,999 | 11 (11.8%) | 0 (0.0%) |
| $15,000 to $19,999 | 0 (0.0%) | 13 (100.0%) |
| $20,000 to $24,999 | 5 (5.4%) | 0 (0.0%) |
| $25,000 to $34,999 | 0 (0.0%) | 0 (0.0%) |
| $35,000 to $49,999 | 49 (52.7%) | 0 (0.0%) |
| $50,000 to $74,999 | 12 (12.9%) | 0 (0.0%) |
| $75,000 to $99,999 | 0 (0.0%) | 0 (0.0%) |
| $100,000 to $149,999 | 0 (0.0%) | 0 (0.0%) |
| $150,000 or more | 0 (0.0%) | 0 (0.0%) |
| Total | 93 (100.0%) | 13 (100.0%) |
Monthly Housing Cost Tiers in Terlingua
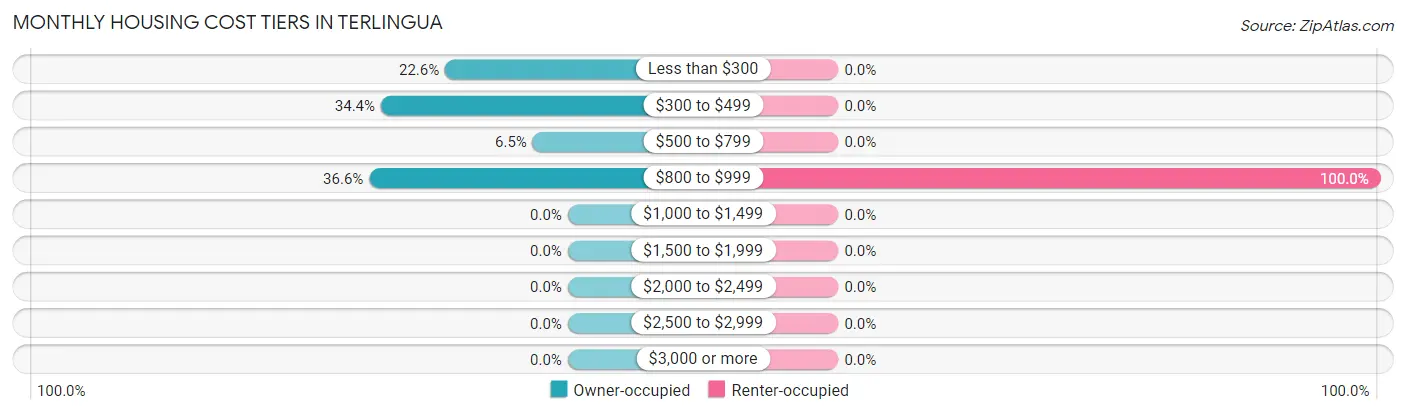
| Monthly Cost | Owner-occupied | Renter-occupied |
| Less than $300 | 21 (22.6%) | 0 (0.0%) |
| $300 to $499 | 32 (34.4%) | 0 (0.0%) |
| $500 to $799 | 6 (6.5%) | 0 (0.0%) |
| $800 to $999 | 34 (36.6%) | 13 (100.0%) |
| $1,000 to $1,499 | 0 (0.0%) | 0 (0.0%) |
| $1,500 to $1,999 | 0 (0.0%) | 0 (0.0%) |
| $2,000 to $2,499 | 0 (0.0%) | 0 (0.0%) |
| $2,500 to $2,999 | 0 (0.0%) | 0 (0.0%) |
| $3,000 or more | 0 (0.0%) | 0 (0.0%) |
| Total | 93 (100.0%) | 13 (100.0%) |
Physical Housing Characteristics in Terlingua
Housing Structures in Terlingua
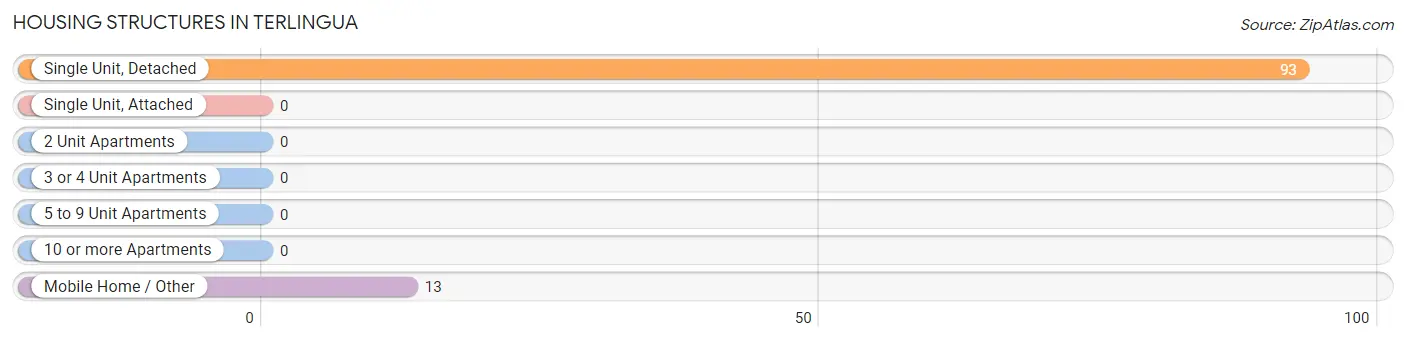
| Structure Type | # Housing Units | % Housing Units |
| Single Unit, Detached | 93 | 87.7% |
| Single Unit, Attached | 0 | 0.0% |
| 2 Unit Apartments | 0 | 0.0% |
| 3 or 4 Unit Apartments | 0 | 0.0% |
| 5 to 9 Unit Apartments | 0 | 0.0% |
| 10 or more Apartments | 0 | 0.0% |
| Mobile Home / Other | 13 | 12.3% |
| Total | 106 | 100.0% |
Housing Structures by Occupancy in Terlingua
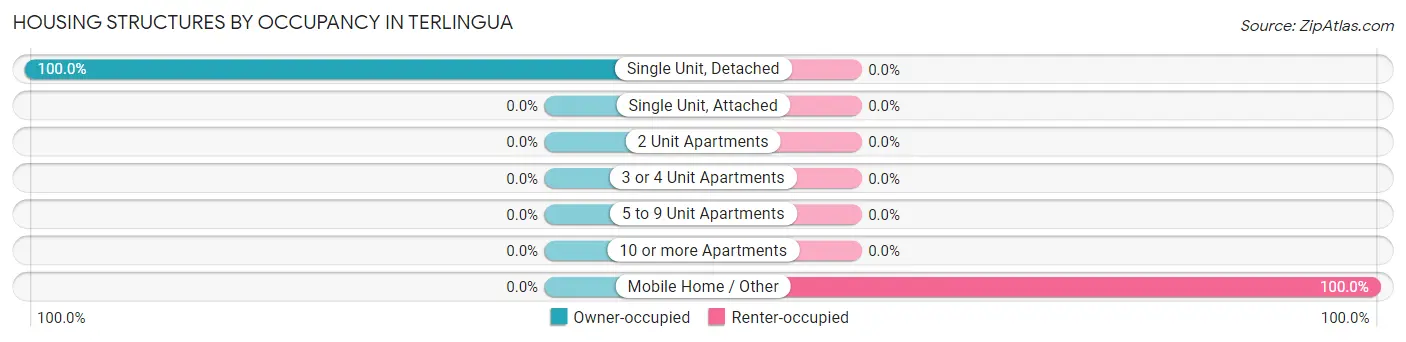
| Structure Type | Owner-occupied | Renter-occupied |
| Single Unit, Detached | 93 (100.0%) | 0 (0.0%) |
| Single Unit, Attached | 0 (0.0%) | 0 (0.0%) |
| 2 Unit Apartments | 0 (0.0%) | 0 (0.0%) |
| 3 or 4 Unit Apartments | 0 (0.0%) | 0 (0.0%) |
| 5 to 9 Unit Apartments | 0 (0.0%) | 0 (0.0%) |
| 10 or more Apartments | 0 (0.0%) | 0 (0.0%) |
| Mobile Home / Other | 0 (0.0%) | 13 (100.0%) |
| Total | 93 (87.7%) | 13 (12.3%) |
Housing Structures by Number of Rooms in Terlingua
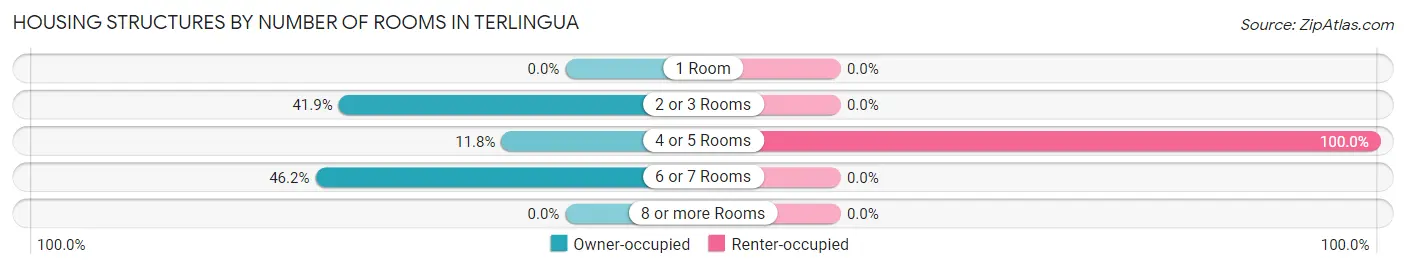
| Number of Rooms | Owner-occupied | Renter-occupied |
| 1 Room | 0 (0.0%) | 0 (0.0%) |
| 2 or 3 Rooms | 39 (41.9%) | 0 (0.0%) |
| 4 or 5 Rooms | 11 (11.8%) | 13 (100.0%) |
| 6 or 7 Rooms | 43 (46.2%) | 0 (0.0%) |
| 8 or more Rooms | 0 (0.0%) | 0 (0.0%) |
| Total | 93 (100.0%) | 13 (100.0%) |
Housing Structure by Heating Type in Terlingua
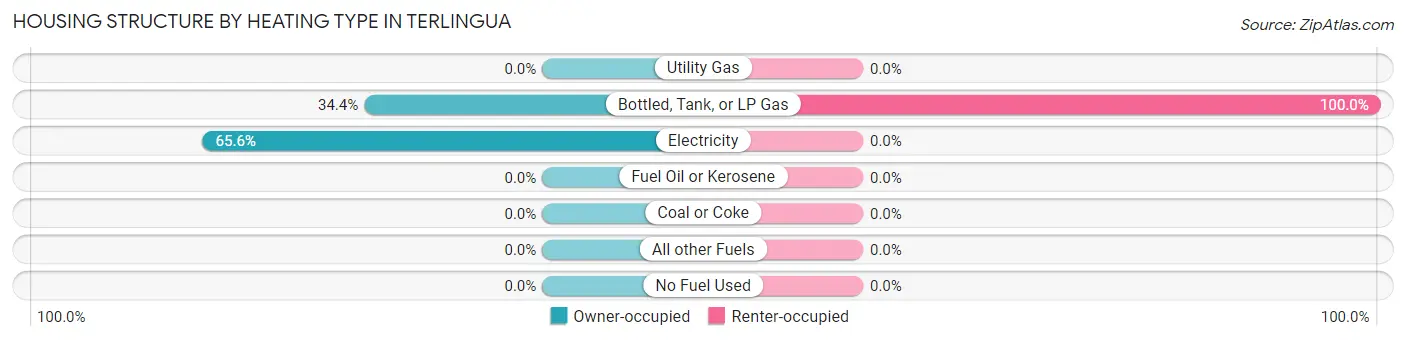
| Heating Type | Owner-occupied | Renter-occupied |
| Utility Gas | 0 (0.0%) | 0 (0.0%) |
| Bottled, Tank, or LP Gas | 32 (34.4%) | 13 (100.0%) |
| Electricity | 61 (65.6%) | 0 (0.0%) |
| Fuel Oil or Kerosene | 0 (0.0%) | 0 (0.0%) |
| Coal or Coke | 0 (0.0%) | 0 (0.0%) |
| All other Fuels | 0 (0.0%) | 0 (0.0%) |
| No Fuel Used | 0 (0.0%) | 0 (0.0%) |
| Total | 93 (100.0%) | 13 (100.0%) |
Household Vehicle Usage in Terlingua
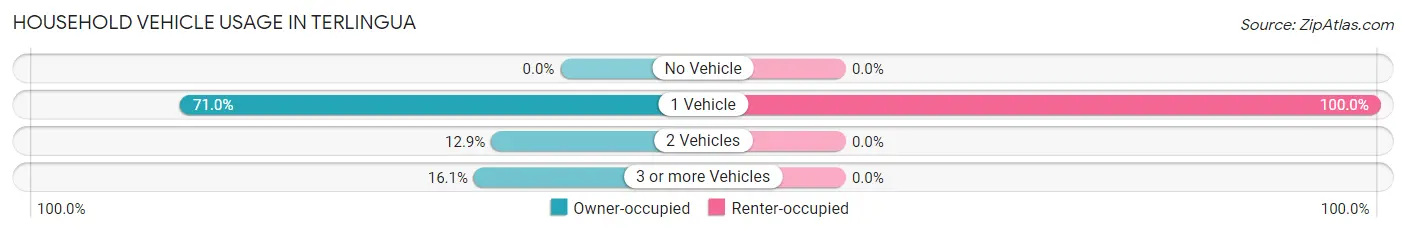
| Vehicles per Household | Owner-occupied | Renter-occupied |
| No Vehicle | 0 (0.0%) | 0 (0.0%) |
| 1 Vehicle | 66 (71.0%) | 13 (100.0%) |
| 2 Vehicles | 12 (12.9%) | 0 (0.0%) |
| 3 or more Vehicles | 15 (16.1%) | 0 (0.0%) |
| Total | 93 (100.0%) | 13 (100.0%) |
Real Estate & Mortgages in Terlingua
Real Estate and Mortgage Overview in Terlingua
| Characteristic | Without Mortgage | With Mortgage |
| Housing Units | 59 | 34 |
| Median Property Value | $123,200 | $0 |
| Median Household Income | - | - |
| Monthly Housing Costs | $335 | $0 |
| Real Estate Taxes | $310 | $0 |
Property Value by Mortgage Status in Terlingua
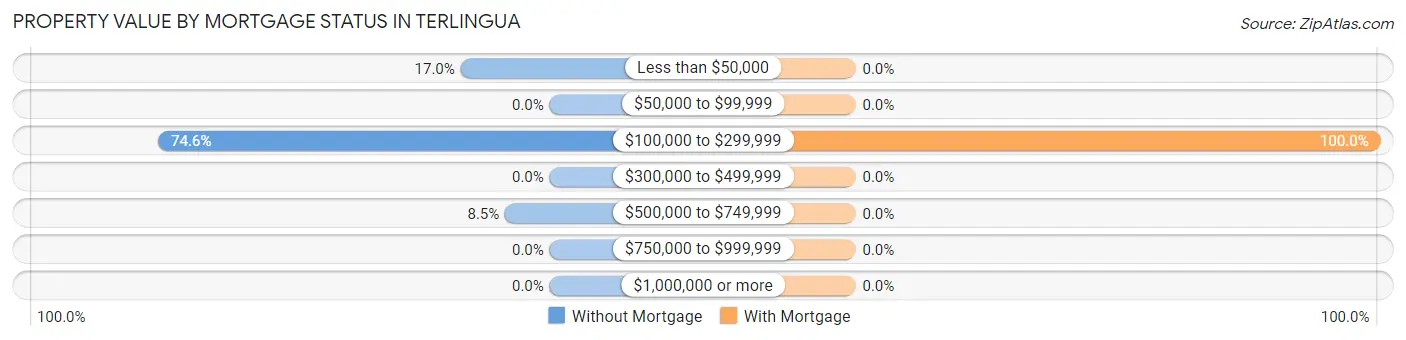
| Property Value | Without Mortgage | With Mortgage |
| Less than $50,000 | 10 (17.0%) | 0 (0.0%) |
| $50,000 to $99,999 | 0 (0.0%) | 0 (0.0%) |
| $100,000 to $299,999 | 44 (74.6%) | 34 (100.0%) |
| $300,000 to $499,999 | 0 (0.0%) | 0 (0.0%) |
| $500,000 to $749,999 | 5 (8.5%) | 0 (0.0%) |
| $750,000 to $999,999 | 0 (0.0%) | 0 (0.0%) |
| $1,000,000 or more | 0 (0.0%) | 0 (0.0%) |
| Total | 59 (100.0%) | 34 (100.0%) |
Household Income by Mortgage Status in Terlingua
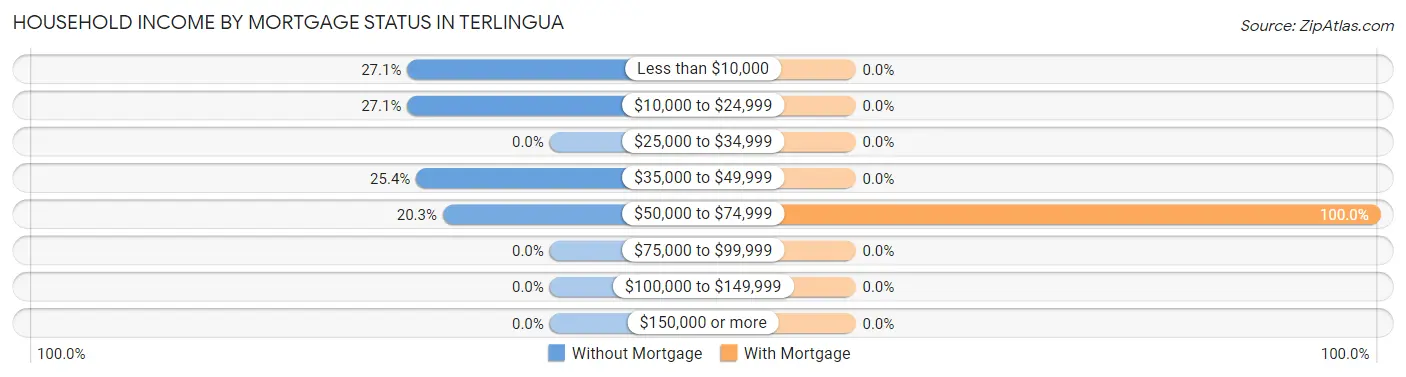
| Household Income | Without Mortgage | With Mortgage |
| Less than $10,000 | 16 (27.1%) | 0 (0.0%) |
| $10,000 to $24,999 | 16 (27.1%) | 0 (0.0%) |
| $25,000 to $34,999 | 0 (0.0%) | 0 (0.0%) |
| $35,000 to $49,999 | 15 (25.4%) | 0 (0.0%) |
| $50,000 to $74,999 | 12 (20.3%) | 34 (100.0%) |
| $75,000 to $99,999 | 0 (0.0%) | 0 (0.0%) |
| $100,000 to $149,999 | 0 (0.0%) | 0 (0.0%) |
| $150,000 or more | 0 (0.0%) | 0 (0.0%) |
| Total | 59 (100.0%) | 34 (100.0%) |
Property Value to Household Income Ratio in Terlingua
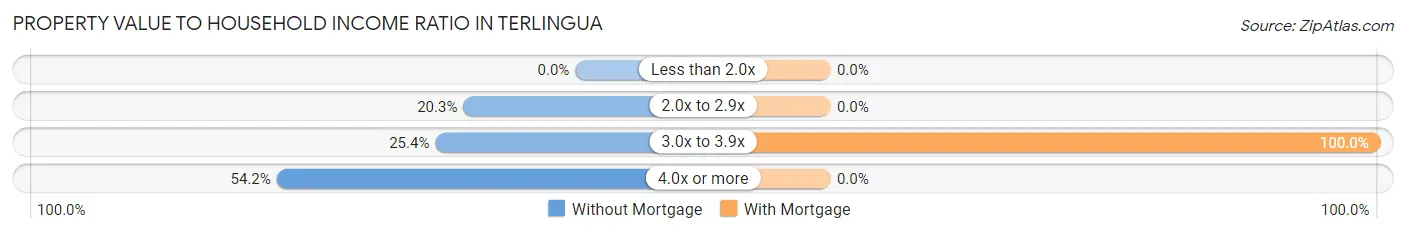
| Value-to-Income Ratio | Without Mortgage | With Mortgage |
| Less than 2.0x | 0 (0.0%) | 0 (0.0%) |
| 2.0x to 2.9x | 12 (20.3%) | 0 (0.0%) |
| 3.0x to 3.9x | 15 (25.4%) | 34 (100.0%) |
| 4.0x or more | 32 (54.2%) | 0 (0.0%) |
| Total | 59 (100.0%) | 34 (100.0%) |
Real Estate Taxes by Mortgage Status in Terlingua
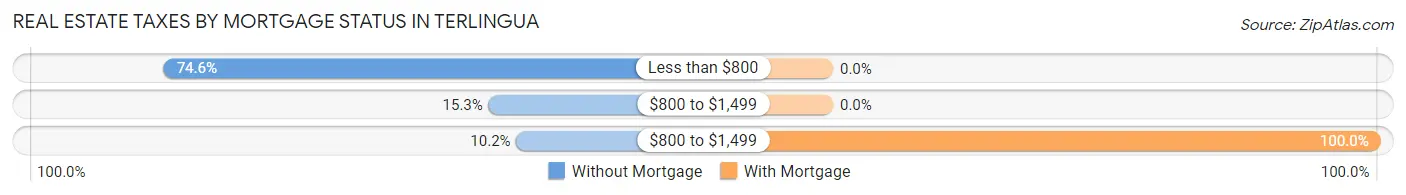
| Property Taxes | Without Mortgage | With Mortgage |
| Less than $800 | 44 (74.6%) | 0 (0.0%) |
| $800 to $1,499 | 9 (15.2%) | 0 (0.0%) |
| $800 to $1,499 | 6 (10.2%) | 34 (100.0%) |
| Total | 59 (100.0%) | 34 (100.0%) |
Health & Disability in Terlingua
Health Insurance Coverage by Age in Terlingua
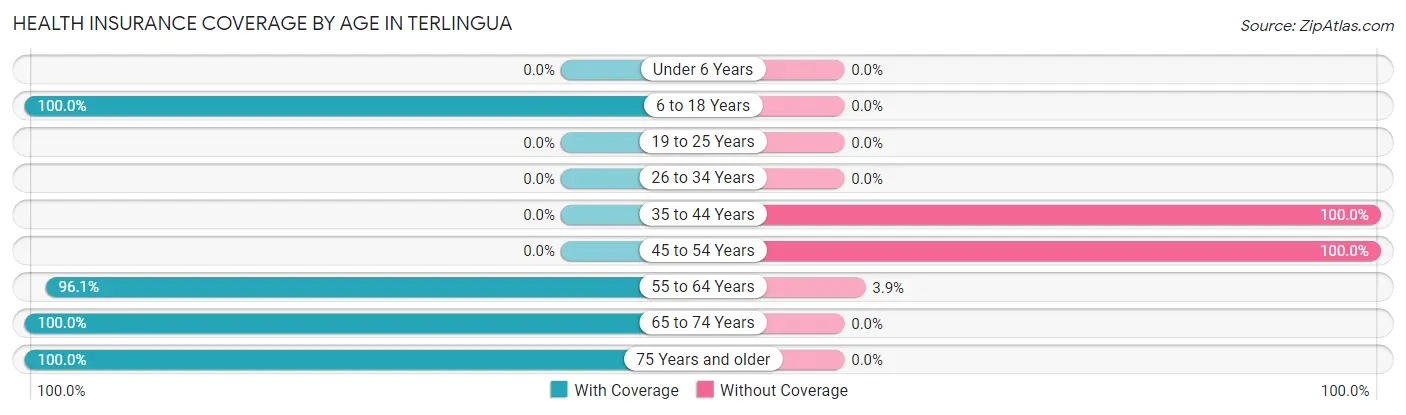
| Age Bracket | With Coverage | Without Coverage |
| Under 6 Years | 0 (0.0%) | 0 (0.0%) |
| 6 to 18 Years | 47 (100.0%) | 0 (0.0%) |
| 19 to 25 Years | 0 (0.0%) | 0 (0.0%) |
| 26 to 34 Years | 0 (0.0%) | 0 (0.0%) |
| 35 to 44 Years | 0 (0.0%) | 10 (100.0%) |
| 45 to 54 Years | 0 (0.0%) | 1 (100.0%) |
| 55 to 64 Years | 49 (96.1%) | 2 (3.9%) |
| 65 to 74 Years | 20 (100.0%) | 0 (0.0%) |
| 75 Years and older | 25 (100.0%) | 0 (0.0%) |
| Total | 141 (91.6%) | 13 (8.4%) |
Health Insurance Coverage by Citizenship Status in Terlingua
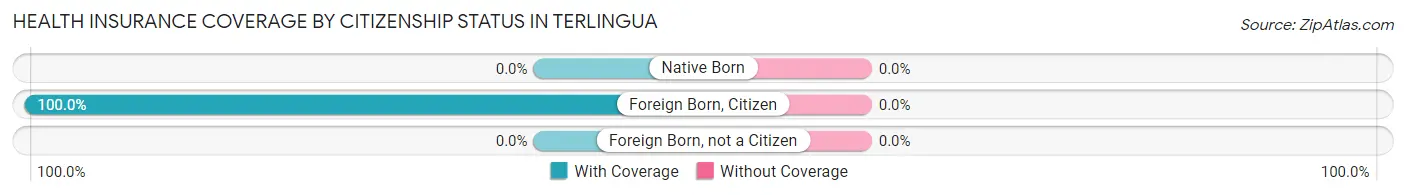
| Citizenship Status | With Coverage | Without Coverage |
| Native Born | 0 (0.0%) | 0 (0.0%) |
| Foreign Born, Citizen | 47 (100.0%) | 0 (0.0%) |
| Foreign Born, not a Citizen | 0 (0.0%) | 0 (0.0%) |
Health Insurance Coverage by Household Income in Terlingua
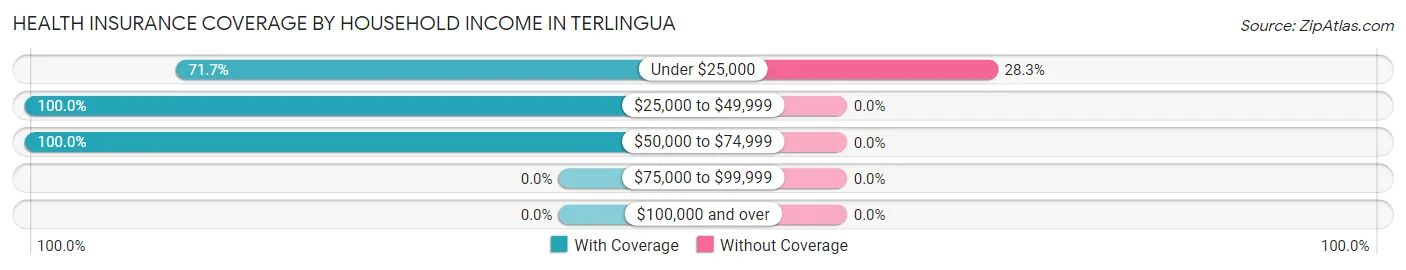
| Household Income | With Coverage | Without Coverage |
| Under $25,000 | 33 (71.7%) | 13 (28.3%) |
| $25,000 to $49,999 | 96 (100.0%) | 0 (0.0%) |
| $50,000 to $74,999 | 12 (100.0%) | 0 (0.0%) |
| $75,000 to $99,999 | 0 (0.0%) | 0 (0.0%) |
| $100,000 and over | 0 (0.0%) | 0 (0.0%) |
Public vs Private Health Insurance Coverage by Age in Terlingua
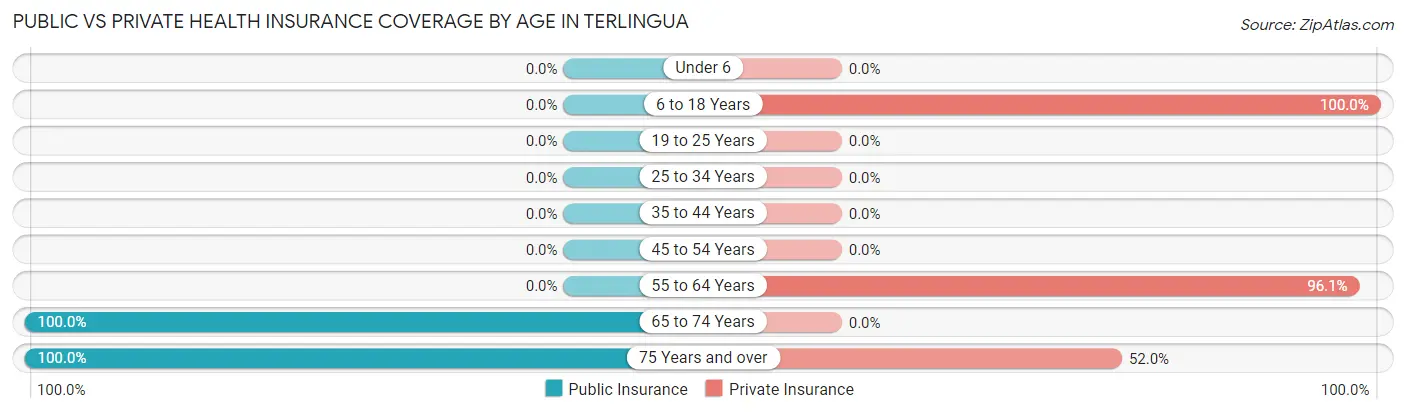
| Age Bracket | Public Insurance | Private Insurance |
| Under 6 | 0 (0.0%) | 0 (0.0%) |
| 6 to 18 Years | 0 (0.0%) | 47 (100.0%) |
| 19 to 25 Years | 0 (0.0%) | 0 (0.0%) |
| 25 to 34 Years | 0 (0.0%) | 0 (0.0%) |
| 35 to 44 Years | 0 (0.0%) | 0 (0.0%) |
| 45 to 54 Years | 0 (0.0%) | 0 (0.0%) |
| 55 to 64 Years | 0 (0.0%) | 49 (96.1%) |
| 65 to 74 Years | 20 (100.0%) | 0 (0.0%) |
| 75 Years and over | 25 (100.0%) | 13 (52.0%) |
| Total | 45 (29.2%) | 109 (70.8%) |
Disability Status by Sex by Age in Terlingua
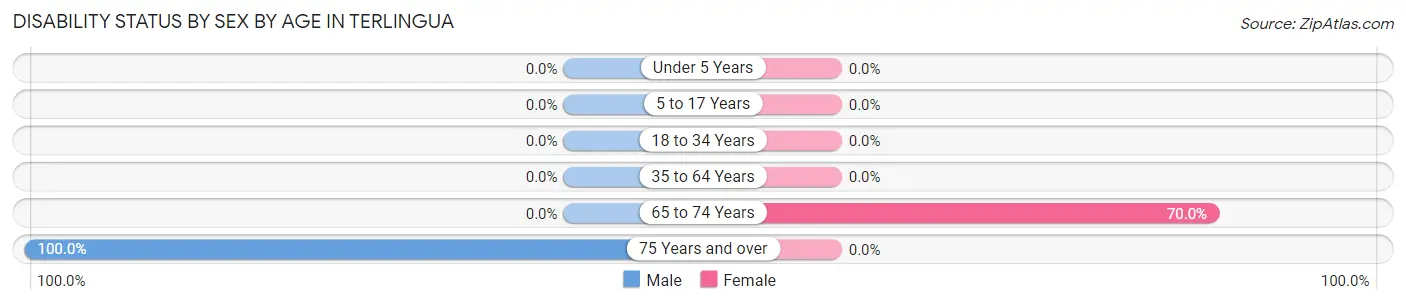
| Age Bracket | Male | Female |
| Under 5 Years | 0 (0.0%) | 0 (0.0%) |
| 5 to 17 Years | 0 (0.0%) | 0 (0.0%) |
| 18 to 34 Years | 0 (0.0%) | 0 (0.0%) |
| 35 to 64 Years | 0 (0.0%) | 0 (0.0%) |
| 65 to 74 Years | 0 (0.0%) | 14 (70.0%) |
| 75 Years and over | 13 (100.0%) | 0 (0.0%) |
Disability Class by Sex by Age in Terlingua
Disability Class: Hearing Difficulty
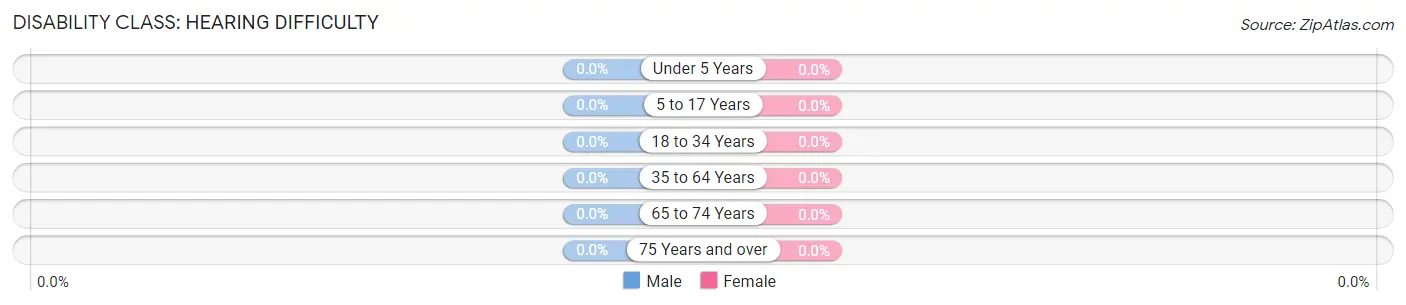
| Age Bracket | Male | Female |
| Under 5 Years | 0 (0.0%) | 0 (0.0%) |
| 5 to 17 Years | 0 (0.0%) | 0 (0.0%) |
| 18 to 34 Years | 0 (0.0%) | 0 (0.0%) |
| 35 to 64 Years | 0 (0.0%) | 0 (0.0%) |
| 65 to 74 Years | 0 (0.0%) | 0 (0.0%) |
| 75 Years and over | 0 (0.0%) | 0 (0.0%) |
Disability Class: Vision Difficulty
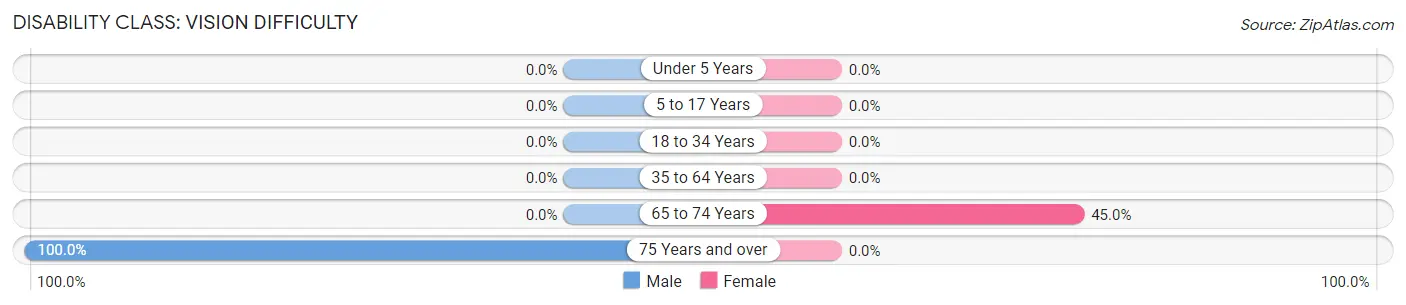
| Age Bracket | Male | Female |
| Under 5 Years | 0 (0.0%) | 0 (0.0%) |
| 5 to 17 Years | 0 (0.0%) | 0 (0.0%) |
| 18 to 34 Years | 0 (0.0%) | 0 (0.0%) |
| 35 to 64 Years | 0 (0.0%) | 0 (0.0%) |
| 65 to 74 Years | 0 (0.0%) | 9 (45.0%) |
| 75 Years and over | 13 (100.0%) | 0 (0.0%) |
Disability Class: Cognitive Difficulty
| Age Bracket | Male | Female |
| 5 to 17 Years | 0 (0.0%) | 0 (0.0%) |
| 18 to 34 Years | 0 (0.0%) | 0 (0.0%) |
| 35 to 64 Years | 0 (0.0%) | 0 (0.0%) |
| 65 to 74 Years | 0 (0.0%) | 0 (0.0%) |
| 75 Years and over | 0 (0.0%) | 0 (0.0%) |
Disability Class: Ambulatory Difficulty
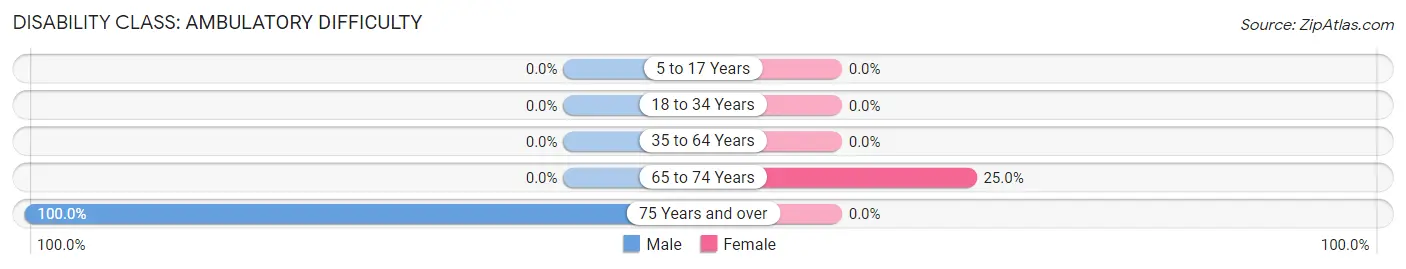
| Age Bracket | Male | Female |
| 5 to 17 Years | 0 (0.0%) | 0 (0.0%) |
| 18 to 34 Years | 0 (0.0%) | 0 (0.0%) |
| 35 to 64 Years | 0 (0.0%) | 0 (0.0%) |
| 65 to 74 Years | 0 (0.0%) | 5 (25.0%) |
| 75 Years and over | 13 (100.0%) | 0 (0.0%) |
Disability Class: Self-Care Difficulty

| Age Bracket | Male | Female |
| 5 to 17 Years | 0 (0.0%) | 0 (0.0%) |
| 18 to 34 Years | 0 (0.0%) | 0 (0.0%) |
| 35 to 64 Years | 0 (0.0%) | 0 (0.0%) |
| 65 to 74 Years | 0 (0.0%) | 0 (0.0%) |
| 75 Years and over | 13 (100.0%) | 0 (0.0%) |
Technology Access in Terlingua
Computing Device Access in Terlingua
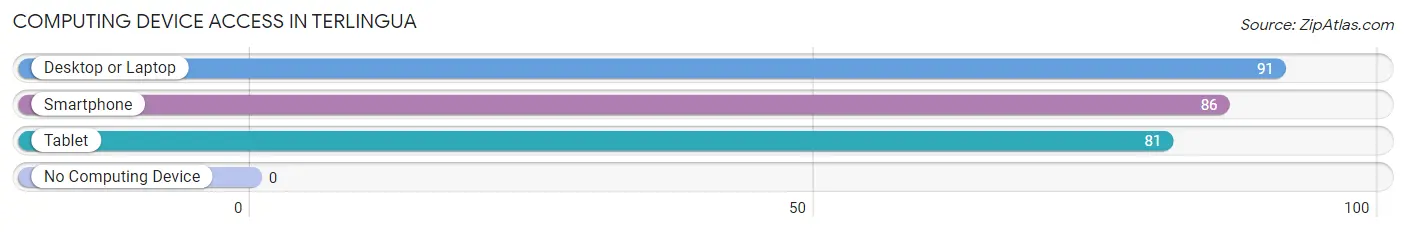
| Device Type | # Households | % Households |
| Desktop or Laptop | 91 | 85.9% |
| Smartphone | 86 | 81.1% |
| Tablet | 81 | 76.4% |
| No Computing Device | 0 | 0.0% |
| Total | 106 | 100.0% |
Internet Access in Terlingua
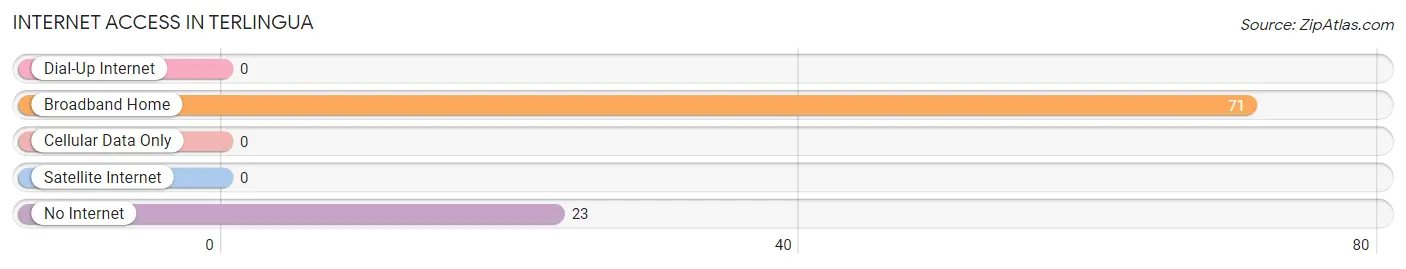
| Internet Type | # Households | % Households |
| Dial-Up Internet | 0 | 0.0% |
| Broadband Home | 71 | 67.0% |
| Cellular Data Only | 0 | 0.0% |
| Satellite Internet | 0 | 0.0% |
| No Internet | 23 | 21.7% |
| Total | 106 | 100.0% |
Terlingua Summary
Terlingua, TX is a small unincorporated community located in the Big Bend region of Texas. It is situated in the Chihuahuan Desert, near the Rio Grande and the Mexican border. The town is known for its unique history, geography, economy, and demographics.
History
The history of Terlingua, TX dates back to the late 1800s when it was founded as a mining town. The town was originally established as a mercury mining camp in the 1880s, and it quickly grew to become one of the largest mercury mining operations in the United States. The town was named after the Spanish word for “three tongues”, referring to the three languages spoken in the area: English, Spanish, and the local Native American language.
The town’s population peaked in the early 1900s, when it had over 1,000 residents. However, the mercury mining industry began to decline in the 1920s, and the population of Terlingua began to dwindle. By the 1950s, the town had become a ghost town, with only a few dozen residents.
In the 1960s, the town was rediscovered by a group of artists and writers who were drawn to the area’s unique landscape and culture. The town began to attract a new wave of residents, and it soon became a popular tourist destination. Today, Terlingua is a popular destination for tourists and outdoor enthusiasts, and it is home to a vibrant arts and music scene.
Geography
Terlingua, TX is located in the Big Bend region of Texas, near the Rio Grande and the Mexican border. The town is situated in the Chihuahuan Desert, and it is surrounded by rugged mountains and canyons. The area is known for its unique landscape, which includes desert, mountains, and canyons.
The town is located in Brewster County, and it is approximately 100 miles from the cities of El Paso and Marfa. The nearest major airport is in El Paso, which is about a two-hour drive from Terlingua.
Economy
The economy of Terlingua, TX is largely based on tourism. The town is a popular destination for outdoor enthusiasts, and it is home to a vibrant arts and music scene. The town is also home to several restaurants, bars, and shops.
The town is also home to a number of small businesses, including a general store, a gas station, and a post office. The town is also home to a number of artists and art galleries, as well as a number of bed and breakfasts.
Demographics
As of the 2010 census, the population of Terlingua, TX was approximately 200 people. The town is predominantly white, with a small Hispanic population. The median age of the population is 44 years old, and the median household income is $30,000.
The town is home to a number of artists and musicians, and it is a popular destination for outdoor enthusiasts. The town is also home to a number of small businesses, including restaurants, bars, and shops.
Conclusion
Terlingua, TX is a small unincorporated community located in the Big Bend region of Texas. It is situated in the Chihuahuan Desert, near the Rio Grande and the Mexican border. The town is known for its unique history, geography, economy, and demographics. The town is a popular destination for tourists and outdoor enthusiasts, and it is home to a vibrant arts and music scene. The town is also home to a number of small businesses, including restaurants, bars, and shops. The population of Terlingua, TX is predominantly white, with a small Hispanic population. The median age of the population is 44 years old, and the median household income is $30,000.
Common Questions
What is the Total Population of Terlingua?
Total Population of Terlingua is 154.
What is the Total Male Population of Terlingua?
Total Male Population of Terlingua is 60.
What is the Total Female Population of Terlingua?
Total Female Population of Terlingua is 94.
What is the Ratio of Males per 100 Females in Terlingua?
There are 63.83 Males per 100 Females in Terlingua.
What is the Ratio of Females per 100 Males in Terlingua?
There are 156.67 Females per 100 Males in Terlingua.
What is the Median Population Age in Terlingua?
Median Population Age in Terlingua is 61.4 Years.
What is the Average Family Size in Terlingua
Average Family Size in Terlingua is 2.2 People.
What is the Average Household Size in Terlingua
Average Household Size in Terlingua is 1.4 People.
What is Per Capita Income in Terlingua?
Per Capita income in Terlingua is $21,510.
What is the Median Household income in Terlingua?
Median Household Income in Terlingua is $43,088.
What is Inequality or Gini Index in Terlingua?
Inequality or Gini Index in Terlingua is 0.30.
How Large is the Labor Force in Terlingua?
There are 68 People in the Labor Forcein in Terlingua.
What is the Percentage of People in the Labor Force in Terlingua?
63.6% of People are in the Labor Force in Terlingua.
What is the Unemployment Rate in Terlingua?
Unemployment Rate in Terlingua is 14.7%.