Cities with the Highest Percentage of Immigrants from Nicaragua in Texas
RELATED REPORTS & OPTIONS
Nicaragua
Texas
Compare Cities
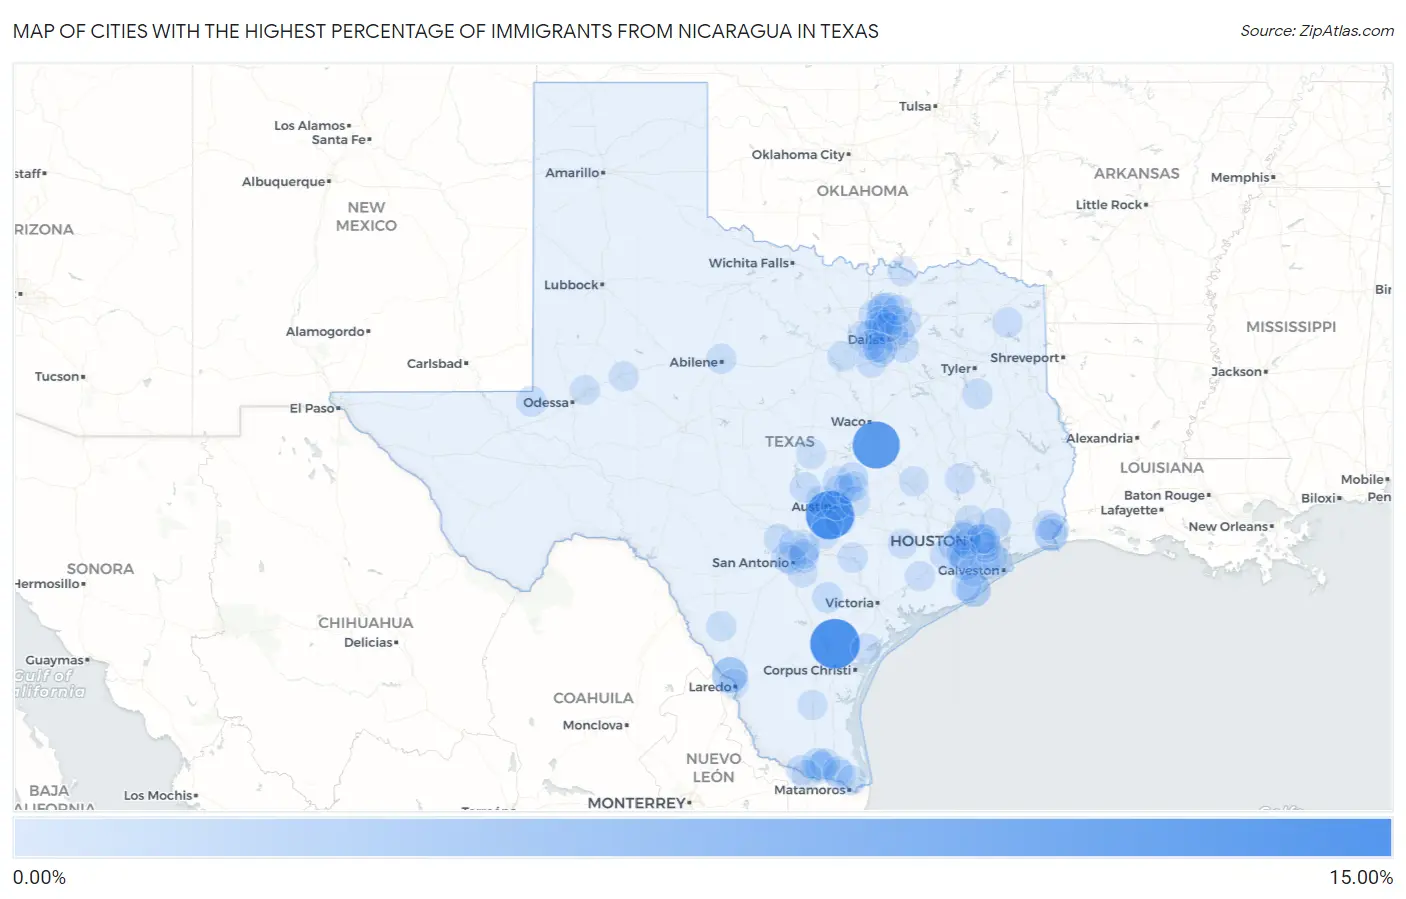
Map of Cities with the Highest Percentage of Immigrants from Nicaragua in Texas
0.00%
15.00%
Cities with the Highest Percentage of Immigrants from Nicaragua in Texas
| City | Nicaragua | vs State | vs National | |
| 1. | Tynan | 10.73% | 0.064%(+10.7)#-1 | 0.077%(+10.6)#0 |
| 2. | Manchaca | 10.00% | 0.064%(+9.93)#0 | 0.077%(+9.92)#1 |
| 3. | Lott | 9.37% | 0.064%(+9.30)#1 | 0.077%(+9.29)#2 |
| 4. | Ranchos Penitas West | 2.98% | 0.064%(+2.91)#2 | 0.077%(+2.90)#3 |
| 5. | Oyster Creek | 2.07% | 0.064%(+2.00)#3 | 0.077%(+1.99)#4 |
| 6. | Port Arthur | 1.36% | 0.064%(+1.30)#33 | 0.077%(+1.28)#889 |
| 7. | Sandy Point | 1.12% | 0.064%(+1.05)#34 | 0.077%(+1.04)#890 |
| 8. | Spring Valley Village | 1.09% | 0.064%(+1.03)#35 | 0.077%(+1.01)#891 |
| 9. | Rice Tracts | 1.01% | 0.064%(+0.949)#36 | 0.077%(+0.936)#892 |
| 10. | Dayton | 0.89% | 0.064%(+0.830)#37 | 0.077%(+0.817)#893 |
| 11. | Olivarez | 0.79% | 0.064%(+0.724)#38 | 0.077%(+0.711)#894 |
| 12. | San Carlos | 0.79% | 0.064%(+0.723)#39 | 0.077%(+0.709)#895 |
| 13. | Little Elm | 0.59% | 0.064%(+0.531)#40 | 0.077%(+0.518)#896 |
| 14. | Savannah | 0.57% | 0.064%(+0.502)#41 | 0.077%(+0.489)#897 |
| 15. | Lakeway | 0.53% | 0.064%(+0.467)#42 | 0.077%(+0.454)#898 |
| 16. | Mission Bend | 0.52% | 0.064%(+0.451)#43 | 0.077%(+0.438)#918 |
| 17. | Karnes City | 0.48% | 0.064%(+0.418)#44 | 0.077%(+0.405)#919 |
| 18. | Granger | 0.45% | 0.064%(+0.391)#45 | 0.077%(+0.377)#920 |
| 19. | Converse | 0.41% | 0.064%(+0.346)#53 | 0.077%(+0.333)#1,225 |
| 20. | Mustang Ridge | 0.41% | 0.064%(+0.343)#54 | 0.077%(+0.330)#1,226 |
| 21. | Kermit | 0.40% | 0.064%(+0.337)#55 | 0.077%(+0.324)#1,227 |
| 22. | Groves | 0.39% | 0.064%(+0.328)#56 | 0.077%(+0.315)#1,228 |
| 23. | Garden Ridge | 0.39% | 0.064%(+0.321)#57 | 0.077%(+0.308)#1,229 |
| 24. | Marble Falls | 0.37% | 0.064%(+0.304)#58 | 0.077%(+0.291)#1,230 |
| 25. | San Benito | 0.35% | 0.064%(+0.284)#59 | 0.077%(+0.270)#1,231 |
| 26. | Arcola | 0.35% | 0.064%(+0.282)#60 | 0.077%(+0.269)#1,232 |
| 27. | Round Rock | 0.32% | 0.064%(+0.257)#83 | 0.077%(+0.243)#1,613 |
| 28. | La Villa | 0.31% | 0.064%(+0.250)#84 | 0.077%(+0.236)#1,614 |
| 29. | Jacksonville | 0.28% | 0.064%(+0.220)#85 | 0.077%(+0.207)#1,615 |
| 30. | Steiner Ranch | 0.28% | 0.064%(+0.216)#86 | 0.077%(+0.203)#1,616 |
| 31. | Sienna | 0.28% | 0.064%(+0.213)#87 | 0.077%(+0.199)#1,617 |
| 32. | Gonzales | 0.26% | 0.064%(+0.201)#88 | 0.077%(+0.187)#1,618 |
| 33. | Bayside | 0.26% | 0.064%(+0.200)#89 | 0.077%(+0.187)#1,619 |
| 34. | Santa Fe | 0.24% | 0.064%(+0.179)#90 | 0.077%(+0.165)#1,620 |
| 35. | Corinth | 0.24% | 0.064%(+0.172)#91 | 0.077%(+0.158)#1,621 |
| 36. | Alvin | 0.23% | 0.064%(+0.167)#92 | 0.077%(+0.153)#1,622 |
| 37. | Jacinto City | 0.23% | 0.064%(+0.166)#93 | 0.077%(+0.152)#1,623 |
| 38. | Texas City | 0.22% | 0.064%(+0.157)#94 | 0.077%(+0.143)#1,624 |
| 39. | Prosper | 0.22% | 0.064%(+0.155)#95 | 0.077%(+0.142)#1,625 |
| 40. | Haltom City | 0.21% | 0.064%(+0.146)#96 | 0.077%(+0.133)#1,626 |
| 41. | Irving | 0.20% | 0.064%(+0.138)#97 | 0.077%(+0.125)#1,627 |
| 42. | Daingerfield | 0.20% | 0.064%(+0.136)#98 | 0.077%(+0.123)#1,628 |
| 43. | Bacliff | 0.19% | 0.064%(+0.130)#99 | 0.077%(+0.117)#1,629 |
| 44. | Huntsville | 0.18% | 0.064%(+0.114)#100 | 0.077%(+0.100)#1,630 |
| 45. | Houston | 0.18% | 0.064%(+0.113)#101 | 0.077%(+0.099)#1,631 |
| 46. | Leon Valley | 0.17% | 0.064%(+0.110)#102 | 0.077%(+0.097)#1,632 |
| 47. | Rosenberg | 0.17% | 0.064%(+0.107)#103 | 0.077%(+0.093)#1,633 |
| 48. | Carrollton | 0.17% | 0.064%(+0.106)#104 | 0.077%(+0.093)#1,663 |
| 49. | Abilene | 0.16% | 0.064%(+0.091)#105 | 0.077%(+0.078)#1,687 |
| 50. | Asherton | 0.16% | 0.064%(+0.091)#106 | 0.077%(+0.078)#1,688 |
| 51. | Kyle | 0.15% | 0.064%(+0.083)#107 | 0.077%(+0.069)#1,689 |
| 52. | Cresson | 0.14% | 0.064%(+0.076)#108 | 0.077%(+0.062)#1,690 |
| 53. | Deer Park | 0.14% | 0.064%(+0.074)#109 | 0.077%(+0.061)#1,691 |
| 54. | Seagoville | 0.13% | 0.064%(+0.065)#110 | 0.077%(+0.052)#1,692 |
| 55. | West University Place | 0.13% | 0.064%(+0.063)#111 | 0.077%(+0.050)#1,693 |
| 56. | Coppell | 0.12% | 0.064%(+0.056)#112 | 0.077%(+0.043)#1,694 |
| 57. | Pasadena | 0.12% | 0.064%(+0.055)#113 | 0.077%(+0.042)#1,695 |
| 58. | Venus | 0.12% | 0.064%(+0.051)#114 | 0.077%(+0.038)#1,696 |
| 59. | Mission | 0.11% | 0.064%(+0.046)#115 | 0.077%(+0.033)#1,697 |
| 60. | Cloverleaf | 0.11% | 0.064%(+0.041)#116 | 0.077%(+0.028)#1,698 |
| 61. | Wylie | 0.10% | 0.064%(+0.040)#117 | 0.077%(+0.026)#1,699 |
| 62. | Boerne | 0.10% | 0.064%(+0.039)#118 | 0.077%(+0.026)#1,700 |
| 63. | Cedar Hill | 0.10% | 0.064%(+0.039)#119 | 0.077%(+0.026)#1,701 |
| 64. | Lewisville | 0.10% | 0.064%(+0.039)#120 | 0.077%(+0.025)#1,702 |
| 65. | El Campo | 0.098% | 0.064%(+0.034)#121 | 0.077%(+0.021)#1,703 |
| 66. | Austin | 0.090% | 0.064%(+0.026)#122 | 0.077%(+0.013)#1,704 |
| 67. | Garland | 0.086% | 0.064%(+0.023)#123 | 0.077%(+0.009)#1,705 |
| 68. | Denison | 0.084% | 0.064%(+0.021)#124 | 0.077%(+0.007)#1,706 |
| 69. | Harlingen | 0.084% | 0.064%(+0.020)#125 | 0.077%(+0.007)#1,707 |
| 70. | Columbus | 0.081% | 0.064%(+0.018)#126 | 0.077%(+0.004)#1,708 |
| 71. | Elmendorf | 0.081% | 0.064%(+0.017)#127 | 0.077%(+0.004)#1,709 |
| 72. | Georgetown | 0.079% | 0.064%(+0.016)#128 | 0.077%(+0.002)#1,710 |
| 73. | Dallas | 0.075% | 0.064%(+0.011)#129 | 0.077%(-0.002)#1,711 |
| 74. | San Marcos | 0.073% | 0.064%(+0.009)#130 | 0.077%(-0.004)#1,712 |
| 75. | Bedford | 0.073% | 0.064%(+0.009)#131 | 0.077%(-0.004)#1,713 |
| 76. | Duncanville | 0.072% | 0.064%(+0.008)#132 | 0.077%(-0.005)#1,714 |
| 77. | Plano | 0.072% | 0.064%(+0.008)#133 | 0.077%(-0.005)#1,715 |
| 78. | Hidalgo | 0.071% | 0.064%(+0.007)#134 | 0.077%(-0.006)#1,716 |
| 79. | Addison | 0.070% | 0.064%(+0.007)#135 | 0.077%(-0.007)#1,717 |
| 80. | Arlington | 0.069% | 0.064%(+0.005)#136 | 0.077%(-0.008)#1,718 |
| 81. | Brownsville | 0.068% | 0.064%(+0.005)#137 | 0.077%(-0.009)#1,719 |
| 82. | Lampasas | 0.068% | 0.064%(+0.004)#138 | 0.077%(-0.009)#1,720 |
| 83. | Mckinney | 0.067% | 0.064%(+0.003)#139 | 0.077%(-0.010)#1,721 |
| 84. | Bryan | 0.065% | 0.064%(+0.001)#140 | 0.077%(-0.012)#1,722 |
| 85. | Channelview | 0.065% | 0.064%(+0.001)#141 | 0.077%(-0.012)#1,723 |
| 86. | Missouri City | 0.064% | 0.064%(+0.001)#142 | 0.077%(-0.013)#1,724 |
| 87. | Hutto | 0.064% | 0.064%(+0.001)#143 | 0.077%(-0.013)#1,725 |
| 88. | San Antonio | 0.064% | 0.064%(+0.000)#144 | 0.077%(-0.013)#1,726 |
| 89. | Big Spring | 0.062% | 0.064%(-0.002)#145 | 0.077%(-0.015)#1,727 |
| 90. | Timberwood Park | 0.061% | 0.064%(-0.002)#146 | 0.077%(-0.016)#1,728 |
| 91. | Midland | 0.056% | 0.064%(-0.008)#147 | 0.077%(-0.021)#1,729 |
| 92. | Central Gardens | 0.055% | 0.064%(-0.009)#148 | 0.077%(-0.022)#1,730 |
| 93. | Universal City | 0.051% | 0.064%(-0.013)#149 | 0.077%(-0.027)#1,731 |
| 94. | Elgin | 0.050% | 0.064%(-0.014)#150 | 0.077%(-0.027)#1,732 |
| 95. | Laredo | 0.050% | 0.064%(-0.014)#151 | 0.077%(-0.027)#1,733 |
| 96. | Taylor | 0.049% | 0.064%(-0.015)#152 | 0.077%(-0.028)#1,734 |
| 97. | Spring | 0.048% | 0.064%(-0.015)#153 | 0.077%(-0.029)#1,735 |
| 98. | Falfurrias | 0.046% | 0.064%(-0.018)#154 | 0.077%(-0.031)#1,736 |
| 99. | Grand Prairie | 0.043% | 0.064%(-0.021)#155 | 0.077%(-0.034)#1,737 |
| 100. | Lake Jackson | 0.043% | 0.064%(-0.021)#156 | 0.077%(-0.034)#1,738 |
Common Questions
What are the Top 10 Cities with the Highest Percentage of Immigrants from Nicaragua in Texas?
Top 10 Cities with the Highest Percentage of Immigrants from Nicaragua in Texas are:
#1
10.73%
#2
10.00%
#3
9.37%
#4
2.98%
#5
2.07%
#6
1.36%
#7
1.12%
#8
1.09%
#9
0.89%
#10
0.79%
What city has the Highest Percentage of Immigrants from Nicaragua in Texas?
Tynan has the Highest Percentage of Immigrants from Nicaragua in Texas with 10.73%.
What is the Percentage of Immigrants from Nicaragua in the State of Texas?
Percentage of Immigrants from Nicaragua in Texas is 0.064%.
What is the Percentage of Immigrants from Nicaragua in the United States?
Percentage of Immigrants from Nicaragua in the United States is 0.077%.