Kirbyville, TX
Kirbyville Map
Kirbyville Overview
2,340
TOTAL POPULATION
1,127
MALE POPULATION
1,213
FEMALE POPULATION
92.91
MALES / 100 FEMALES
107.63
FEMALES / 100 MALES
36.3
MEDIAN AGE
3.4
AVG FAMILY SIZE
2.6
AVG HOUSEHOLD SIZE
$19,284
PER CAPITA INCOME
$35,556
AVG FAMILY INCOME
$30,152
AVG HOUSEHOLD INCOME
38.6%
WAGE / INCOME GAP [ % ]
61.4¢/ $1
WAGE / INCOME GAP [ $ ]
0.52
INEQUALITY / GINI INDEX
954
LABOR FORCE [ PEOPLE ]
50.9%
PERCENT IN LABOR FORCE
23.6%
UNEMPLOYMENT RATE
Kirbyville Zip Codes
Kirbyville Area Codes
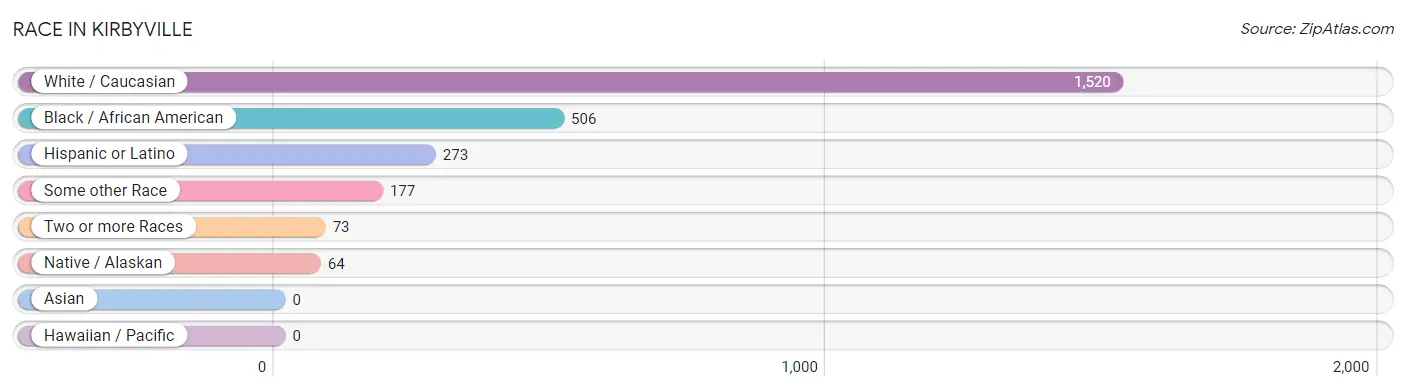
Race in Kirbyville
The most populous races in Kirbyville are White / Caucasian (1,520 | 65.0%), Black / African American (506 | 21.6%), and Hispanic or Latino (273 | 11.7%).
| Race | # Population | % Population |
| Asian | 0 | 0.0% |
| Black / African American | 506 | 21.6% |
| Hawaiian / Pacific | 0 | 0.0% |
| Hispanic or Latino | 273 | 11.7% |
| Native / Alaskan | 64 | 2.7% |
| White / Caucasian | 1,520 | 65.0% |
| Two or more Races | 73 | 3.1% |
| Some other Race | 177 | 7.6% |
| Total | 2,340 | 100.0% |
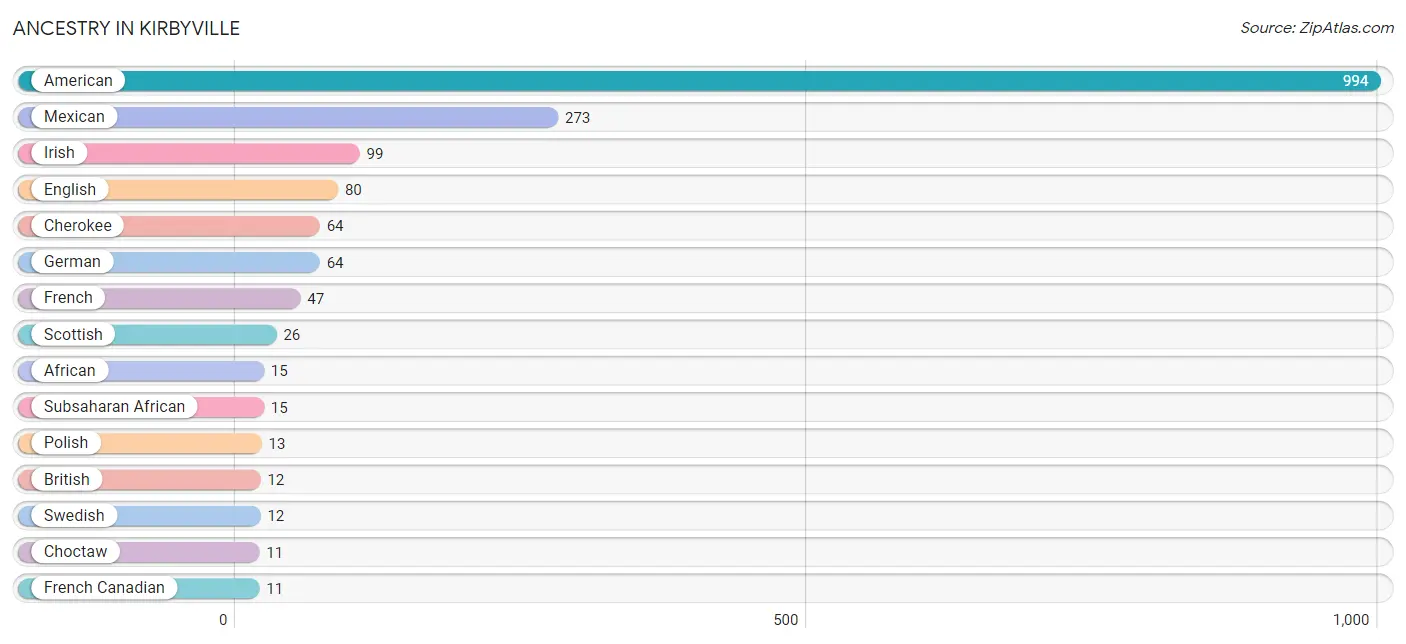
Ancestry in Kirbyville
The most populous ancestries reported in Kirbyville are American (994 | 42.5%), Mexican (273 | 11.7%), Irish (99 | 4.2%), English (80 | 3.4%), and Cherokee (64 | 2.7%), together accounting for 64.5% of all Kirbyville residents.
| Ancestry | # Population | % Population |
| African | 15 | 0.6% |
| American | 994 | 42.5% |
| British | 12 | 0.5% |
| Cherokee | 64 | 2.7% |
| Choctaw | 11 | 0.5% |
| Dutch | 6 | 0.3% |
| English | 80 | 3.4% |
| European | 6 | 0.3% |
| French | 47 | 2.0% |
| French American Indian | 1 | 0.0% |
| French Canadian | 11 | 0.5% |
| German | 64 | 2.7% |
| Irish | 99 | 4.2% |
| Italian | 8 | 0.3% |
| Mexican | 273 | 11.7% |
| Polish | 13 | 0.6% |
| Portuguese | 4 | 0.2% |
| Scottish | 26 | 1.1% |
| Subsaharan African | 15 | 0.6% |
| Swedish | 12 | 0.5% | View All 20 Rows |
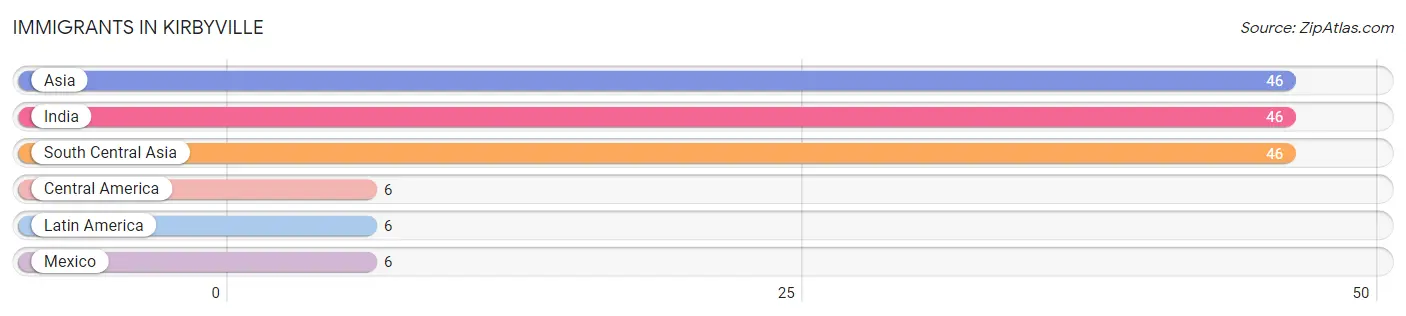
Immigrants in Kirbyville
The most numerous immigrant groups reported in Kirbyville came from Asia (46 | 2.0%), India (46 | 2.0%), South Central Asia (46 | 2.0%), Central America (6 | 0.3%), and Latin America (6 | 0.3%), together accounting for 6.4% of all Kirbyville residents.
| Immigration Origin | # Population | % Population |
| Asia | 46 | 2.0% |
| Central America | 6 | 0.3% |
| India | 46 | 2.0% |
| Latin America | 6 | 0.3% |
| Mexico | 6 | 0.3% |
| South Central Asia | 46 | 2.0% | View All 6 Rows |
Sex and Age in Kirbyville
Sex and Age in Kirbyville
The most populous age groups in Kirbyville are Under 5 Years (138 | 12.2%) for men and 60 to 64 Years (135 | 11.1%) for women.
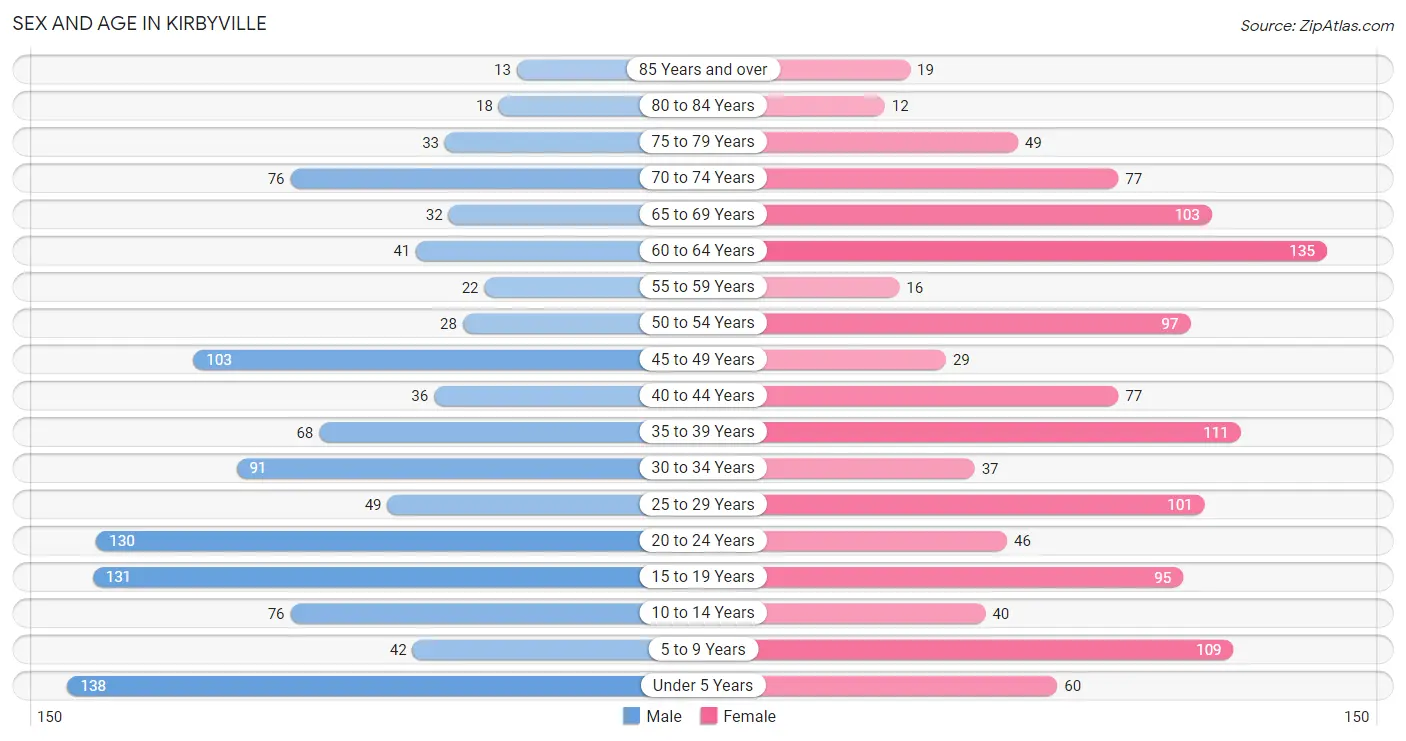
| Age Bracket | Male | Female |
| Under 5 Years | 138 (12.2%) | 60 (5.0%) |
| 5 to 9 Years | 42 (3.7%) | 109 (9.0%) |
| 10 to 14 Years | 76 (6.7%) | 40 (3.3%) |
| 15 to 19 Years | 131 (11.6%) | 95 (7.8%) |
| 20 to 24 Years | 130 (11.5%) | 46 (3.8%) |
| 25 to 29 Years | 49 (4.3%) | 101 (8.3%) |
| 30 to 34 Years | 91 (8.1%) | 37 (3.0%) |
| 35 to 39 Years | 68 (6.0%) | 111 (9.1%) |
| 40 to 44 Years | 36 (3.2%) | 77 (6.4%) |
| 45 to 49 Years | 103 (9.1%) | 29 (2.4%) |
| 50 to 54 Years | 28 (2.5%) | 97 (8.0%) |
| 55 to 59 Years | 22 (1.9%) | 16 (1.3%) |
| 60 to 64 Years | 41 (3.6%) | 135 (11.1%) |
| 65 to 69 Years | 32 (2.8%) | 103 (8.5%) |
| 70 to 74 Years | 76 (6.7%) | 77 (6.4%) |
| 75 to 79 Years | 33 (2.9%) | 49 (4.0%) |
| 80 to 84 Years | 18 (1.6%) | 12 (1.0%) |
| 85 Years and over | 13 (1.1%) | 19 (1.6%) |
| Total | 1,127 (100.0%) | 1,213 (100.0%) |
Families and Households in Kirbyville
Median Family Size in Kirbyville
The median family size in Kirbyville is 3.37 persons per family, with single female/mother families (187 | 36.0%) accounting for the largest median family size of 4.28 persons per family. On the other hand, single male/father families (54 | 10.4%) represent the smallest median family size with 2.59 persons per family.
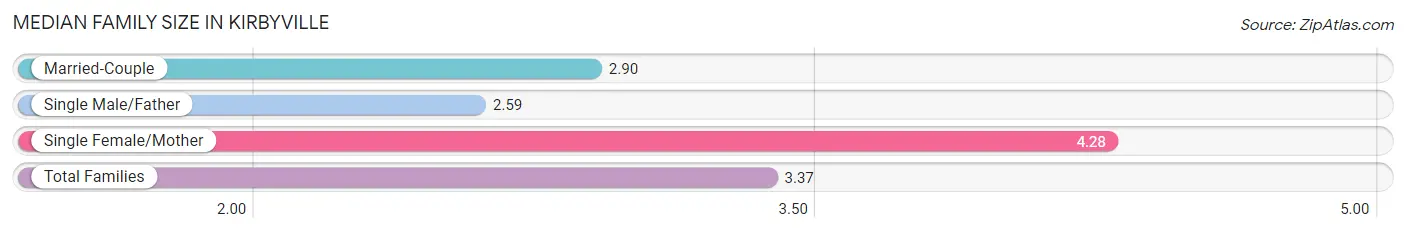
| Family Type | # Families | Family Size |
| Married-Couple | 279 (53.6%) | 2.90 |
| Single Male/Father | 54 (10.4%) | 2.59 |
| Single Female/Mother | 187 (36.0%) | 4.28 |
| Total Families | 520 (100.0%) | 3.37 |
Median Household Size in Kirbyville
The median household size in Kirbyville is 2.57 persons per household, with single male/father households (54 | 6.2%) accounting for the largest median household size of 4.46 persons per household. non-family households (357 | 40.7%) represent the smallest median household size with 1.11 persons per household.
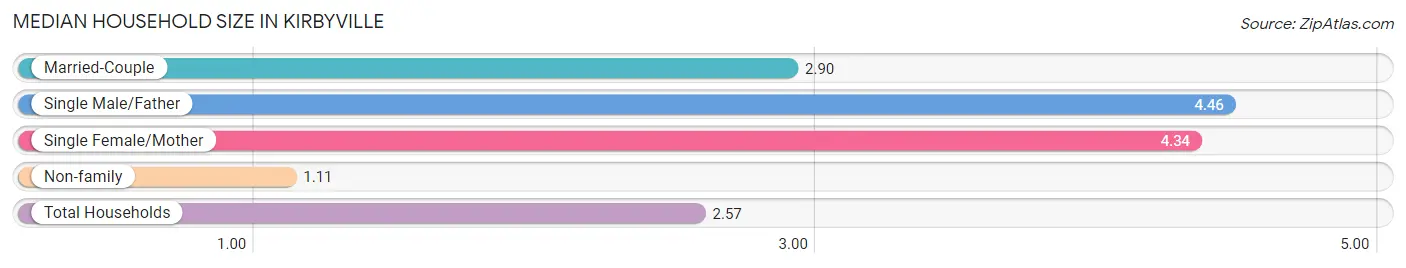
| Household Type | # Households | Household Size |
| Married-Couple | 279 (31.8%) | 2.90 |
| Single Male/Father | 54 (6.2%) | 4.46 |
| Single Female/Mother | 187 (21.3%) | 4.34 |
| Non-family | 357 (40.7%) | 1.11 |
| Total Households | 877 (100.0%) | 2.57 |
Household Size by Marriage Status in Kirbyville
Out of a total of 877 households in Kirbyville, 520 (59.3%) are family households, while 357 (40.7%) are nonfamily households. The most numerous type of family households are 2-person households, comprising 176, and the most common type of nonfamily households are 1-person households, comprising 314.
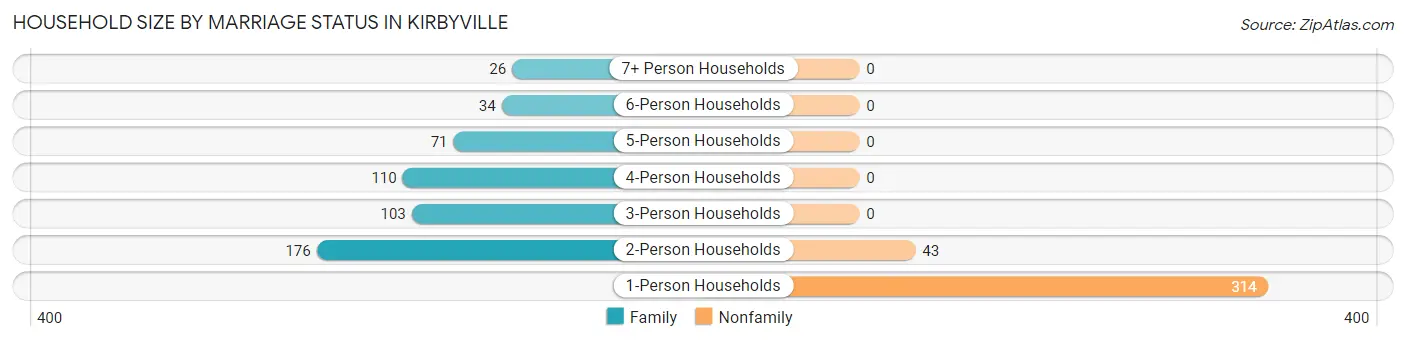
| Household Size | Family Households | Nonfamily Households |
| 1-Person Households | - | 314 (35.8%) |
| 2-Person Households | 176 (20.1%) | 43 (4.9%) |
| 3-Person Households | 103 (11.7%) | 0 (0.0%) |
| 4-Person Households | 110 (12.5%) | 0 (0.0%) |
| 5-Person Households | 71 (8.1%) | 0 (0.0%) |
| 6-Person Households | 34 (3.9%) | 0 (0.0%) |
| 7+ Person Households | 26 (3.0%) | 0 (0.0%) |
| Total | 520 (59.3%) | 357 (40.7%) |
Female Fertility in Kirbyville
Fertility by Age in Kirbyville
Average fertility rate in Kirbyville is 107.0 births per 1,000 women. Women in the age bracket of 20 to 34 years have the highest fertility rate with 174.0 births per 1,000 women. Women in the age bracket of 20 to 34 years acount for 60.4% of all women with births.
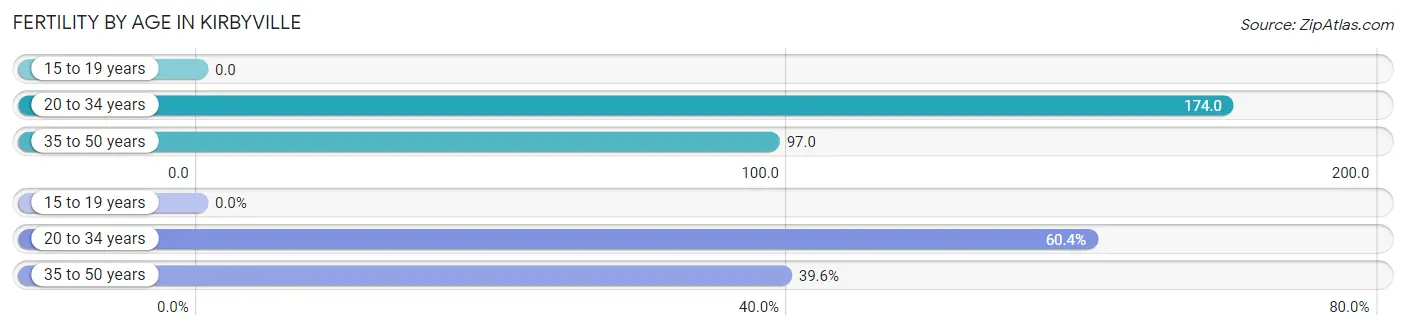
| Age Bracket | Women with Births | Births / 1,000 Women |
| 15 to 19 years | 0 (0.0%) | 0.0 |
| 20 to 34 years | 32 (60.4%) | 174.0 |
| 35 to 50 years | 21 (39.6%) | 97.0 |
| Total | 53 (100.0%) | 107.0 |
Fertility by Age by Marriage Status in Kirbyville
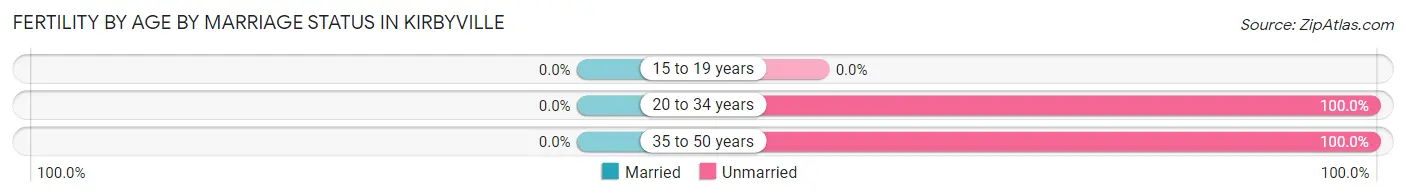
| Age Bracket | Married | Unmarried |
| 15 to 19 years | 0 (0.0%) | 0 (0.0%) |
| 20 to 34 years | 0 (0.0%) | 32 (100.0%) |
| 35 to 50 years | 0 (0.0%) | 21 (100.0%) |
| Total | 0 (0.0%) | 53 (100.0%) |
Fertility by Education in Kirbyville
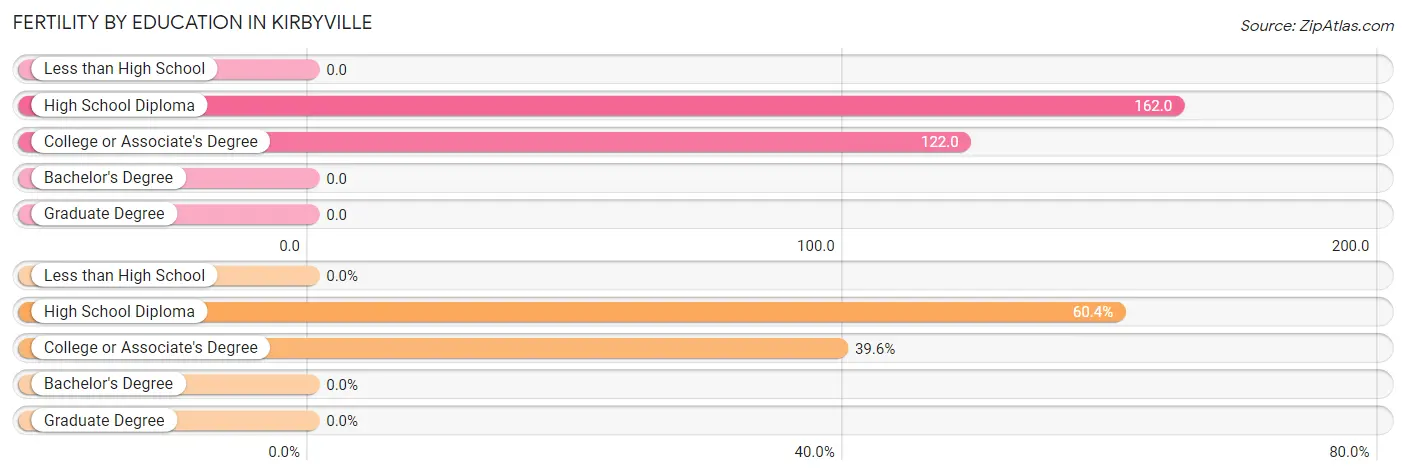
| Educational Attainment | Women with Births | Births / 1,000 Women |
| Less than High School | 0 (0.0%) | 0.0 |
| High School Diploma | 32 (60.4%) | 162.0 |
| College or Associate's Degree | 21 (39.6%) | 122.0 |
| Bachelor's Degree | 0 (0.0%) | 0.0 |
| Graduate Degree | 0 (0.0%) | 0.0 |
| Total | 53 (100.0%) | 107.0 |
Fertility by Education by Marriage Status in Kirbyville
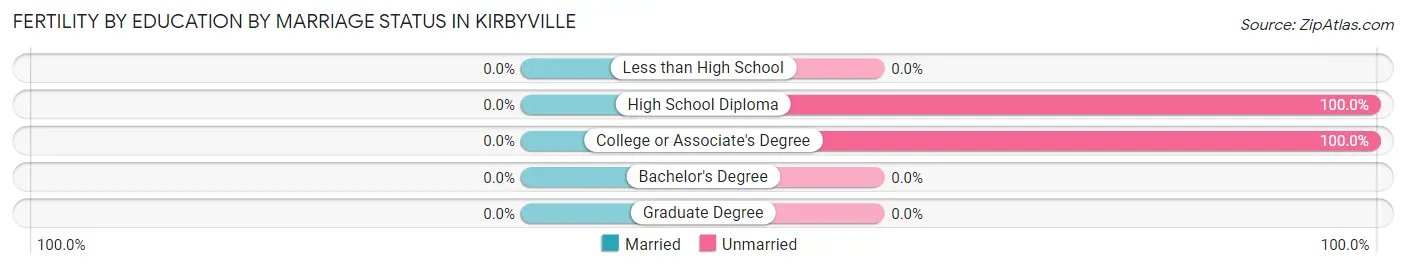
| Educational Attainment | Married | Unmarried |
| Less than High School | 0 (0.0%) | 0 (0.0%) |
| High School Diploma | 0 (0.0%) | 32 (100.0%) |
| College or Associate's Degree | 0 (0.0%) | 21 (100.0%) |
| Bachelor's Degree | 0 (0.0%) | 0 (0.0%) |
| Graduate Degree | 0 (0.0%) | 0 (0.0%) |
| Total | 0 (0.0%) | 53 (100.0%) |
Income in Kirbyville
Income Overview in Kirbyville
Per Capita Income in Kirbyville is $19,284, while median incomes of families and households are $35,556 and $30,152 respectively.
| Characteristic | Number | Measure |
| Per Capita Income | 2,340 | $19,284 |
| Median Family Income | 520 | $35,556 |
| Mean Family Income | 520 | $59,599 |
| Median Household Income | 877 | $30,152 |
| Mean Household Income | 877 | $50,972 |
| Income Deficit | 520 | $0 |
| Wage / Income Gap (%) | 2,340 | 38.57% |
| Wage / Income Gap ($) | 2,340 | 61.43¢ per $1 |
| Gini / Inequality Index | 2,340 | 0.52 |
Earnings by Sex in Kirbyville
Average Earnings in Kirbyville are $25,686, $27,604 for men and $16,956 for women, a difference of 38.6%.
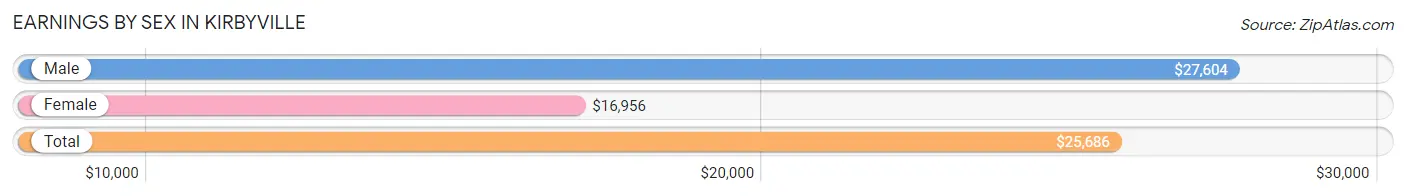
| Sex | Number | Average Earnings |
| Male | 449 (55.3%) | $27,604 |
| Female | 363 (44.7%) | $16,956 |
| Total | 812 (100.0%) | $25,686 |
Earnings by Sex by Income Bracket in Kirbyville
The most common earnings brackets in Kirbyville are $100,000+ for men (78 | 17.4%) and $15,000 to $17,499 for women (62 | 17.1%).
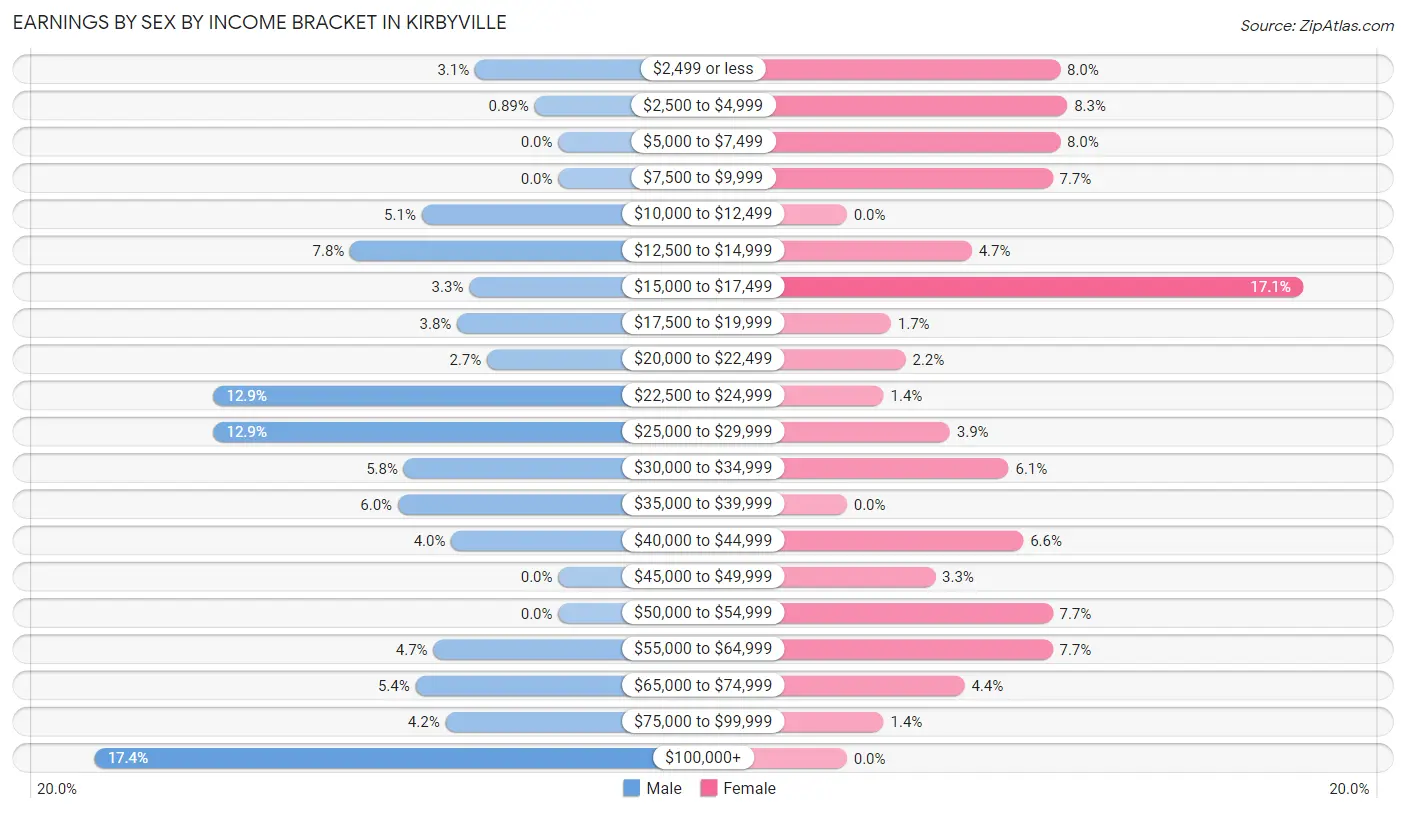
| Income | Male | Female |
| $2,499 or less | 14 (3.1%) | 29 (8.0%) |
| $2,500 to $4,999 | 4 (0.9%) | 30 (8.3%) |
| $5,000 to $7,499 | 0 (0.0%) | 29 (8.0%) |
| $7,500 to $9,999 | 0 (0.0%) | 28 (7.7%) |
| $10,000 to $12,499 | 23 (5.1%) | 0 (0.0%) |
| $12,500 to $14,999 | 35 (7.8%) | 17 (4.7%) |
| $15,000 to $17,499 | 15 (3.3%) | 62 (17.1%) |
| $17,500 to $19,999 | 17 (3.8%) | 6 (1.7%) |
| $20,000 to $22,499 | 12 (2.7%) | 8 (2.2%) |
| $22,500 to $24,999 | 58 (12.9%) | 5 (1.4%) |
| $25,000 to $29,999 | 58 (12.9%) | 14 (3.9%) |
| $30,000 to $34,999 | 26 (5.8%) | 22 (6.1%) |
| $35,000 to $39,999 | 27 (6.0%) | 0 (0.0%) |
| $40,000 to $44,999 | 18 (4.0%) | 24 (6.6%) |
| $45,000 to $49,999 | 0 (0.0%) | 12 (3.3%) |
| $50,000 to $54,999 | 0 (0.0%) | 28 (7.7%) |
| $55,000 to $64,999 | 21 (4.7%) | 28 (7.7%) |
| $65,000 to $74,999 | 24 (5.3%) | 16 (4.4%) |
| $75,000 to $99,999 | 19 (4.2%) | 5 (1.4%) |
| $100,000+ | 78 (17.4%) | 0 (0.0%) |
| Total | 449 (100.0%) | 363 (100.0%) |
Earnings by Sex by Educational Attainment in Kirbyville
Average earnings in Kirbyville are $36,343 for men and $17,298 for women, a difference of 52.4%. Men with an educational attainment of high school diploma enjoy the highest average annual earnings of $35,185, while those with less than high school education earn the least with $24,292. Women with an educational attainment of bachelor's degree earn the most with the average annual earnings of $66,458, while those with college or associate's degree education have the smallest earnings of $16,133.
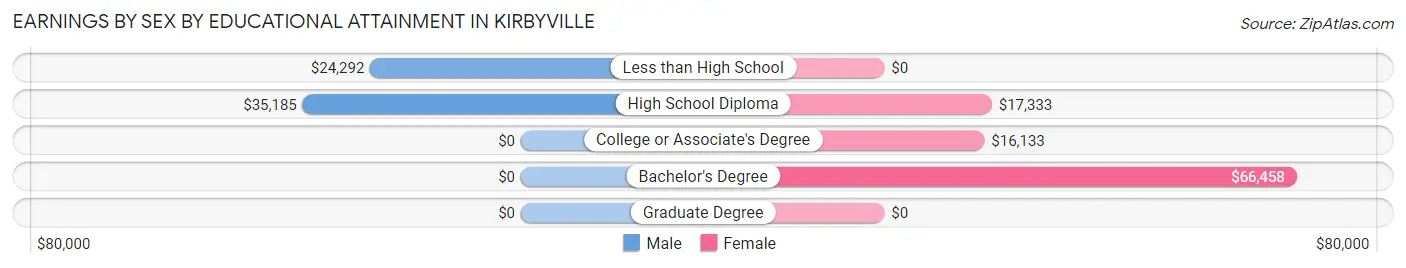
| Educational Attainment | Male Income | Female Income |
| Less than High School | $24,292 | $0 |
| High School Diploma | $35,185 | $17,333 |
| College or Associate's Degree | - | - |
| Bachelor's Degree | - | - |
| Graduate Degree | - | - |
| Total | $36,343 | $17,298 |
Family Income in Kirbyville
Family Income Brackets in Kirbyville
According to the Kirbyville family income data, there are 118 families falling into the $25,000 to $34,999 income range, which is the most common income bracket and makes up 22.7% of all families.
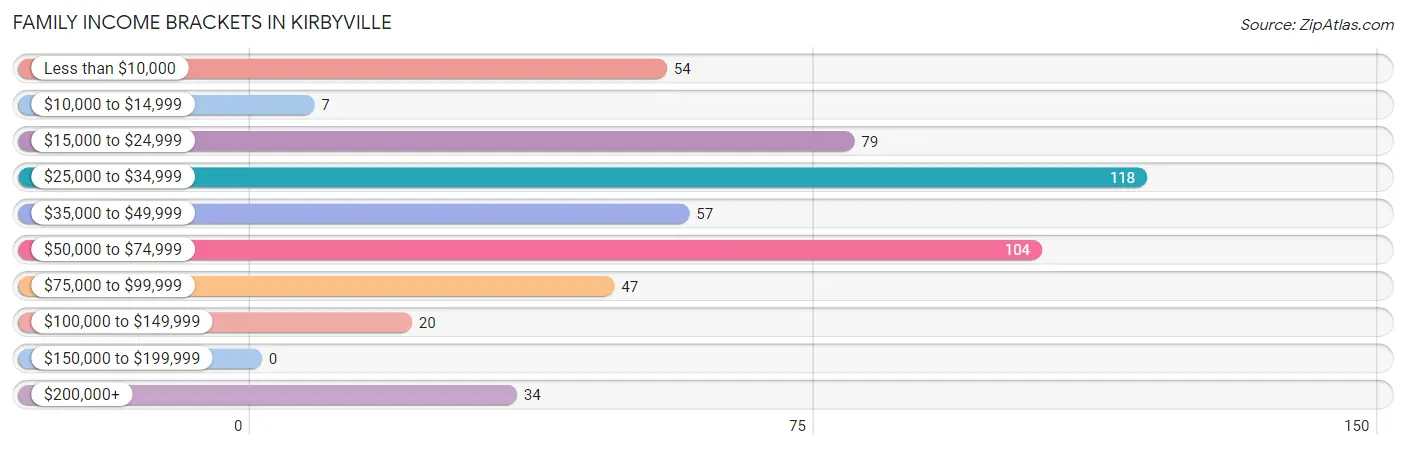
| Income Bracket | # Families | % Families |
| Less than $10,000 | 54 | 10.4% |
| $10,000 to $14,999 | 7 | 1.3% |
| $15,000 to $24,999 | 79 | 15.2% |
| $25,000 to $34,999 | 118 | 22.7% |
| $35,000 to $49,999 | 57 | 11.0% |
| $50,000 to $74,999 | 104 | 20.0% |
| $75,000 to $99,999 | 47 | 9.0% |
| $100,000 to $149,999 | 20 | 3.8% |
| $150,000 to $199,999 | 0 | 0.0% |
| $200,000+ | 34 | 6.5% |
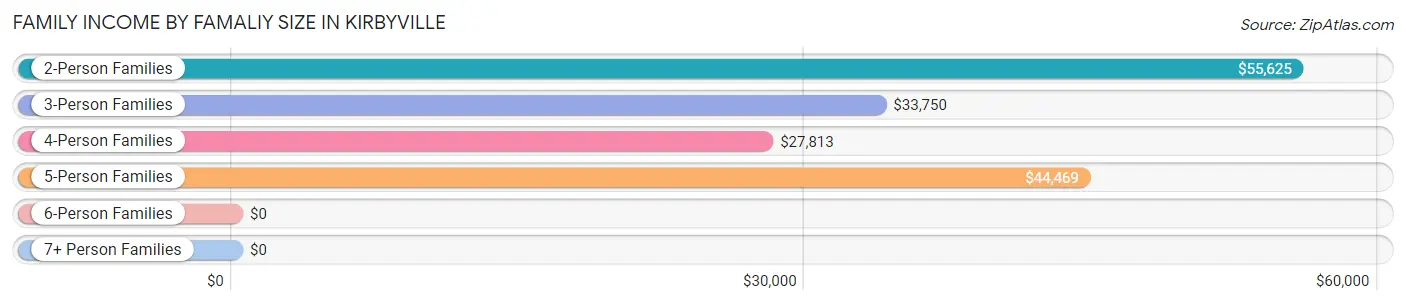
Family Income by Famaliy Size in Kirbyville
2-person families (176 | 33.9%) account for the highest median family income in Kirbyville with $55,625 per family, while 2-person families (176 | 33.9%) have the highest median income of $27,812 per family member.
| Income Bracket | # Families | Median Income |
| 2-Person Families | 176 (33.9%) | $55,625 |
| 3-Person Families | 178 (34.2%) | $33,750 |
| 4-Person Families | 63 (12.1%) | $27,813 |
| 5-Person Families | 71 (13.7%) | $44,469 |
| 6-Person Families | 6 (1.1%) | $0 |
| 7+ Person Families | 26 (5.0%) | $0 |
| Total | 520 (100.0%) | $35,556 |
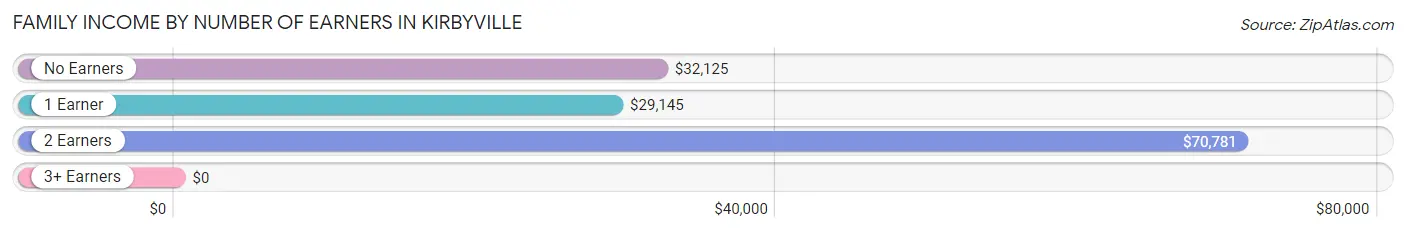
Family Income by Number of Earners in Kirbyville
| Number of Earners | # Families | Median Income |
| No Earners | 134 (25.8%) | $32,125 |
| 1 Earner | 274 (52.7%) | $29,145 |
| 2 Earners | 111 (21.3%) | $70,781 |
| 3+ Earners | 1 (0.2%) | $0 |
| Total | 520 (100.0%) | $35,556 |
Household Income in Kirbyville
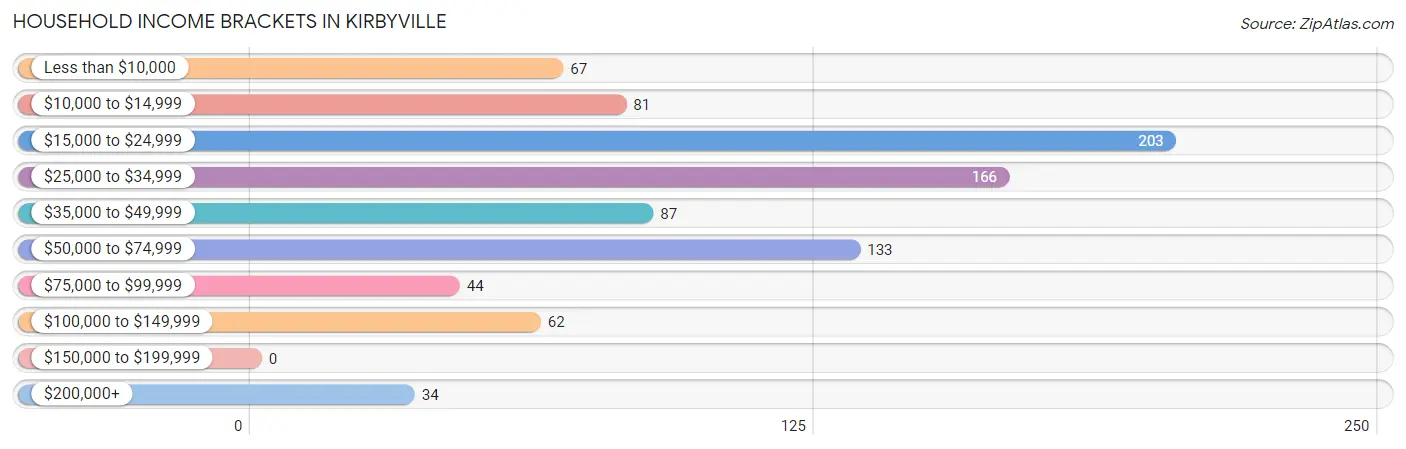
Household Income Brackets in Kirbyville
With 203 households falling in the category, the $15,000 to $24,999 income range is the most frequent in Kirbyville, accounting for 23.2% of all households.
| Income Bracket | # Households | % Households |
| Less than $10,000 | 67 | 7.6% |
| $10,000 to $14,999 | 81 | 9.2% |
| $15,000 to $24,999 | 203 | 23.1% |
| $25,000 to $34,999 | 166 | 18.9% |
| $35,000 to $49,999 | 87 | 9.9% |
| $50,000 to $74,999 | 133 | 15.2% |
| $75,000 to $99,999 | 44 | 5.0% |
| $100,000 to $149,999 | 62 | 7.1% |
| $150,000 to $199,999 | 0 | 0.0% |
| $200,000+ | 34 | 3.9% |
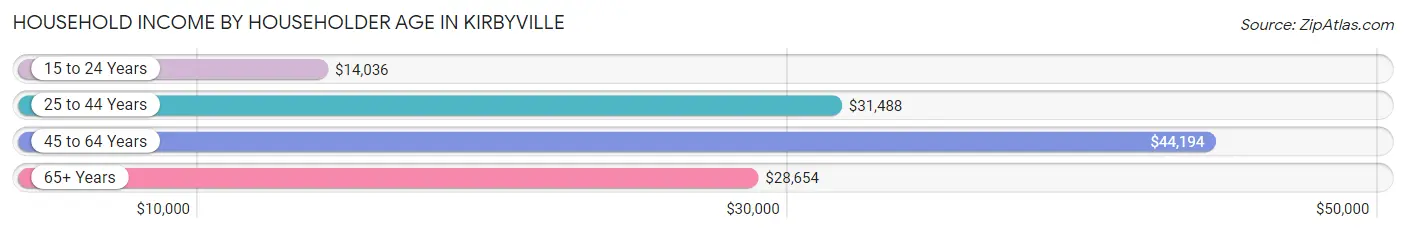
Household Income by Householder Age in Kirbyville
The median household income in Kirbyville is $30,152, with the highest median household income of $44,194 found in the 45 to 64 years age bracket for the primary householder. A total of 295 households (33.6%) fall into this category. Meanwhile, the 15 to 24 years age bracket for the primary householder has the lowest median household income of $14,036, with 69 households (7.9%) in this group.
| Income Bracket | # Households | Median Income |
| 15 to 24 Years | 69 (7.9%) | $14,036 |
| 25 to 44 Years | 251 (28.6%) | $31,488 |
| 45 to 64 Years | 295 (33.6%) | $44,194 |
| 65+ Years | 262 (29.9%) | $28,654 |
| Total | 877 (100.0%) | $30,152 |
Poverty in Kirbyville
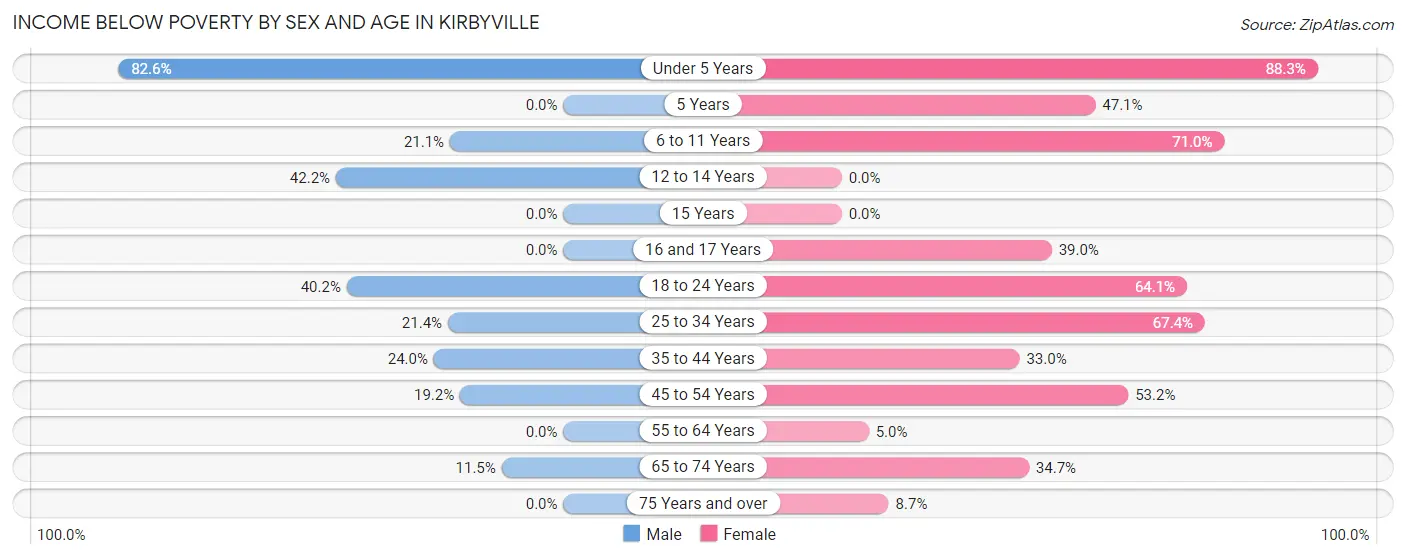
Income Below Poverty by Sex and Age in Kirbyville
With 28.9% poverty level for males and 42.1% for females among the residents of Kirbyville, under 5 year old males and under 5 year old females are the most vulnerable to poverty, with 114 males (82.6%) and 53 females (88.3%) in their respective age groups living below the poverty level.
| Age Bracket | Male | Female |
| Under 5 Years | 114 (82.6%) | 53 (88.3%) |
| 5 Years | 0 (0.0%) | 8 (47.1%) |
| 6 to 11 Years | 8 (21.0%) | 71 (71.0%) |
| 12 to 14 Years | 19 (42.2%) | 0 (0.0%) |
| 15 Years | 0 (0.0%) | 0 (0.0%) |
| 16 and 17 Years | 0 (0.0%) | 30 (39.0%) |
| 18 to 24 Years | 76 (40.2%) | 41 (64.1%) |
| 25 to 34 Years | 30 (21.4%) | 93 (67.4%) |
| 35 to 44 Years | 25 (24.0%) | 62 (33.0%) |
| 45 to 54 Years | 23 (19.2%) | 67 (53.2%) |
| 55 to 64 Years | 0 (0.0%) | 7 (5.0%) |
| 65 to 74 Years | 11 (11.5%) | 58 (34.7%) |
| 75 Years and over | 0 (0.0%) | 6 (8.7%) |
| Total | 306 (28.9%) | 496 (42.1%) |
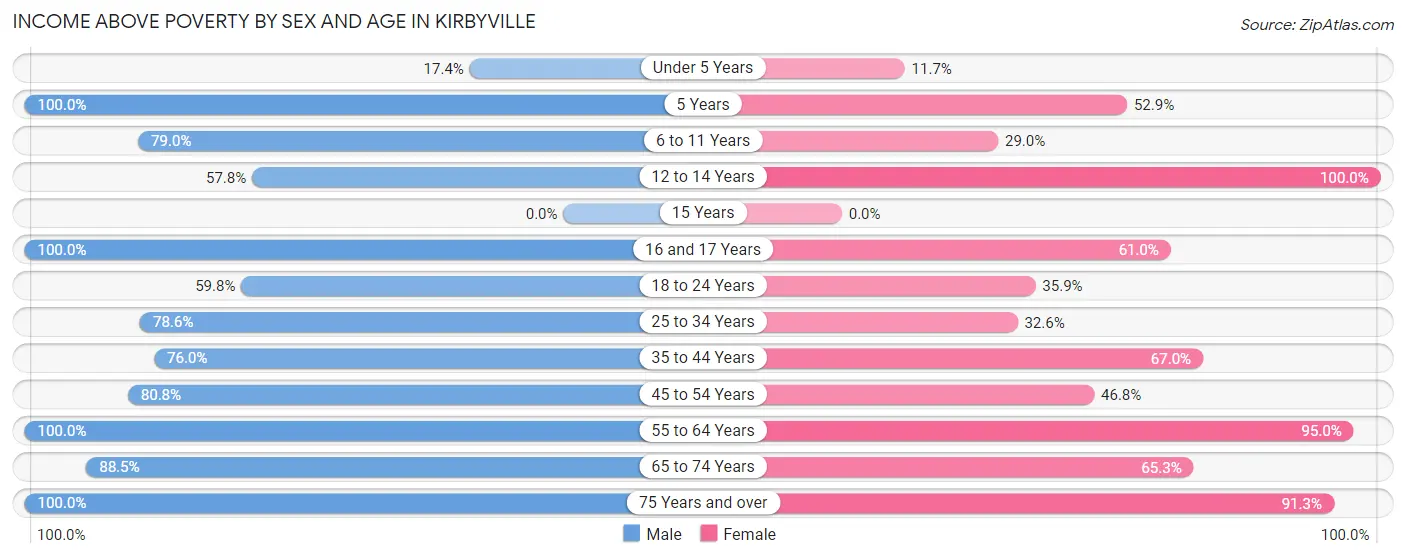
Income Above Poverty by Sex and Age in Kirbyville
According to the poverty statistics in Kirbyville, males aged 5 years and females aged 12 to 14 years are the age groups that are most secure financially, with 100.0% of males and 100.0% of females in these age groups living above the poverty line.
| Age Bracket | Male | Female |
| Under 5 Years | 24 (17.4%) | 7 (11.7%) |
| 5 Years | 14 (100.0%) | 9 (52.9%) |
| 6 to 11 Years | 30 (78.9%) | 29 (29.0%) |
| 12 to 14 Years | 26 (57.8%) | 32 (100.0%) |
| 15 Years | 0 (0.0%) | 0 (0.0%) |
| 16 and 17 Years | 72 (100.0%) | 47 (61.0%) |
| 18 to 24 Years | 113 (59.8%) | 23 (35.9%) |
| 25 to 34 Years | 110 (78.6%) | 45 (32.6%) |
| 35 to 44 Years | 79 (76.0%) | 126 (67.0%) |
| 45 to 54 Years | 97 (80.8%) | 59 (46.8%) |
| 55 to 64 Years | 63 (100.0%) | 133 (95.0%) |
| 65 to 74 Years | 85 (88.5%) | 109 (65.3%) |
| 75 Years and over | 39 (100.0%) | 63 (91.3%) |
| Total | 752 (71.1%) | 682 (57.9%) |
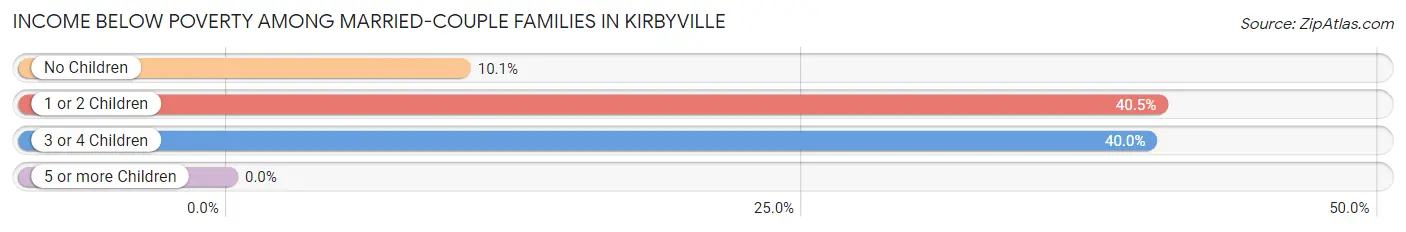
Income Below Poverty Among Married-Couple Families in Kirbyville
The poverty statistics for married-couple families in Kirbyville show that 15.8% or 44 of the total 279 families live below the poverty line. Families with 1 or 2 children have the highest poverty rate of 40.5%, comprising of 17 families. On the other hand, families with no children have the lowest poverty rate of 10.1%, which includes 23 families.
| Children | Above Poverty | Below Poverty |
| No Children | 204 (89.9%) | 23 (10.1%) |
| 1 or 2 Children | 25 (59.5%) | 17 (40.5%) |
| 3 or 4 Children | 6 (60.0%) | 4 (40.0%) |
| 5 or more Children | 0 (0.0%) | 0 (0.0%) |
| Total | 235 (84.2%) | 44 (15.8%) |
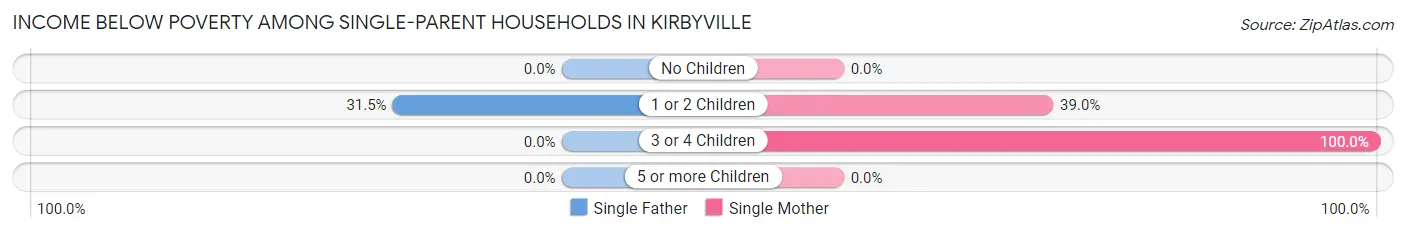
Income Below Poverty Among Single-Parent Households in Kirbyville
According to the poverty data in Kirbyville, 31.5% or 17 single-father households and 46.5% or 87 single-mother households are living below the poverty line. Among single-father households, those with 1 or 2 children have the highest poverty rate, with 17 households (31.5%) experiencing poverty. Likewise, among single-mother households, those with 3 or 4 children have the highest poverty rate, with 39 households (100.0%) falling below the poverty line.
| Children | Single Father | Single Mother |
| No Children | 0 (0.0%) | 0 (0.0%) |
| 1 or 2 Children | 17 (31.5%) | 48 (39.0%) |
| 3 or 4 Children | 0 (0.0%) | 39 (100.0%) |
| 5 or more Children | 0 (0.0%) | 0 (0.0%) |
| Total | 17 (31.5%) | 87 (46.5%) |
Income Below Poverty Among Married-Couple vs Single-Parent Households in Kirbyville
The poverty data for Kirbyville shows that 44 of the married-couple family households (15.8%) and 104 of the single-parent households (43.1%) are living below the poverty level. Within the married-couple family households, those with 1 or 2 children have the highest poverty rate, with 17 households (40.5%) falling below the poverty line. Among the single-parent households, those with 3 or 4 children have the highest poverty rate, with 39 household (100.0%) living below poverty.
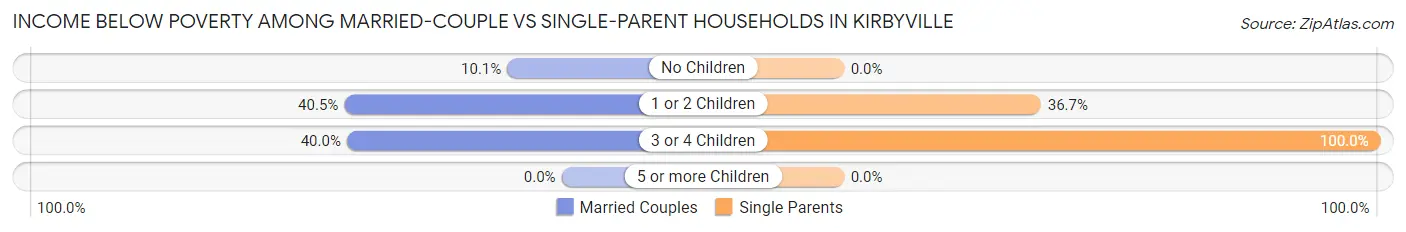
| Children | Married-Couple Families | Single-Parent Households |
| No Children | 23 (10.1%) | 0 (0.0%) |
| 1 or 2 Children | 17 (40.5%) | 65 (36.7%) |
| 3 or 4 Children | 4 (40.0%) | 39 (100.0%) |
| 5 or more Children | 0 (0.0%) | 0 (0.0%) |
| Total | 44 (15.8%) | 104 (43.1%) |
Employment Characteristics in Kirbyville
Employment by Class of Employer in Kirbyville
Among the 640 employed individuals in Kirbyville, private company employees (436 | 68.1%), local government employees (95 | 14.8%), and state government employees (56 | 8.7%) make up the most common classes of employment.
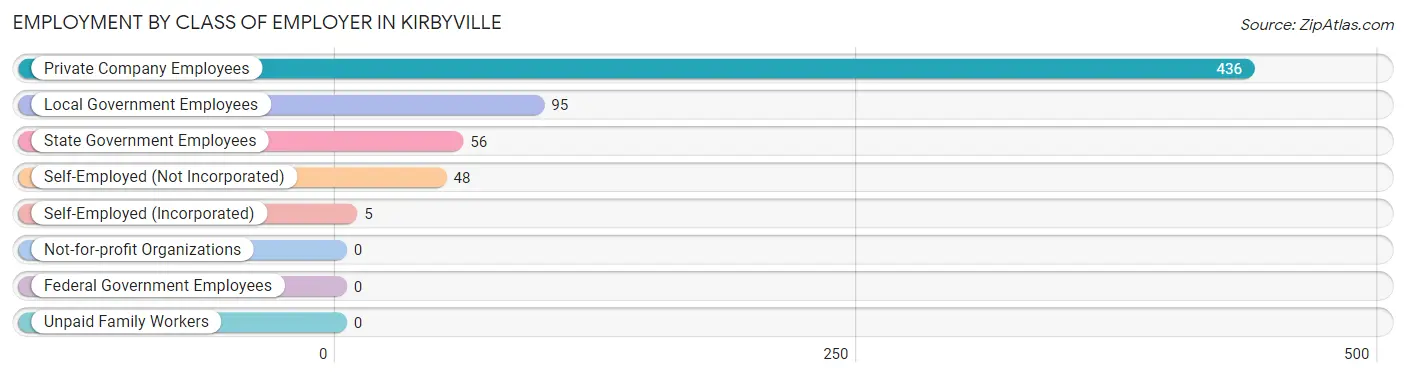
| Employer Class | # Employees | % Employees |
| Private Company Employees | 436 | 68.1% |
| Self-Employed (Incorporated) | 5 | 0.8% |
| Self-Employed (Not Incorporated) | 48 | 7.5% |
| Not-for-profit Organizations | 0 | 0.0% |
| Local Government Employees | 95 | 14.8% |
| State Government Employees | 56 | 8.7% |
| Federal Government Employees | 0 | 0.0% |
| Unpaid Family Workers | 0 | 0.0% |
| Total | 640 | 100.0% |
Employment Status by Age in Kirbyville
According to the labor force statistics for Kirbyville, out of the total population over 16 years of age (1,875), 50.9% or 954 individuals are in the labor force, with 23.6% or 225 of them unemployed. The age group with the highest labor force participation rate is 25 to 29 years, with 91.3% or 137 individuals in the labor force. Within the labor force, the 16 to 19 years age range has the highest percentage of unemployed individuals, with 89.2% or 74 of them being unemployed.
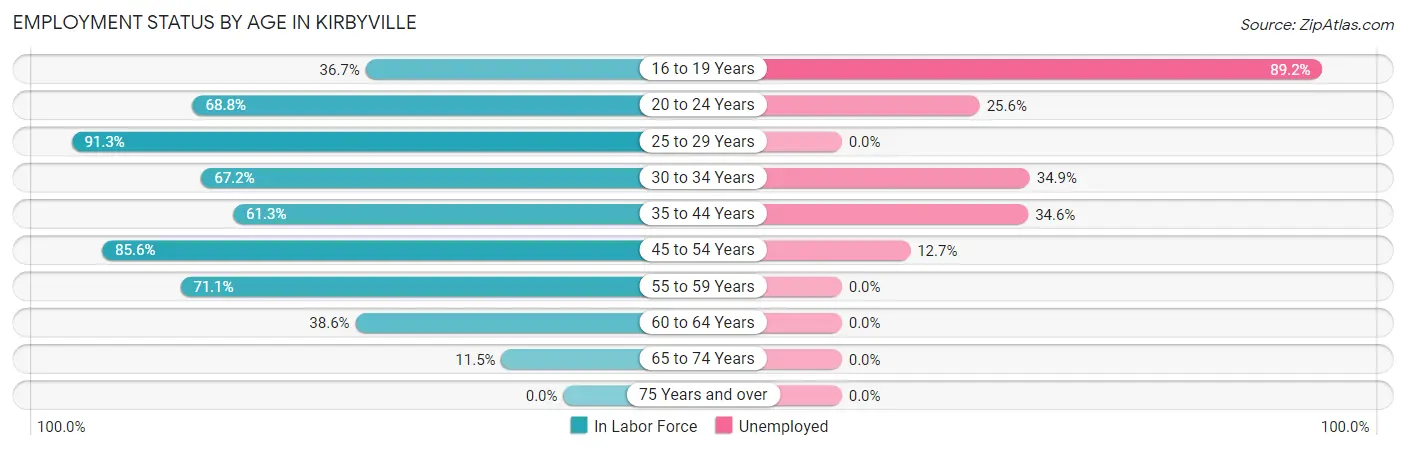
| Age Bracket | In Labor Force | Unemployed |
| 16 to 19 Years | 83 (36.7%) | 74 (89.2%) |
| 20 to 24 Years | 121 (68.8%) | 31 (25.6%) |
| 25 to 29 Years | 137 (91.3%) | 0 (0.0%) |
| 30 to 34 Years | 86 (67.2%) | 30 (34.9%) |
| 35 to 44 Years | 179 (61.3%) | 62 (34.6%) |
| 45 to 54 Years | 220 (85.6%) | 28 (12.7%) |
| 55 to 59 Years | 27 (71.1%) | 0 (0.0%) |
| 60 to 64 Years | 68 (38.6%) | 0 (0.0%) |
| 65 to 74 Years | 33 (11.5%) | 0 (0.0%) |
| 75 Years and over | 0 (0.0%) | 0 (0.0%) |
| Total | 954 (50.9%) | 225 (23.6%) |
Employment Status by Educational Attainment in Kirbyville
According to labor force statistics for Kirbyville, 68.9% of individuals (717) out of the total population between 25 and 64 years of age (1,041) are in the labor force, with 16.7% or 120 of them being unemployed. The group with the highest labor force participation rate are those with the educational attainment of bachelor's degree or higher, with 96.9% or 62 individuals in the labor force. Within the labor force, individuals with high school diploma education have the highest percentage of unemployment, with 28.4% or 90 of them being unemployed.
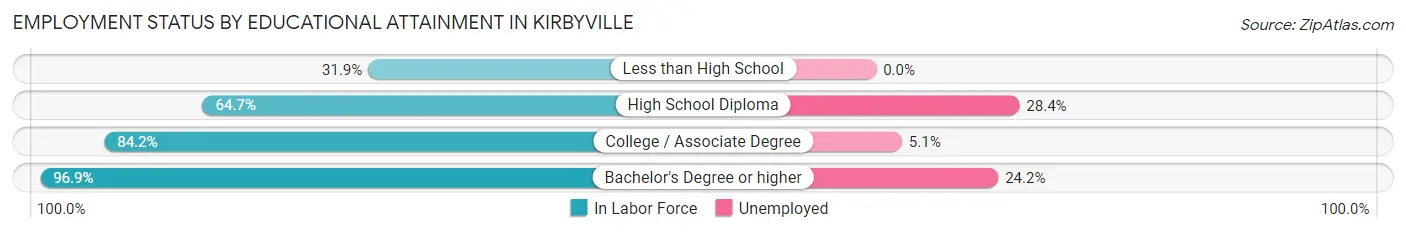
| Educational Attainment | In Labor Force | Unemployed |
| Less than High School | 44 (31.9%) | 0 (0.0%) |
| High School Diploma | 317 (64.7%) | 139 (28.4%) |
| College / Associate Degree | 294 (84.2%) | 18 (5.1%) |
| Bachelor's Degree or higher | 62 (96.9%) | 15 (24.2%) |
| Total | 717 (68.9%) | 174 (16.7%) |
Employment Occupations by Sex in Kirbyville
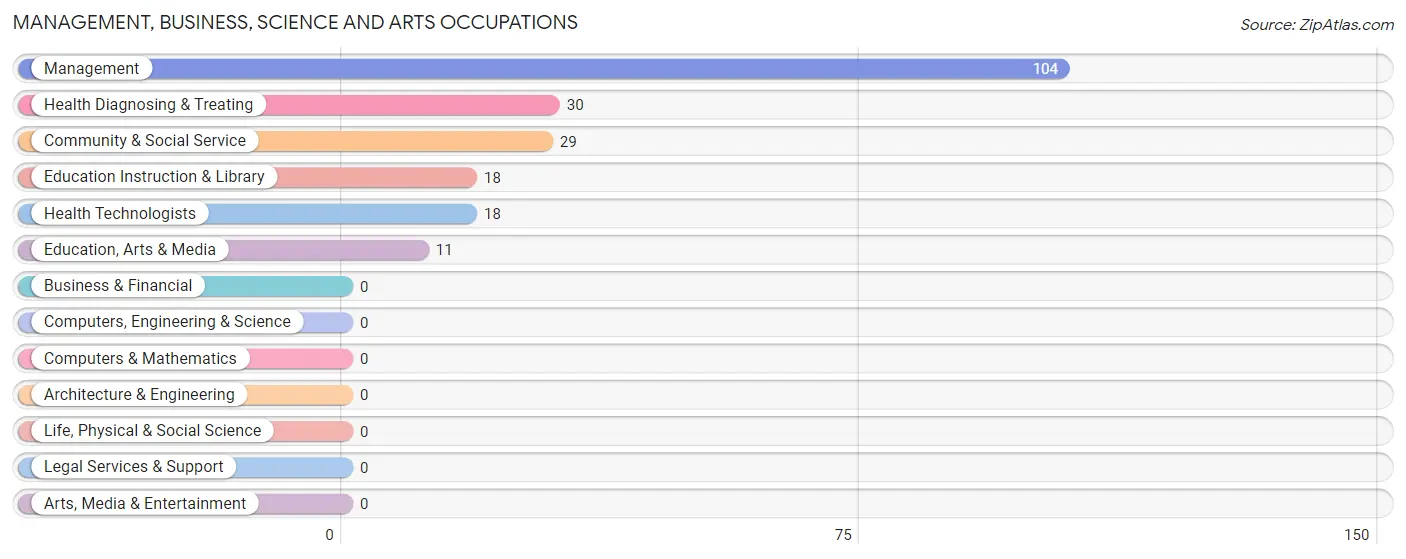
Management, Business, Science and Arts Occupations
The most common Management, Business, Science and Arts occupations in Kirbyville are Management (104 | 14.3%), Health Diagnosing & Treating (30 | 4.1%), Community & Social Service (29 | 4.0%), Education Instruction & Library (18 | 2.5%), and Health Technologists (18 | 2.5%).
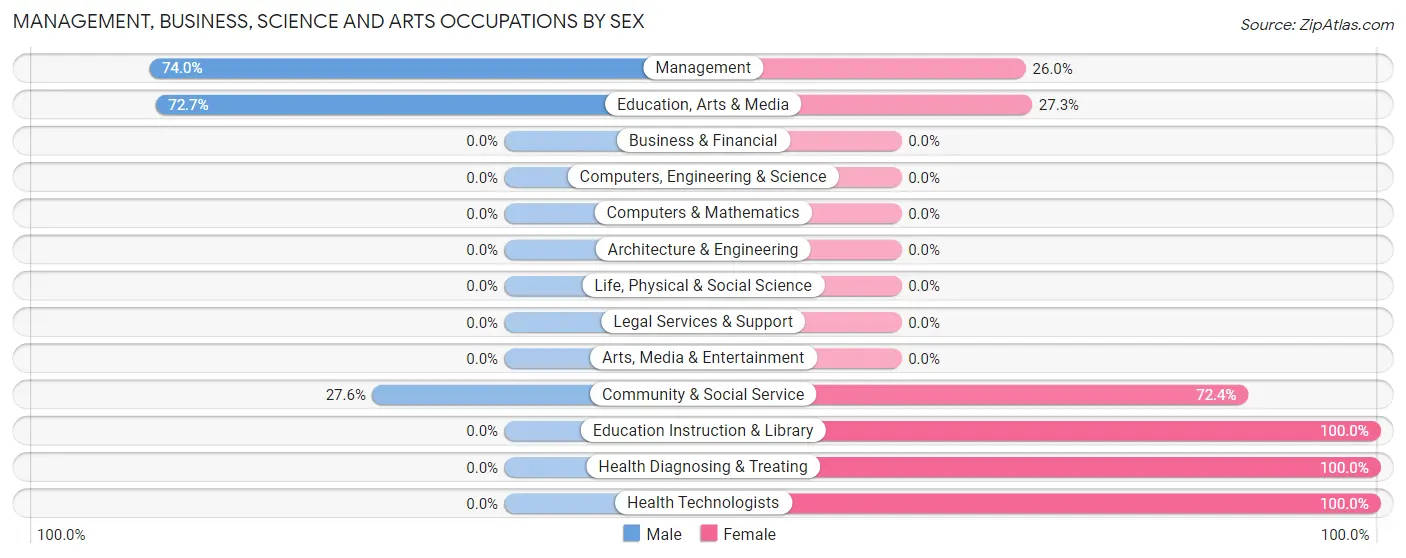
Management, Business, Science and Arts Occupations by Sex
Within the Management, Business, Science and Arts occupations in Kirbyville, the most male-oriented occupations are Management (74.0%), Education, Arts & Media (72.7%), and Community & Social Service (27.6%), while the most female-oriented occupations are Education Instruction & Library (100.0%), Health Diagnosing & Treating (100.0%), and Health Technologists (100.0%).
| Occupation | Male | Female |
| Management | 77 (74.0%) | 27 (26.0%) |
| Business & Financial | 0 (0.0%) | 0 (0.0%) |
| Computers, Engineering & Science | 0 (0.0%) | 0 (0.0%) |
| Computers & Mathematics | 0 (0.0%) | 0 (0.0%) |
| Architecture & Engineering | 0 (0.0%) | 0 (0.0%) |
| Life, Physical & Social Science | 0 (0.0%) | 0 (0.0%) |
| Community & Social Service | 8 (27.6%) | 21 (72.4%) |
| Education, Arts & Media | 8 (72.7%) | 3 (27.3%) |
| Legal Services & Support | 0 (0.0%) | 0 (0.0%) |
| Education Instruction & Library | 0 (0.0%) | 18 (100.0%) |
| Arts, Media & Entertainment | 0 (0.0%) | 0 (0.0%) |
| Health Diagnosing & Treating | 0 (0.0%) | 30 (100.0%) |
| Health Technologists | 0 (0.0%) | 18 (100.0%) |
| Total (Category) | 85 (52.1%) | 78 (47.8%) |
| Total (Overall) | 420 (57.6%) | 309 (42.4%) |
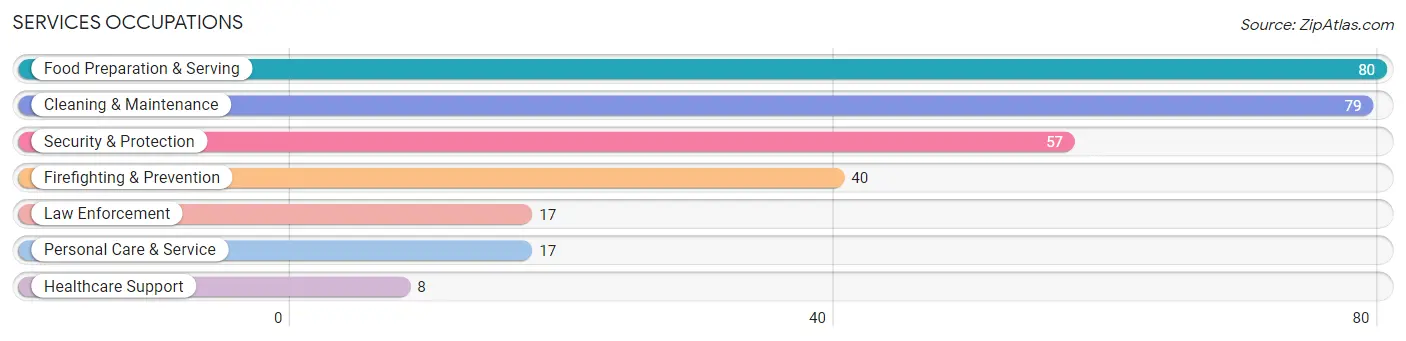
Services Occupations
The most common Services occupations in Kirbyville are Food Preparation & Serving (80 | 11.0%), Cleaning & Maintenance (79 | 10.8%), Security & Protection (57 | 7.8%), Firefighting & Prevention (40 | 5.5%), and Law Enforcement (17 | 2.3%).
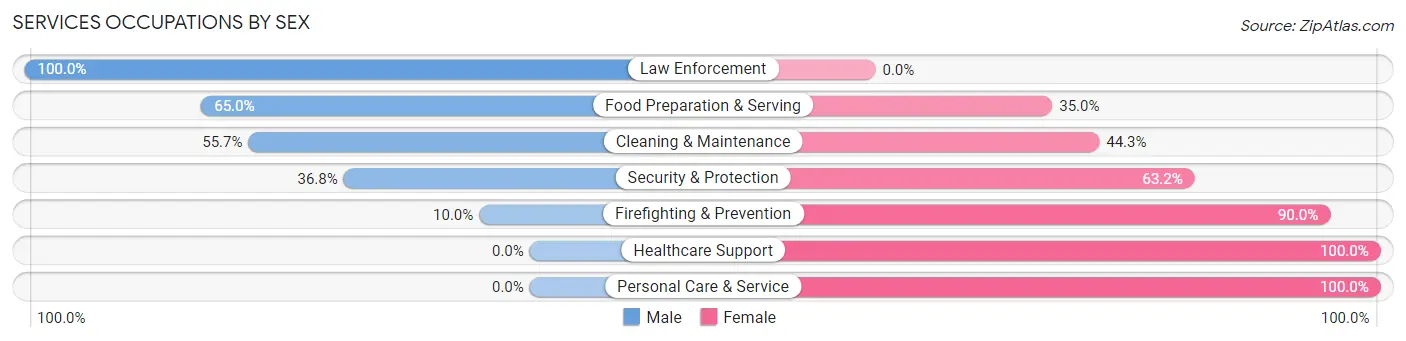
Services Occupations by Sex
Within the Services occupations in Kirbyville, the most male-oriented occupations are Law Enforcement (100.0%), Food Preparation & Serving (65.0%), and Cleaning & Maintenance (55.7%), while the most female-oriented occupations are Healthcare Support (100.0%), Personal Care & Service (100.0%), and Firefighting & Prevention (90.0%).
| Occupation | Male | Female |
| Healthcare Support | 0 (0.0%) | 8 (100.0%) |
| Security & Protection | 21 (36.8%) | 36 (63.2%) |
| Firefighting & Prevention | 4 (10.0%) | 36 (90.0%) |
| Law Enforcement | 17 (100.0%) | 0 (0.0%) |
| Food Preparation & Serving | 52 (65.0%) | 28 (35.0%) |
| Cleaning & Maintenance | 44 (55.7%) | 35 (44.3%) |
| Personal Care & Service | 0 (0.0%) | 17 (100.0%) |
| Total (Category) | 117 (48.5%) | 124 (51.4%) |
| Total (Overall) | 420 (57.6%) | 309 (42.4%) |
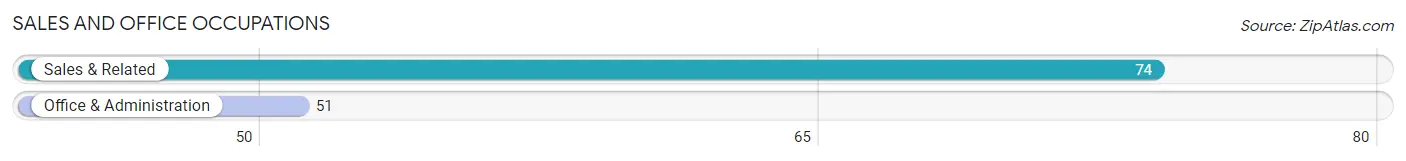
Sales and Office Occupations
The most common Sales and Office occupations in Kirbyville are Sales & Related (74 | 10.2%), and Office & Administration (51 | 7.0%).
Sales and Office Occupations by Sex
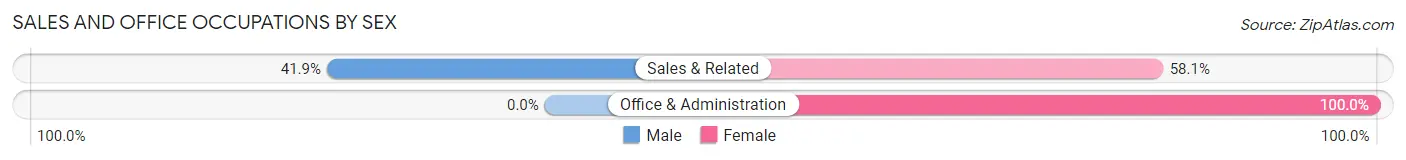
| Occupation | Male | Female |
| Sales & Related | 31 (41.9%) | 43 (58.1%) |
| Office & Administration | 0 (0.0%) | 51 (100.0%) |
| Total (Category) | 31 (24.8%) | 94 (75.2%) |
| Total (Overall) | 420 (57.6%) | 309 (42.4%) |
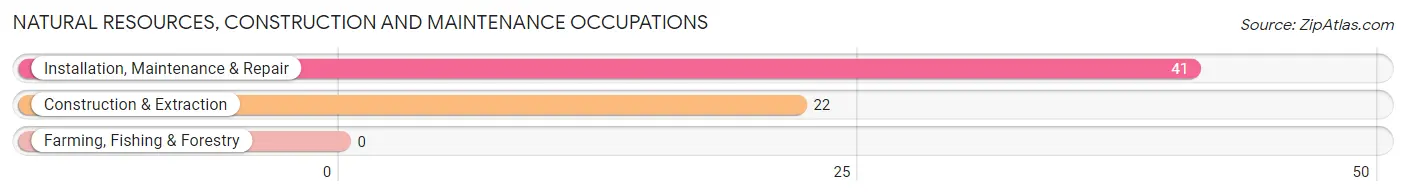
Natural Resources, Construction and Maintenance Occupations
The most common Natural Resources, Construction and Maintenance occupations in Kirbyville are Installation, Maintenance & Repair (41 | 5.6%), and Construction & Extraction (22 | 3.0%).
Natural Resources, Construction and Maintenance Occupations by Sex
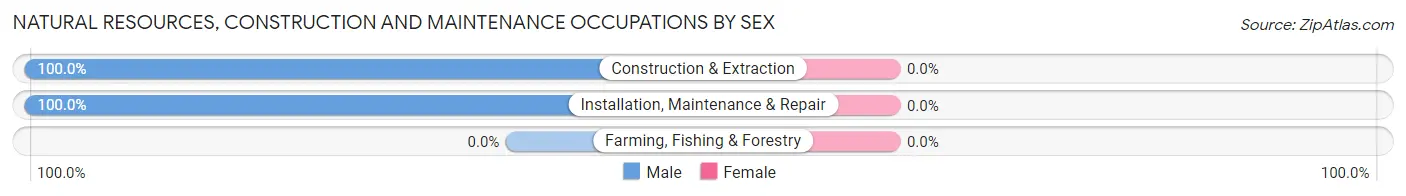
| Occupation | Male | Female |
| Farming, Fishing & Forestry | 0 (0.0%) | 0 (0.0%) |
| Construction & Extraction | 22 (100.0%) | 0 (0.0%) |
| Installation, Maintenance & Repair | 41 (100.0%) | 0 (0.0%) |
| Total (Category) | 63 (100.0%) | 0 (0.0%) |
| Total (Overall) | 420 (57.6%) | 309 (42.4%) |
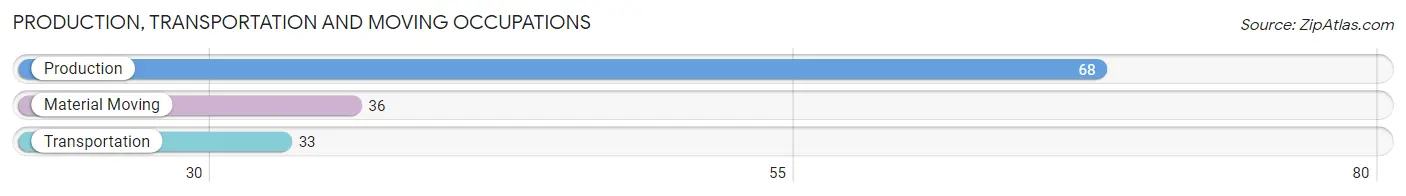
Production, Transportation and Moving Occupations
The most common Production, Transportation and Moving occupations in Kirbyville are Production (68 | 9.3%), Material Moving (36 | 4.9%), and Transportation (33 | 4.5%).
Production, Transportation and Moving Occupations by Sex
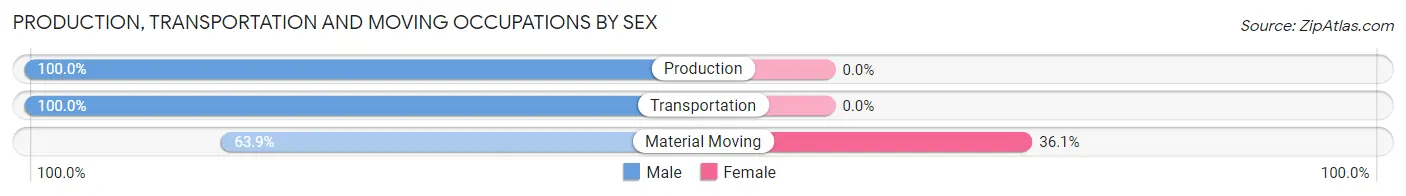
| Occupation | Male | Female |
| Production | 68 (100.0%) | 0 (0.0%) |
| Transportation | 33 (100.0%) | 0 (0.0%) |
| Material Moving | 23 (63.9%) | 13 (36.1%) |
| Total (Category) | 124 (90.5%) | 13 (9.5%) |
| Total (Overall) | 420 (57.6%) | 309 (42.4%) |
Employment Industries by Sex in Kirbyville
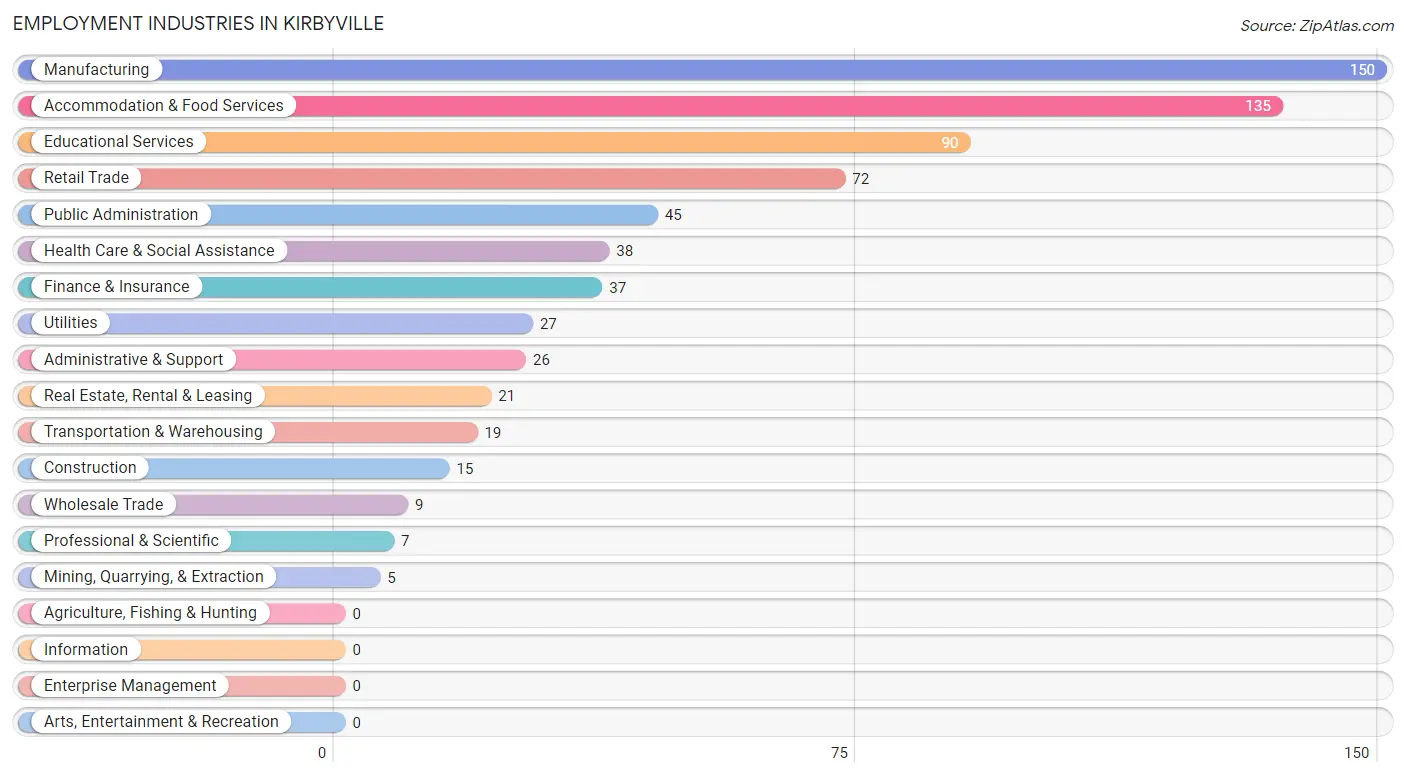
Employment Industries in Kirbyville
The major employment industries in Kirbyville include Manufacturing (150 | 20.6%), Accommodation & Food Services (135 | 18.5%), Educational Services (90 | 12.3%), Retail Trade (72 | 9.9%), and Public Administration (45 | 6.2%).
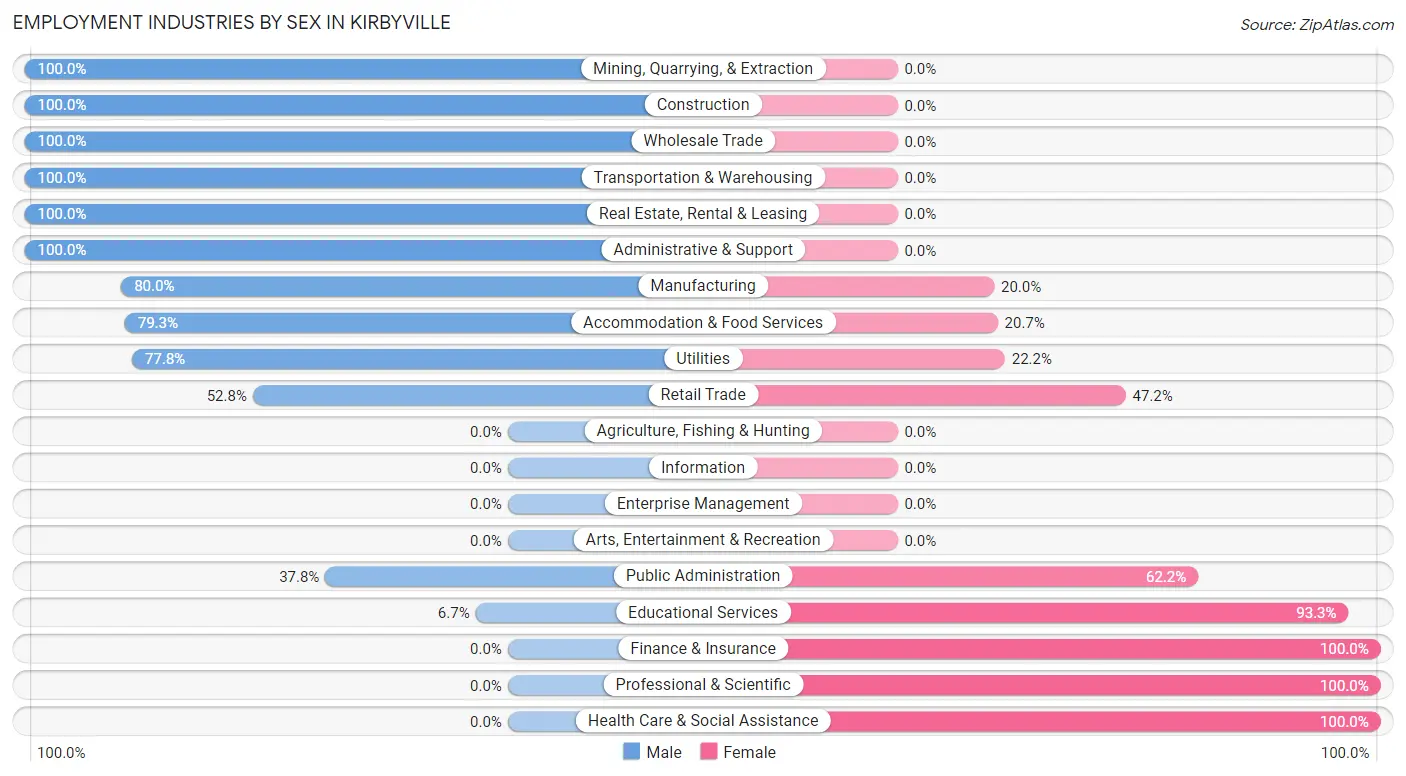
Employment Industries by Sex in Kirbyville
The Kirbyville industries that see more men than women are Mining, Quarrying, & Extraction (100.0%), Construction (100.0%), and Wholesale Trade (100.0%), whereas the industries that tend to have a higher number of women are Finance & Insurance (100.0%), Professional & Scientific (100.0%), and Health Care & Social Assistance (100.0%).
| Industry | Male | Female |
| Agriculture, Fishing & Hunting | 0 (0.0%) | 0 (0.0%) |
| Mining, Quarrying, & Extraction | 5 (100.0%) | 0 (0.0%) |
| Construction | 15 (100.0%) | 0 (0.0%) |
| Manufacturing | 120 (80.0%) | 30 (20.0%) |
| Wholesale Trade | 9 (100.0%) | 0 (0.0%) |
| Retail Trade | 38 (52.8%) | 34 (47.2%) |
| Transportation & Warehousing | 19 (100.0%) | 0 (0.0%) |
| Utilities | 21 (77.8%) | 6 (22.2%) |
| Information | 0 (0.0%) | 0 (0.0%) |
| Finance & Insurance | 0 (0.0%) | 37 (100.0%) |
| Real Estate, Rental & Leasing | 21 (100.0%) | 0 (0.0%) |
| Professional & Scientific | 0 (0.0%) | 7 (100.0%) |
| Enterprise Management | 0 (0.0%) | 0 (0.0%) |
| Administrative & Support | 26 (100.0%) | 0 (0.0%) |
| Educational Services | 6 (6.7%) | 84 (93.3%) |
| Health Care & Social Assistance | 0 (0.0%) | 38 (100.0%) |
| Arts, Entertainment & Recreation | 0 (0.0%) | 0 (0.0%) |
| Accommodation & Food Services | 107 (79.3%) | 28 (20.7%) |
| Public Administration | 17 (37.8%) | 28 (62.2%) |
| Total | 420 (57.6%) | 309 (42.4%) |
Education in Kirbyville
School Enrollment in Kirbyville
The most common levels of schooling among the 503 students in Kirbyville are high school (170 | 33.8%), middle school (116 | 23.1%), and elementary school (109 | 21.7%).
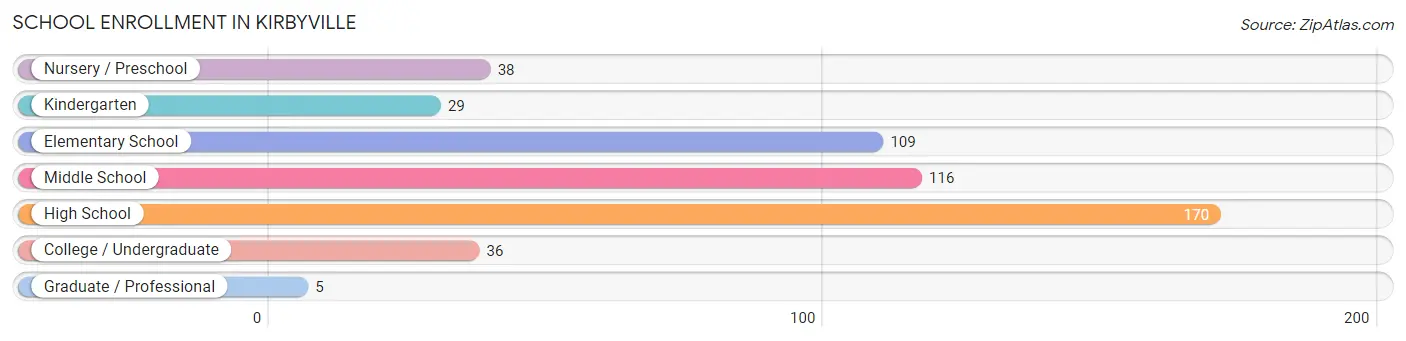
| School Level | # Students | % Students |
| Nursery / Preschool | 38 | 7.5% |
| Kindergarten | 29 | 5.8% |
| Elementary School | 109 | 21.7% |
| Middle School | 116 | 23.1% |
| High School | 170 | 33.8% |
| College / Undergraduate | 36 | 7.2% |
| Graduate / Professional | 5 | 1.0% |
| Total | 503 | 100.0% |
School Enrollment by Age by Funding Source in Kirbyville
Out of a total of 503 students who are enrolled in schools in Kirbyville, 33 (6.6%) attend a private institution, while the remaining 470 (93.4%) are enrolled in public schools. The age group of 20 to 24 year olds has the highest likelihood of being enrolled in private schools, with 12 (44.4% in the age bracket) enrolled. Conversely, the age group of 3 to 4 year olds has the lowest likelihood of being enrolled in a private school, with 28 (100.0% in the age bracket) attending a public institution.
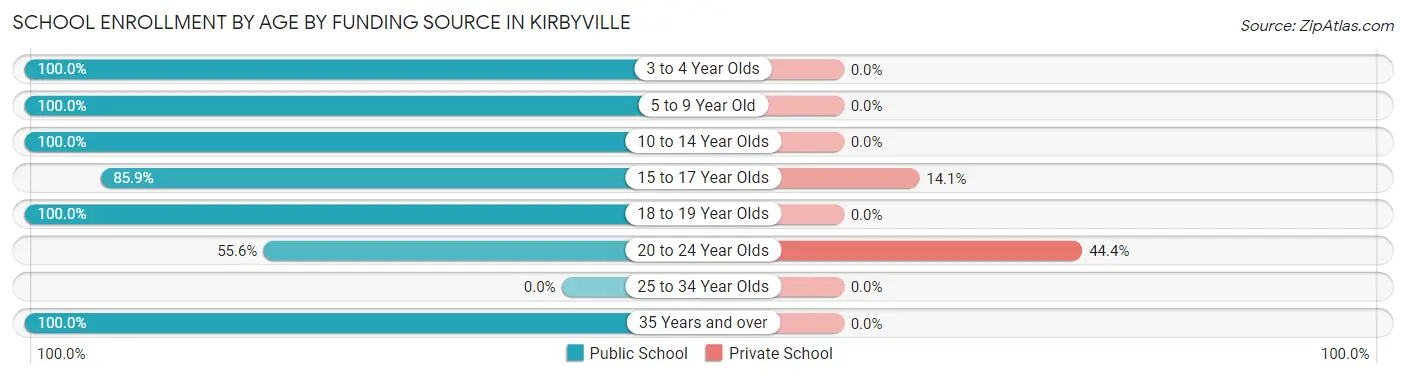
| Age Bracket | Public School | Private School |
| 3 to 4 Year Olds | 28 (100.0%) | 0 (0.0%) |
| 5 to 9 Year Old | 148 (100.0%) | 0 (0.0%) |
| 10 to 14 Year Olds | 116 (100.0%) | 0 (0.0%) |
| 15 to 17 Year Olds | 128 (85.9%) | 21 (14.1%) |
| 18 to 19 Year Olds | 30 (100.0%) | 0 (0.0%) |
| 20 to 24 Year Olds | 15 (55.6%) | 12 (44.4%) |
| 25 to 34 Year Olds | 0 (0.0%) | 0 (0.0%) |
| 35 Years and over | 5 (100.0%) | 0 (0.0%) |
| Total | 470 (93.4%) | 33 (6.6%) |
Educational Attainment by Field of Study in Kirbyville
Education (21 | 25.6%), engineering (16 | 19.5%), visual & performing arts (12 | 14.6%), science & technology (11 | 13.4%), and business (10 | 12.2%) are the most common fields of study among 82 individuals in Kirbyville who have obtained a bachelor's degree or higher.
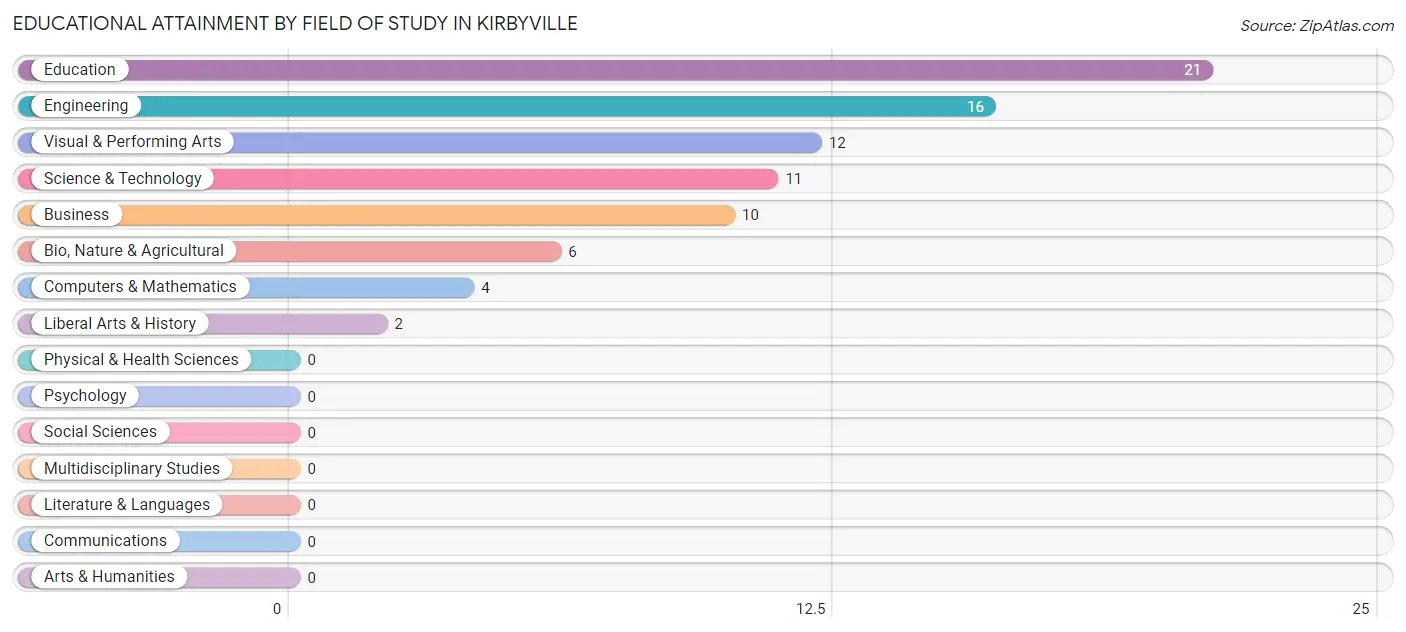
| Field of Study | # Graduates | % Graduates |
| Computers & Mathematics | 4 | 4.9% |
| Bio, Nature & Agricultural | 6 | 7.3% |
| Physical & Health Sciences | 0 | 0.0% |
| Psychology | 0 | 0.0% |
| Social Sciences | 0 | 0.0% |
| Engineering | 16 | 19.5% |
| Multidisciplinary Studies | 0 | 0.0% |
| Science & Technology | 11 | 13.4% |
| Business | 10 | 12.2% |
| Education | 21 | 25.6% |
| Literature & Languages | 0 | 0.0% |
| Liberal Arts & History | 2 | 2.4% |
| Visual & Performing Arts | 12 | 14.6% |
| Communications | 0 | 0.0% |
| Arts & Humanities | 0 | 0.0% |
| Total | 82 | 100.0% |
Transportation & Commute in Kirbyville
Vehicle Availability by Sex in Kirbyville
The most prevalent vehicle ownership categories in Kirbyville are males with 2 vehicles (167, accounting for 45.8%) and females with 2 vehicles (119, making up 60.7%).
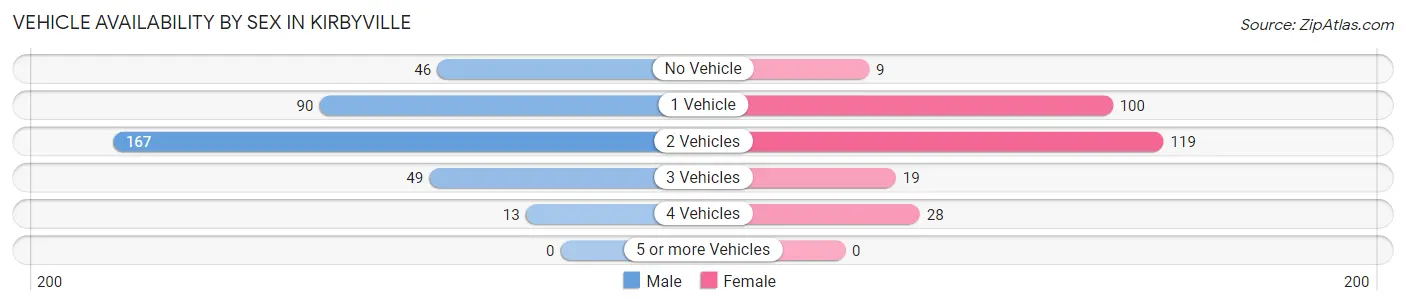
| Vehicles Available | Male | Female |
| No Vehicle | 46 (12.6%) | 9 (3.3%) |
| 1 Vehicle | 90 (24.7%) | 100 (36.4%) |
| 2 Vehicles | 167 (45.8%) | 119 (43.3%) |
| 3 Vehicles | 49 (13.4%) | 19 (6.9%) |
| 4 Vehicles | 13 (3.6%) | 28 (10.2%) |
| 5 or more Vehicles | 0 (0.0%) | 0 (0.0%) |
| Total | 365 (100.0%) | 275 (100.0%) |
Commute Time in Kirbyville
The most frequently occuring commute durations in Kirbyville are 10 to 14 minutes (130 commuters, 21.3%), 60 to 89 minutes (105 commuters, 17.2%), and 30 to 34 minutes (92 commuters, 15.1%).
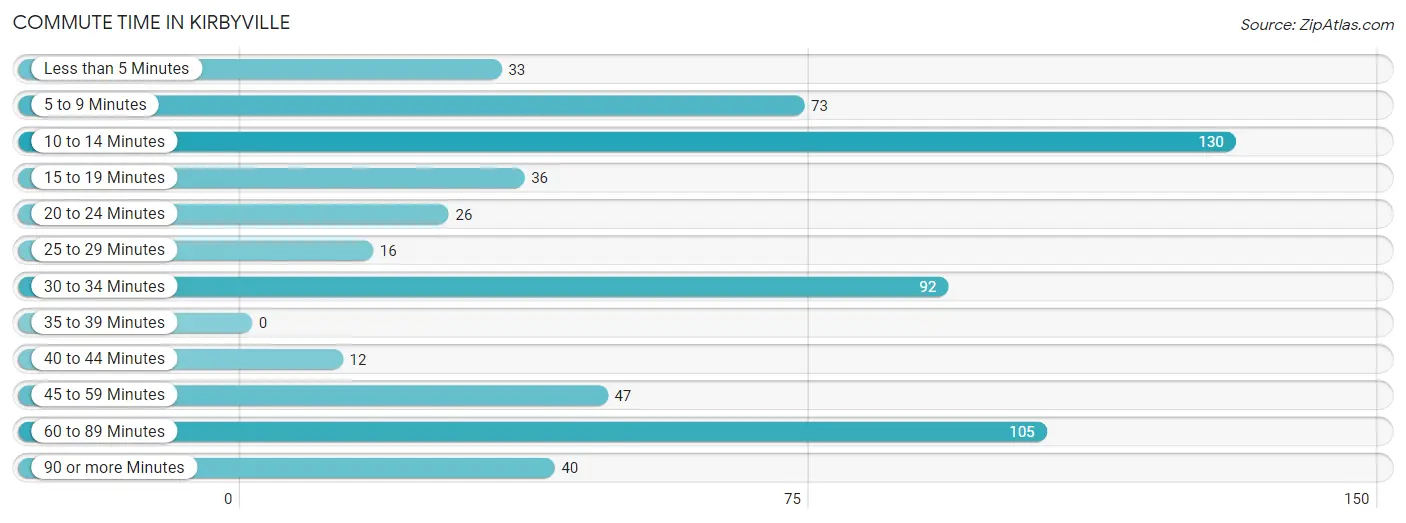
| Commute Time | # Commuters | % Commuters |
| Less than 5 Minutes | 33 | 5.4% |
| 5 to 9 Minutes | 73 | 12.0% |
| 10 to 14 Minutes | 130 | 21.3% |
| 15 to 19 Minutes | 36 | 5.9% |
| 20 to 24 Minutes | 26 | 4.3% |
| 25 to 29 Minutes | 16 | 2.6% |
| 30 to 34 Minutes | 92 | 15.1% |
| 35 to 39 Minutes | 0 | 0.0% |
| 40 to 44 Minutes | 12 | 2.0% |
| 45 to 59 Minutes | 47 | 7.7% |
| 60 to 89 Minutes | 105 | 17.2% |
| 90 or more Minutes | 40 | 6.6% |
Commute Time by Sex in Kirbyville
The most common commute times in Kirbyville are 60 to 89 minutes (70 commuters, 19.6%) for males and 10 to 14 minutes (63 commuters, 24.9%) for females.
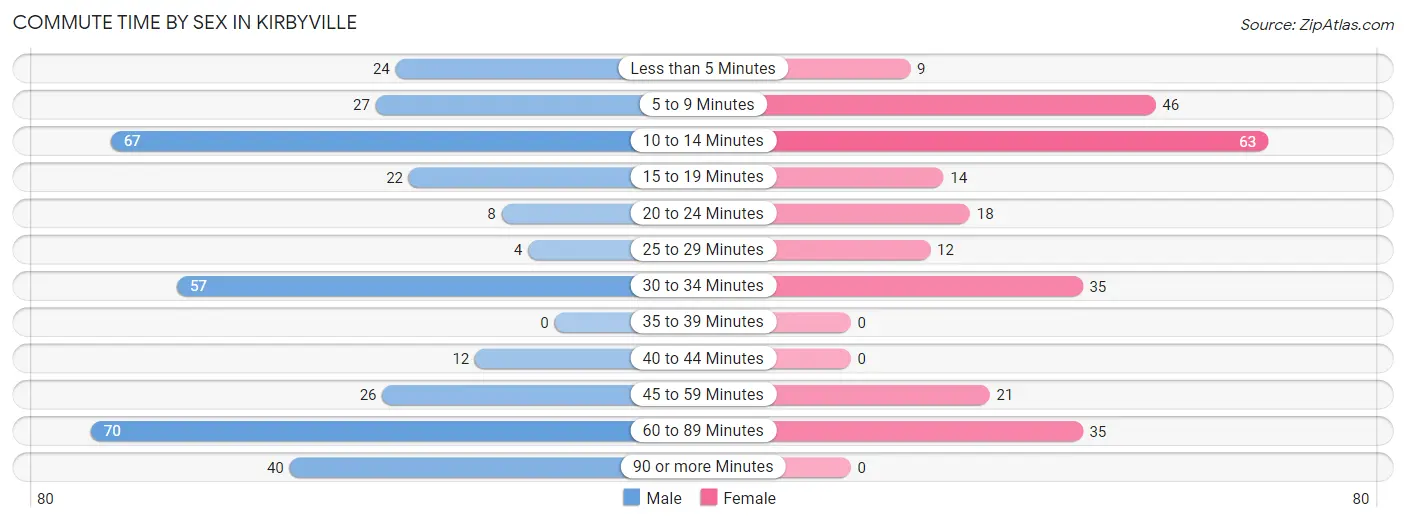
| Commute Time | Male | Female |
| Less than 5 Minutes | 24 (6.7%) | 9 (3.6%) |
| 5 to 9 Minutes | 27 (7.6%) | 46 (18.2%) |
| 10 to 14 Minutes | 67 (18.8%) | 63 (24.9%) |
| 15 to 19 Minutes | 22 (6.2%) | 14 (5.5%) |
| 20 to 24 Minutes | 8 (2.2%) | 18 (7.1%) |
| 25 to 29 Minutes | 4 (1.1%) | 12 (4.7%) |
| 30 to 34 Minutes | 57 (16.0%) | 35 (13.8%) |
| 35 to 39 Minutes | 0 (0.0%) | 0 (0.0%) |
| 40 to 44 Minutes | 12 (3.4%) | 0 (0.0%) |
| 45 to 59 Minutes | 26 (7.3%) | 21 (8.3%) |
| 60 to 89 Minutes | 70 (19.6%) | 35 (13.8%) |
| 90 or more Minutes | 40 (11.2%) | 0 (0.0%) |
Time of Departure to Work by Sex in Kirbyville
The most frequent times of departure to work in Kirbyville are 12:00 AM to 4:59 AM (71, 19.9%) for males and 7:00 AM to 7:29 AM (66, 26.1%) for females.
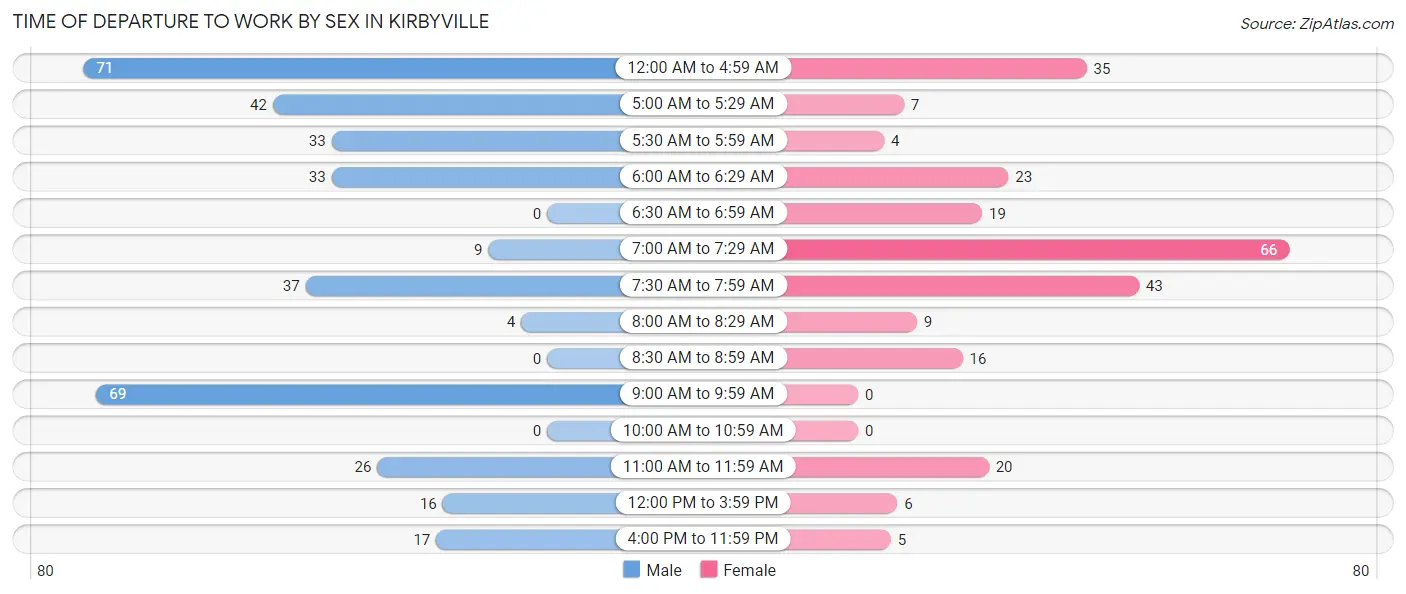
| Time of Departure | Male | Female |
| 12:00 AM to 4:59 AM | 71 (19.9%) | 35 (13.8%) |
| 5:00 AM to 5:29 AM | 42 (11.8%) | 7 (2.8%) |
| 5:30 AM to 5:59 AM | 33 (9.2%) | 4 (1.6%) |
| 6:00 AM to 6:29 AM | 33 (9.2%) | 23 (9.1%) |
| 6:30 AM to 6:59 AM | 0 (0.0%) | 19 (7.5%) |
| 7:00 AM to 7:29 AM | 9 (2.5%) | 66 (26.1%) |
| 7:30 AM to 7:59 AM | 37 (10.4%) | 43 (17.0%) |
| 8:00 AM to 8:29 AM | 4 (1.1%) | 9 (3.6%) |
| 8:30 AM to 8:59 AM | 0 (0.0%) | 16 (6.3%) |
| 9:00 AM to 9:59 AM | 69 (19.3%) | 0 (0.0%) |
| 10:00 AM to 10:59 AM | 0 (0.0%) | 0 (0.0%) |
| 11:00 AM to 11:59 AM | 26 (7.3%) | 20 (7.9%) |
| 12:00 PM to 3:59 PM | 16 (4.5%) | 6 (2.4%) |
| 4:00 PM to 11:59 PM | 17 (4.8%) | 5 (2.0%) |
| Total | 357 (100.0%) | 253 (100.0%) |
Housing Occupancy in Kirbyville
Occupancy by Ownership in Kirbyville
Of the total 877 dwellings in Kirbyville, owner-occupied units account for 524 (59.8%), while renter-occupied units make up 353 (40.3%).
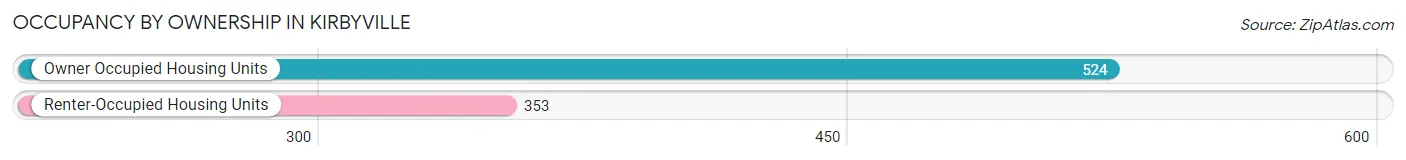
| Occupancy | # Housing Units | % Housing Units |
| Owner Occupied Housing Units | 524 | 59.8% |
| Renter-Occupied Housing Units | 353 | 40.3% |
| Total Occupied Housing Units | 877 | 100.0% |
Occupancy by Household Size in Kirbyville
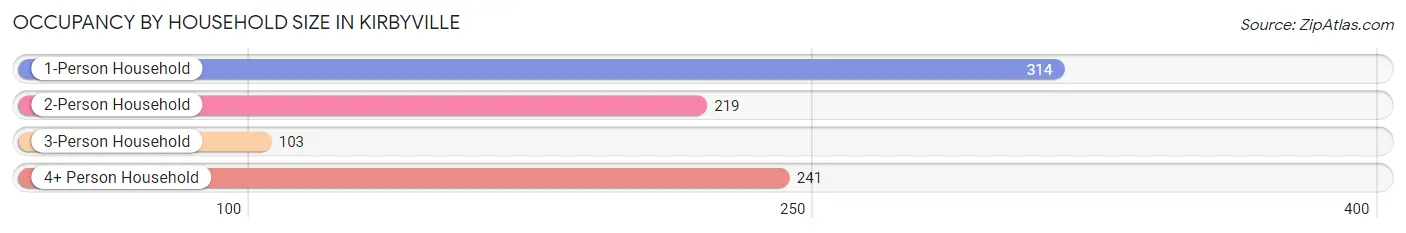
| Household Size | # Housing Units | % Housing Units |
| 1-Person Household | 314 | 35.8% |
| 2-Person Household | 219 | 25.0% |
| 3-Person Household | 103 | 11.7% |
| 4+ Person Household | 241 | 27.5% |
| Total Housing Units | 877 | 100.0% |
Occupancy by Ownership by Household Size in Kirbyville
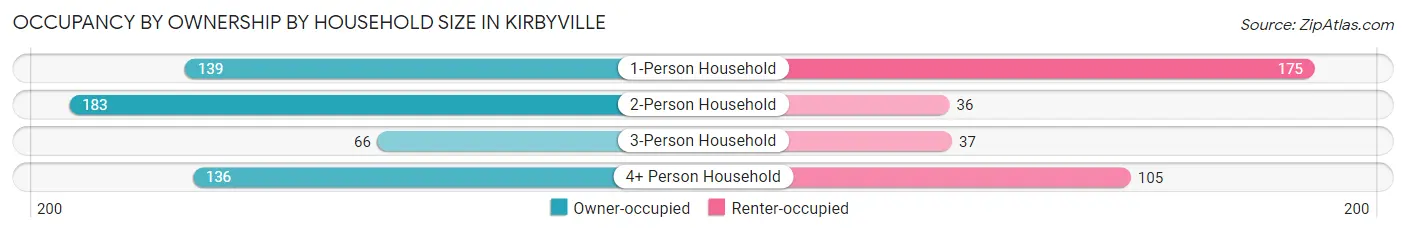
| Household Size | Owner-occupied | Renter-occupied |
| 1-Person Household | 139 (44.3%) | 175 (55.7%) |
| 2-Person Household | 183 (83.6%) | 36 (16.4%) |
| 3-Person Household | 66 (64.1%) | 37 (35.9%) |
| 4+ Person Household | 136 (56.4%) | 105 (43.6%) |
| Total Housing Units | 524 (59.8%) | 353 (40.3%) |
Occupancy by Educational Attainment in Kirbyville
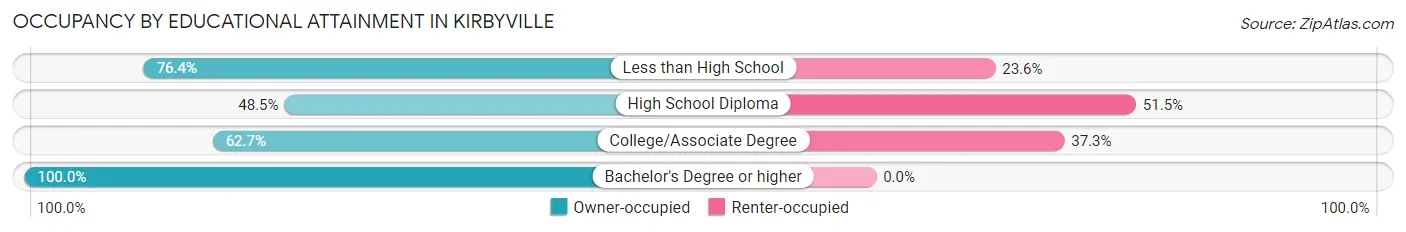
| Household Size | Owner-occupied | Renter-occupied |
| Less than High School | 97 (76.4%) | 30 (23.6%) |
| High School Diploma | 210 (48.5%) | 223 (51.5%) |
| College/Associate Degree | 168 (62.7%) | 100 (37.3%) |
| Bachelor's Degree or higher | 49 (100.0%) | 0 (0.0%) |
Occupancy by Age of Householder in Kirbyville
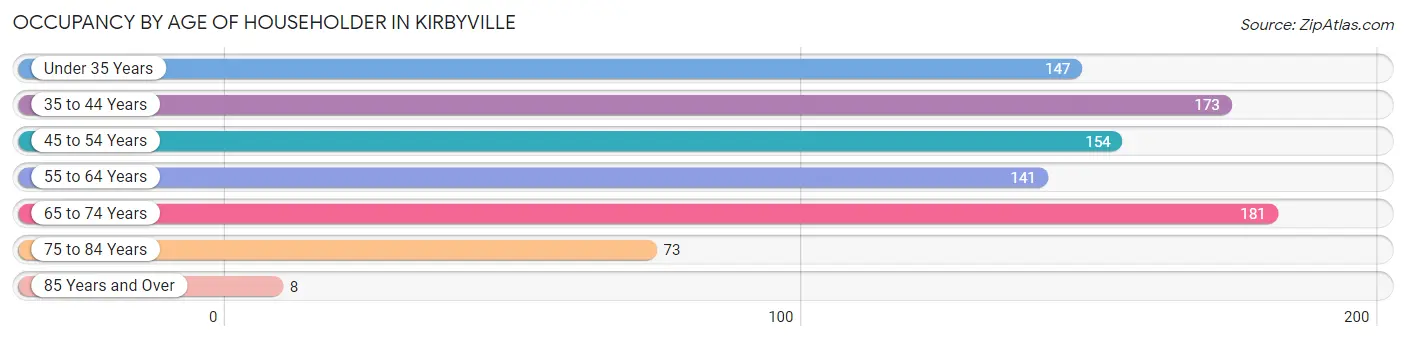
| Age Bracket | # Households | % Households |
| Under 35 Years | 147 | 16.8% |
| 35 to 44 Years | 173 | 19.7% |
| 45 to 54 Years | 154 | 17.6% |
| 55 to 64 Years | 141 | 16.1% |
| 65 to 74 Years | 181 | 20.6% |
| 75 to 84 Years | 73 | 8.3% |
| 85 Years and Over | 8 | 0.9% |
| Total | 877 | 100.0% |
Housing Finances in Kirbyville
Median Income by Occupancy in Kirbyville
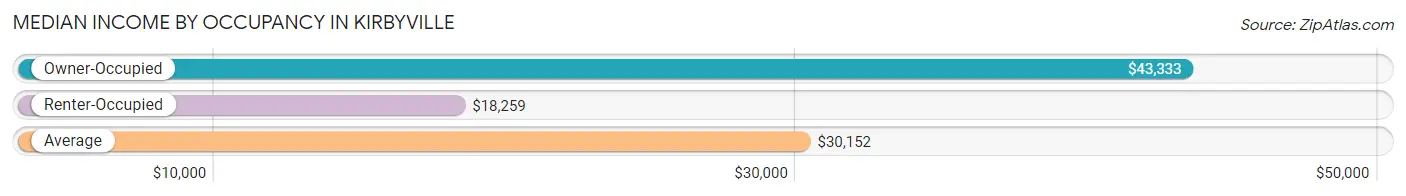
| Occupancy Type | # Households | Median Income |
| Owner-Occupied | 524 (59.8%) | $43,333 |
| Renter-Occupied | 353 (40.3%) | $18,259 |
| Average | 877 (100.0%) | $30,152 |
Occupancy by Householder Income Bracket in Kirbyville
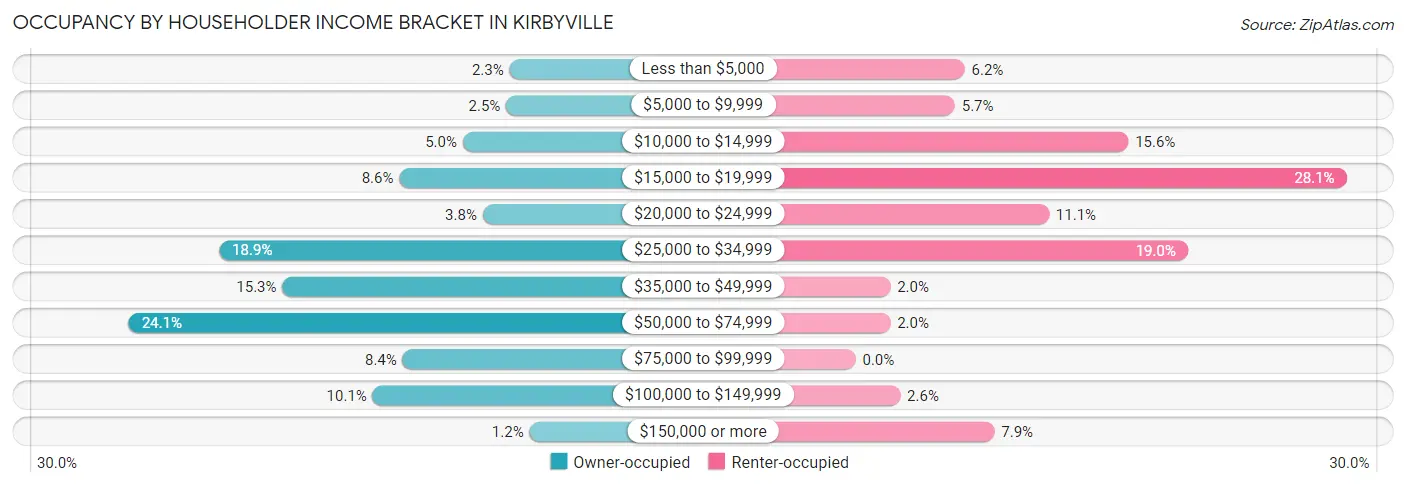
| Income Bracket | Owner-occupied | Renter-occupied |
| Less than $5,000 | 12 (2.3%) | 22 (6.2%) |
| $5,000 to $9,999 | 13 (2.5%) | 20 (5.7%) |
| $10,000 to $14,999 | 26 (5.0%) | 55 (15.6%) |
| $15,000 to $19,999 | 45 (8.6%) | 99 (28.1%) |
| $20,000 to $24,999 | 20 (3.8%) | 39 (11.1%) |
| $25,000 to $34,999 | 99 (18.9%) | 67 (19.0%) |
| $35,000 to $49,999 | 80 (15.3%) | 7 (2.0%) |
| $50,000 to $74,999 | 126 (24.0%) | 7 (2.0%) |
| $75,000 to $99,999 | 44 (8.4%) | 0 (0.0%) |
| $100,000 to $149,999 | 53 (10.1%) | 9 (2.5%) |
| $150,000 or more | 6 (1.1%) | 28 (7.9%) |
| Total | 524 (100.0%) | 353 (100.0%) |
Monthly Housing Cost Tiers in Kirbyville
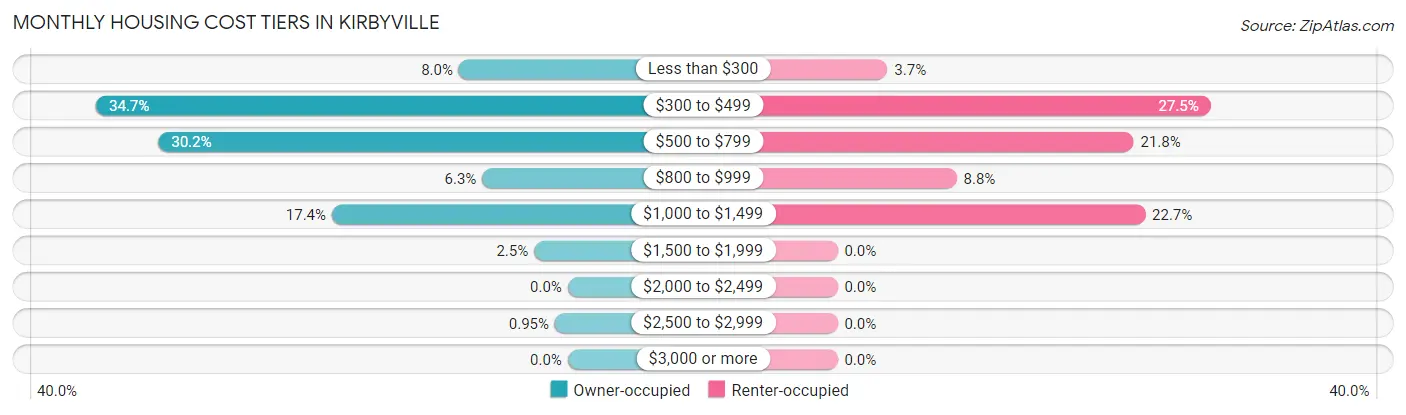
| Monthly Cost | Owner-occupied | Renter-occupied |
| Less than $300 | 42 (8.0%) | 13 (3.7%) |
| $300 to $499 | 182 (34.7%) | 97 (27.5%) |
| $500 to $799 | 158 (30.1%) | 77 (21.8%) |
| $800 to $999 | 33 (6.3%) | 31 (8.8%) |
| $1,000 to $1,499 | 91 (17.4%) | 80 (22.7%) |
| $1,500 to $1,999 | 13 (2.5%) | 0 (0.0%) |
| $2,000 to $2,499 | 0 (0.0%) | 0 (0.0%) |
| $2,500 to $2,999 | 5 (0.9%) | 0 (0.0%) |
| $3,000 or more | 0 (0.0%) | 0 (0.0%) |
| Total | 524 (100.0%) | 353 (100.0%) |
Physical Housing Characteristics in Kirbyville
Housing Structures in Kirbyville
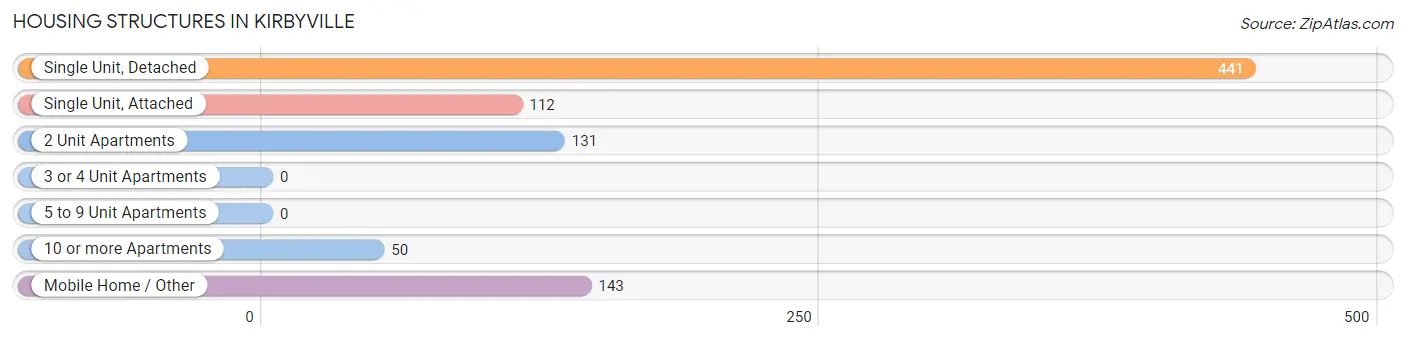
| Structure Type | # Housing Units | % Housing Units |
| Single Unit, Detached | 441 | 50.3% |
| Single Unit, Attached | 112 | 12.8% |
| 2 Unit Apartments | 131 | 14.9% |
| 3 or 4 Unit Apartments | 0 | 0.0% |
| 5 to 9 Unit Apartments | 0 | 0.0% |
| 10 or more Apartments | 50 | 5.7% |
| Mobile Home / Other | 143 | 16.3% |
| Total | 877 | 100.0% |
Housing Structures by Occupancy in Kirbyville
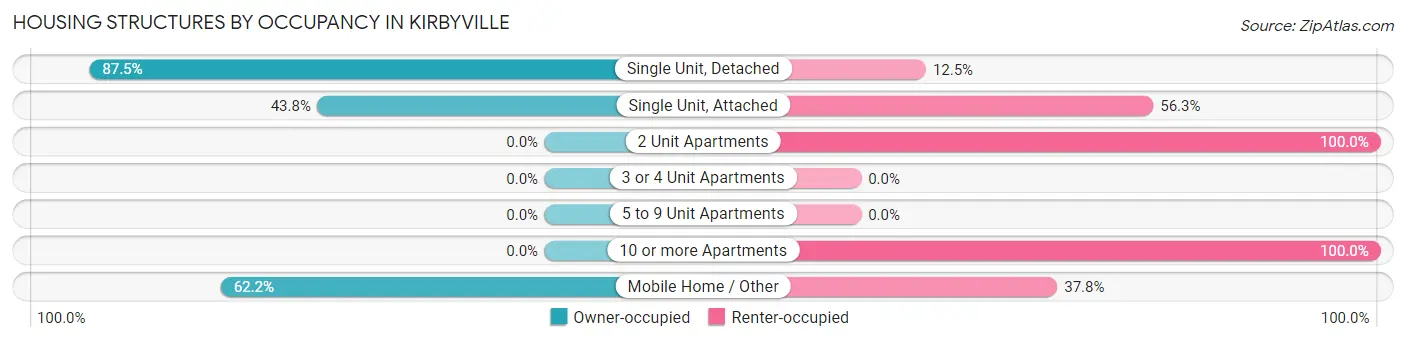
| Structure Type | Owner-occupied | Renter-occupied |
| Single Unit, Detached | 386 (87.5%) | 55 (12.5%) |
| Single Unit, Attached | 49 (43.8%) | 63 (56.2%) |
| 2 Unit Apartments | 0 (0.0%) | 131 (100.0%) |
| 3 or 4 Unit Apartments | 0 (0.0%) | 0 (0.0%) |
| 5 to 9 Unit Apartments | 0 (0.0%) | 0 (0.0%) |
| 10 or more Apartments | 0 (0.0%) | 50 (100.0%) |
| Mobile Home / Other | 89 (62.2%) | 54 (37.8%) |
| Total | 524 (59.8%) | 353 (40.3%) |
Housing Structures by Number of Rooms in Kirbyville
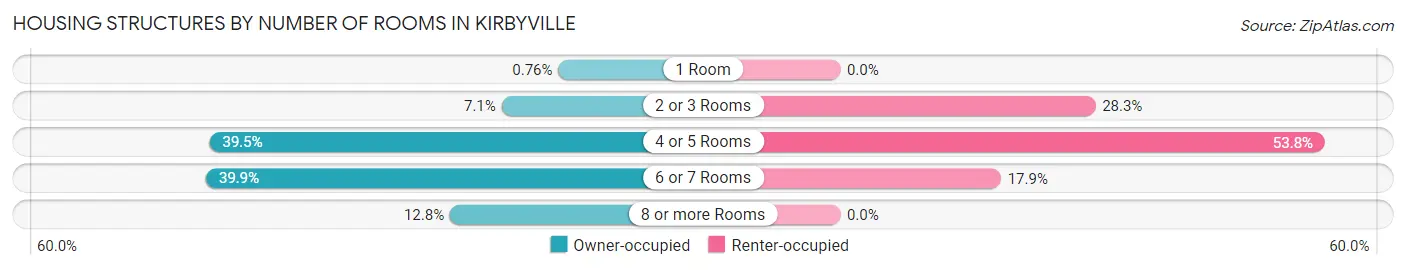
| Number of Rooms | Owner-occupied | Renter-occupied |
| 1 Room | 4 (0.8%) | 0 (0.0%) |
| 2 or 3 Rooms | 37 (7.1%) | 100 (28.3%) |
| 4 or 5 Rooms | 207 (39.5%) | 190 (53.8%) |
| 6 or 7 Rooms | 209 (39.9%) | 63 (17.8%) |
| 8 or more Rooms | 67 (12.8%) | 0 (0.0%) |
| Total | 524 (100.0%) | 353 (100.0%) |
Housing Structure by Heating Type in Kirbyville
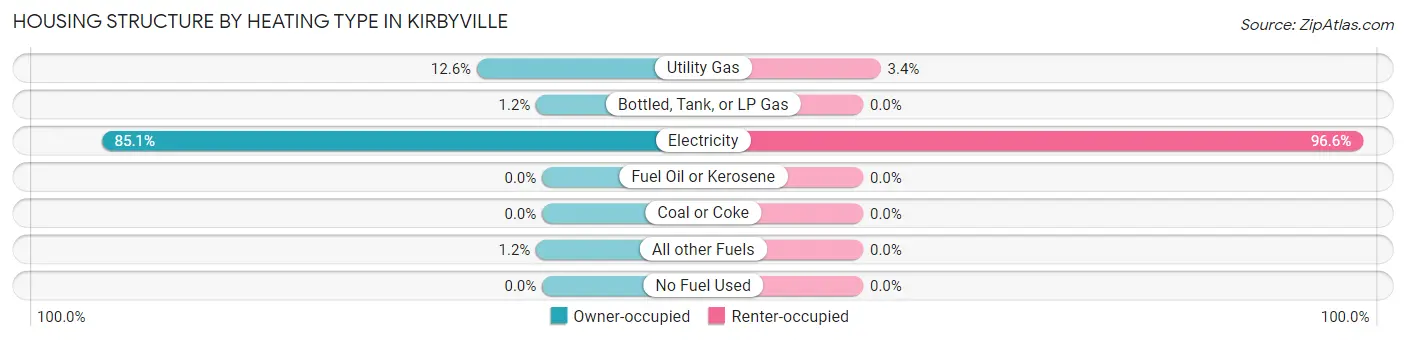
| Heating Type | Owner-occupied | Renter-occupied |
| Utility Gas | 66 (12.6%) | 12 (3.4%) |
| Bottled, Tank, or LP Gas | 6 (1.1%) | 0 (0.0%) |
| Electricity | 446 (85.1%) | 341 (96.6%) |
| Fuel Oil or Kerosene | 0 (0.0%) | 0 (0.0%) |
| Coal or Coke | 0 (0.0%) | 0 (0.0%) |
| All other Fuels | 6 (1.1%) | 0 (0.0%) |
| No Fuel Used | 0 (0.0%) | 0 (0.0%) |
| Total | 524 (100.0%) | 353 (100.0%) |
Household Vehicle Usage in Kirbyville
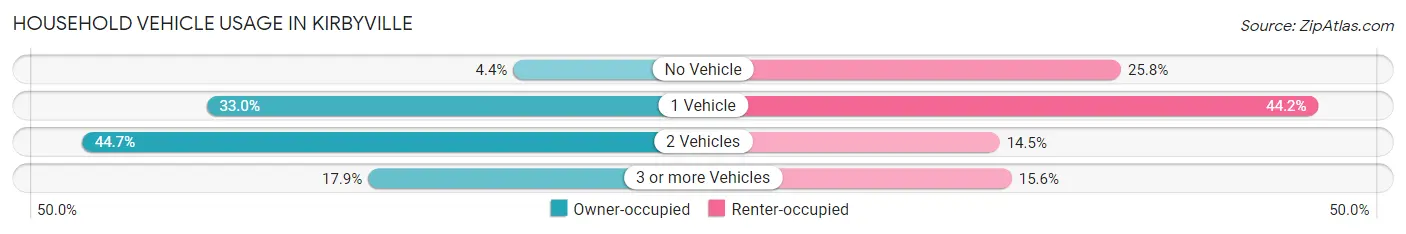
| Vehicles per Household | Owner-occupied | Renter-occupied |
| No Vehicle | 23 (4.4%) | 91 (25.8%) |
| 1 Vehicle | 173 (33.0%) | 156 (44.2%) |
| 2 Vehicles | 234 (44.7%) | 51 (14.4%) |
| 3 or more Vehicles | 94 (17.9%) | 55 (15.6%) |
| Total | 524 (100.0%) | 353 (100.0%) |
Real Estate & Mortgages in Kirbyville
Real Estate and Mortgage Overview in Kirbyville
| Characteristic | Without Mortgage | With Mortgage |
| Housing Units | 345 | 179 |
| Median Property Value | $85,900 | $83,400 |
| Median Household Income | $32,063 | $6 |
| Monthly Housing Costs | $447 | $0 |
| Real Estate Taxes | $1,014 | $0 |
Property Value by Mortgage Status in Kirbyville
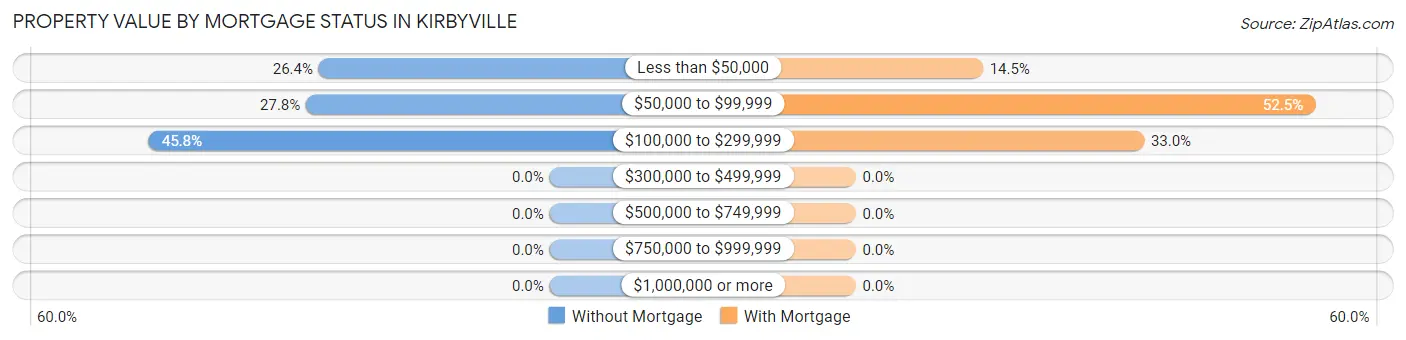
| Property Value | Without Mortgage | With Mortgage |
| Less than $50,000 | 91 (26.4%) | 26 (14.5%) |
| $50,000 to $99,999 | 96 (27.8%) | 94 (52.5%) |
| $100,000 to $299,999 | 158 (45.8%) | 59 (33.0%) |
| $300,000 to $499,999 | 0 (0.0%) | 0 (0.0%) |
| $500,000 to $749,999 | 0 (0.0%) | 0 (0.0%) |
| $750,000 to $999,999 | 0 (0.0%) | 0 (0.0%) |
| $1,000,000 or more | 0 (0.0%) | 0 (0.0%) |
| Total | 345 (100.0%) | 179 (100.0%) |
Household Income by Mortgage Status in Kirbyville
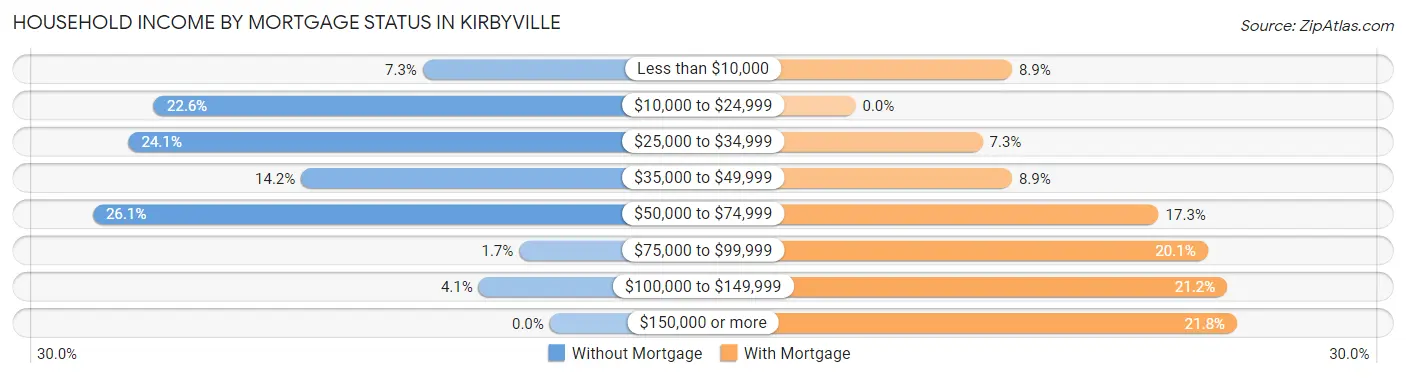
| Household Income | Without Mortgage | With Mortgage |
| Less than $10,000 | 25 (7.2%) | 16 (8.9%) |
| $10,000 to $24,999 | 78 (22.6%) | 0 (0.0%) |
| $25,000 to $34,999 | 83 (24.1%) | 13 (7.3%) |
| $35,000 to $49,999 | 49 (14.2%) | 16 (8.9%) |
| $50,000 to $74,999 | 90 (26.1%) | 31 (17.3%) |
| $75,000 to $99,999 | 6 (1.7%) | 36 (20.1%) |
| $100,000 to $149,999 | 14 (4.1%) | 38 (21.2%) |
| $150,000 or more | 0 (0.0%) | 39 (21.8%) |
| Total | 345 (100.0%) | 179 (100.0%) |
Property Value to Household Income Ratio in Kirbyville
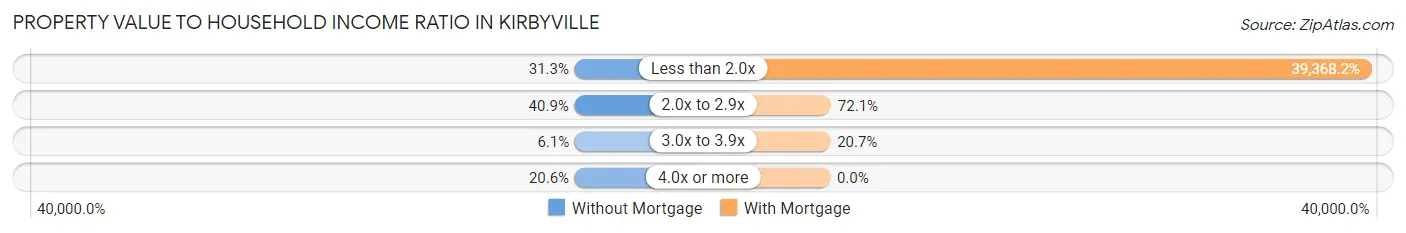
| Value-to-Income Ratio | Without Mortgage | With Mortgage |
| Less than 2.0x | 108 (31.3%) | 70,469 (39,368.2%) |
| 2.0x to 2.9x | 141 (40.9%) | 129 (72.1%) |
| 3.0x to 3.9x | 21 (6.1%) | 37 (20.7%) |
| 4.0x or more | 71 (20.6%) | 0 (0.0%) |
| Total | 345 (100.0%) | 179 (100.0%) |
Real Estate Taxes by Mortgage Status in Kirbyville
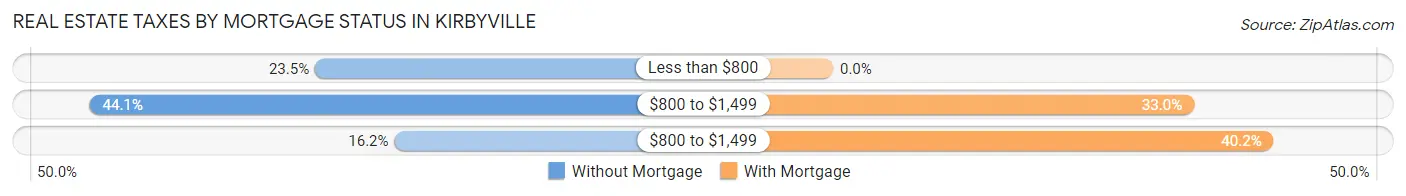
| Property Taxes | Without Mortgage | With Mortgage |
| Less than $800 | 81 (23.5%) | 0 (0.0%) |
| $800 to $1,499 | 152 (44.1%) | 59 (33.0%) |
| $800 to $1,499 | 56 (16.2%) | 72 (40.2%) |
| Total | 345 (100.0%) | 179 (100.0%) |
Health & Disability in Kirbyville
Health Insurance Coverage by Age in Kirbyville
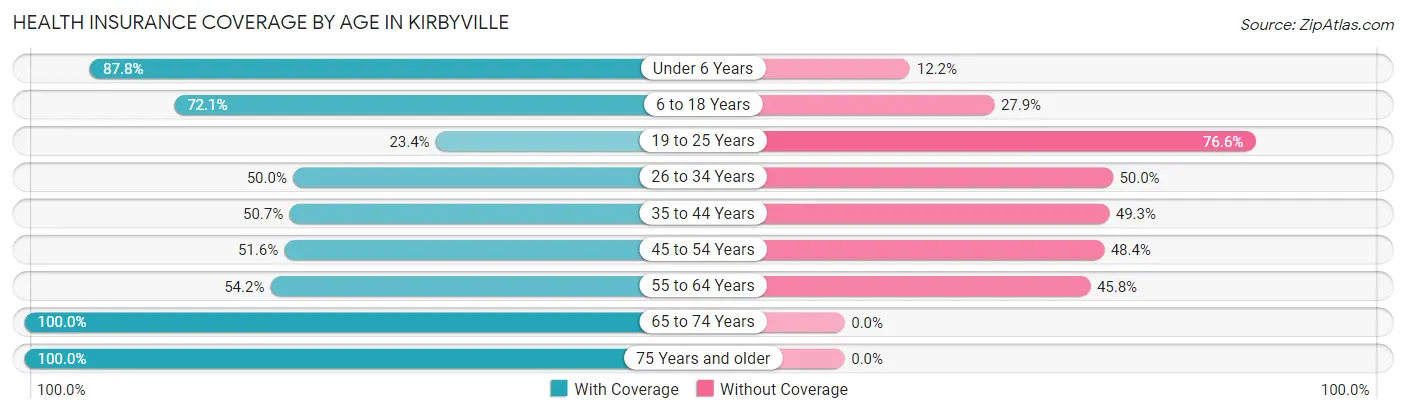
| Age Bracket | With Coverage | Without Coverage |
| Under 6 Years | 201 (87.8%) | 28 (12.2%) |
| 6 to 18 Years | 297 (72.1%) | 115 (27.9%) |
| 19 to 25 Years | 58 (23.4%) | 190 (76.6%) |
| 26 to 34 Years | 128 (50.0%) | 128 (50.0%) |
| 35 to 44 Years | 148 (50.7%) | 144 (49.3%) |
| 45 to 54 Years | 127 (51.6%) | 119 (48.4%) |
| 55 to 64 Years | 110 (54.2%) | 93 (45.8%) |
| 65 to 74 Years | 263 (100.0%) | 0 (0.0%) |
| 75 Years and older | 108 (100.0%) | 0 (0.0%) |
| Total | 1,440 (63.8%) | 817 (36.2%) |
Health Insurance Coverage by Citizenship Status in Kirbyville
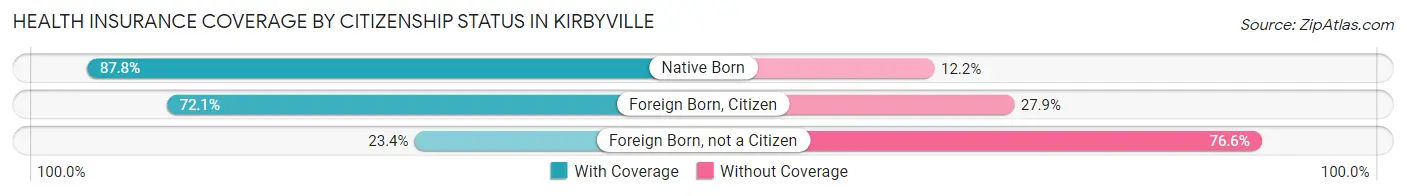
| Citizenship Status | With Coverage | Without Coverage |
| Native Born | 201 (87.8%) | 28 (12.2%) |
| Foreign Born, Citizen | 297 (72.1%) | 115 (27.9%) |
| Foreign Born, not a Citizen | 58 (23.4%) | 190 (76.6%) |
Health Insurance Coverage by Household Income in Kirbyville
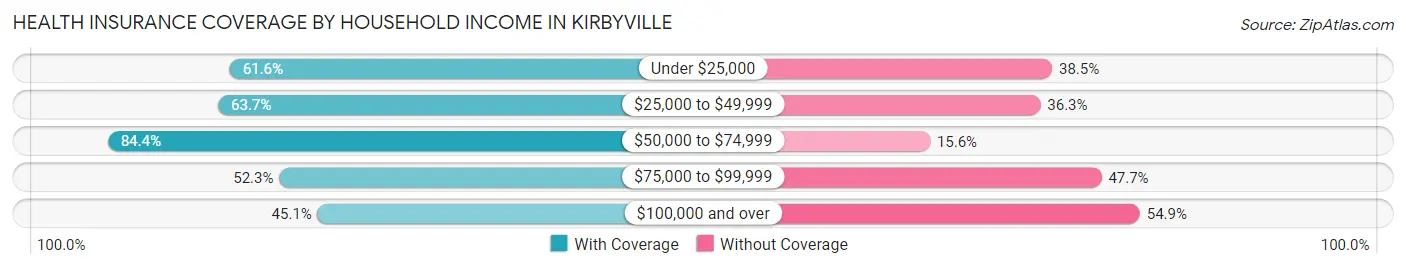
| Household Income | With Coverage | Without Coverage |
| Under $25,000 | 365 (61.6%) | 228 (38.5%) |
| $25,000 to $49,999 | 494 (63.7%) | 281 (36.3%) |
| $50,000 to $74,999 | 363 (84.4%) | 67 (15.6%) |
| $75,000 to $99,999 | 80 (52.3%) | 73 (47.7%) |
| $100,000 and over | 138 (45.1%) | 168 (54.9%) |
Public vs Private Health Insurance Coverage by Age in Kirbyville
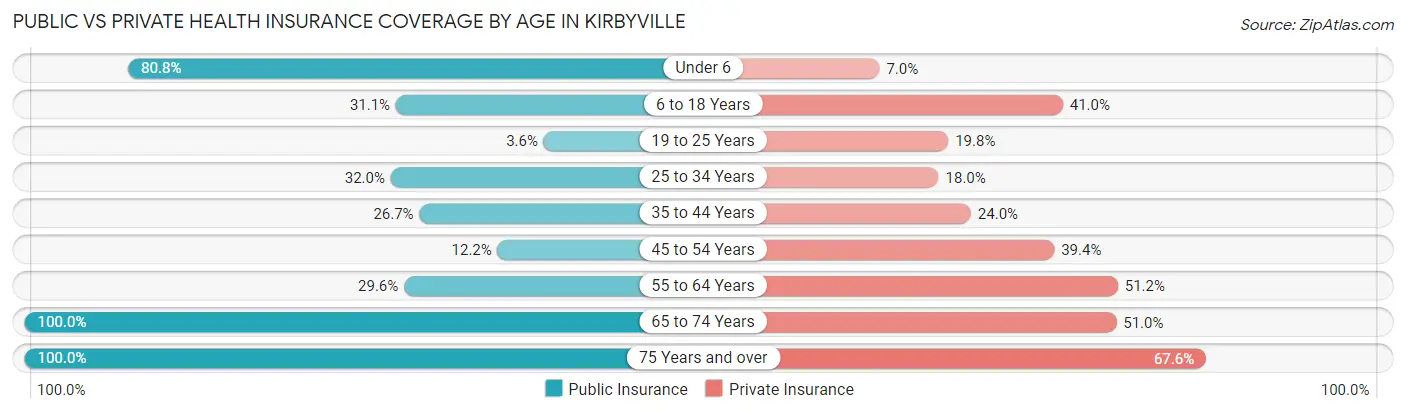
| Age Bracket | Public Insurance | Private Insurance |
| Under 6 | 185 (80.8%) | 16 (7.0%) |
| 6 to 18 Years | 128 (31.1%) | 169 (41.0%) |
| 19 to 25 Years | 9 (3.6%) | 49 (19.8%) |
| 25 to 34 Years | 82 (32.0%) | 46 (18.0%) |
| 35 to 44 Years | 78 (26.7%) | 70 (24.0%) |
| 45 to 54 Years | 30 (12.2%) | 97 (39.4%) |
| 55 to 64 Years | 60 (29.6%) | 104 (51.2%) |
| 65 to 74 Years | 263 (100.0%) | 134 (50.9%) |
| 75 Years and over | 108 (100.0%) | 73 (67.6%) |
| Total | 943 (41.8%) | 758 (33.6%) |
Disability Status by Sex by Age in Kirbyville
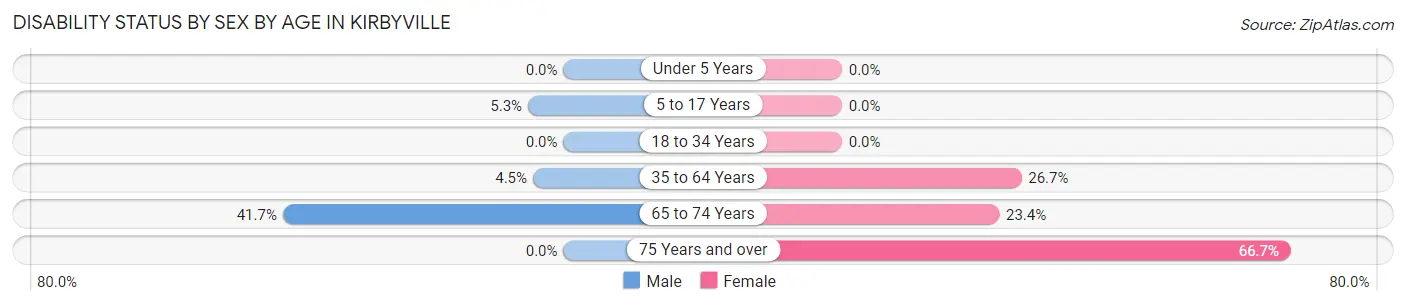
| Age Bracket | Male | Female |
| Under 5 Years | 0 (0.0%) | 0 (0.0%) |
| 5 to 17 Years | 10 (5.3%) | 0 (0.0%) |
| 18 to 34 Years | 0 (0.0%) | 0 (0.0%) |
| 35 to 64 Years | 13 (4.5%) | 121 (26.7%) |
| 65 to 74 Years | 40 (41.7%) | 39 (23.4%) |
| 75 Years and over | 0 (0.0%) | 46 (66.7%) |
Disability Class by Sex by Age in Kirbyville
Disability Class: Hearing Difficulty
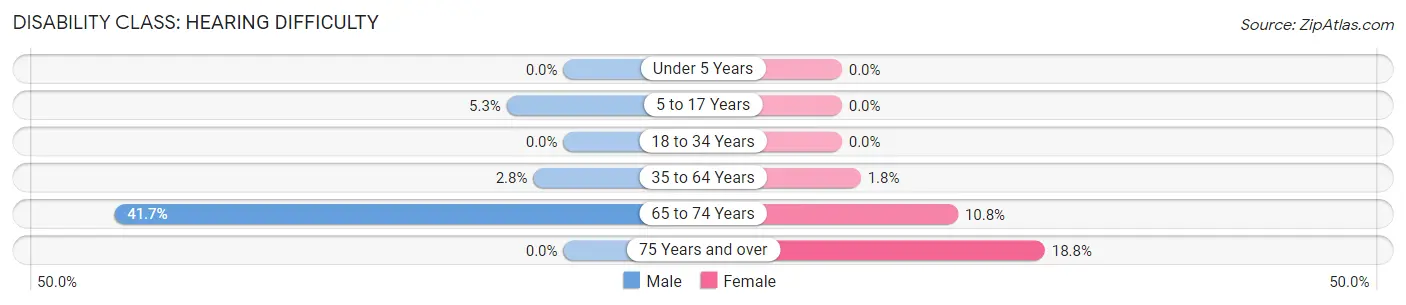
| Age Bracket | Male | Female |
| Under 5 Years | 0 (0.0%) | 0 (0.0%) |
| 5 to 17 Years | 10 (5.3%) | 0 (0.0%) |
| 18 to 34 Years | 0 (0.0%) | 0 (0.0%) |
| 35 to 64 Years | 8 (2.8%) | 8 (1.8%) |
| 65 to 74 Years | 40 (41.7%) | 18 (10.8%) |
| 75 Years and over | 0 (0.0%) | 13 (18.8%) |
Disability Class: Vision Difficulty
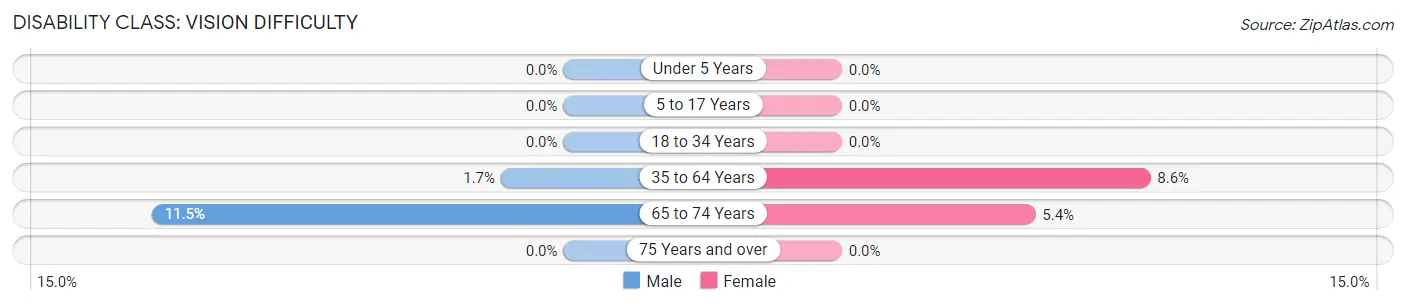
| Age Bracket | Male | Female |
| Under 5 Years | 0 (0.0%) | 0 (0.0%) |
| 5 to 17 Years | 0 (0.0%) | 0 (0.0%) |
| 18 to 34 Years | 0 (0.0%) | 0 (0.0%) |
| 35 to 64 Years | 5 (1.7%) | 39 (8.6%) |
| 65 to 74 Years | 11 (11.5%) | 9 (5.4%) |
| 75 Years and over | 0 (0.0%) | 0 (0.0%) |
Disability Class: Cognitive Difficulty
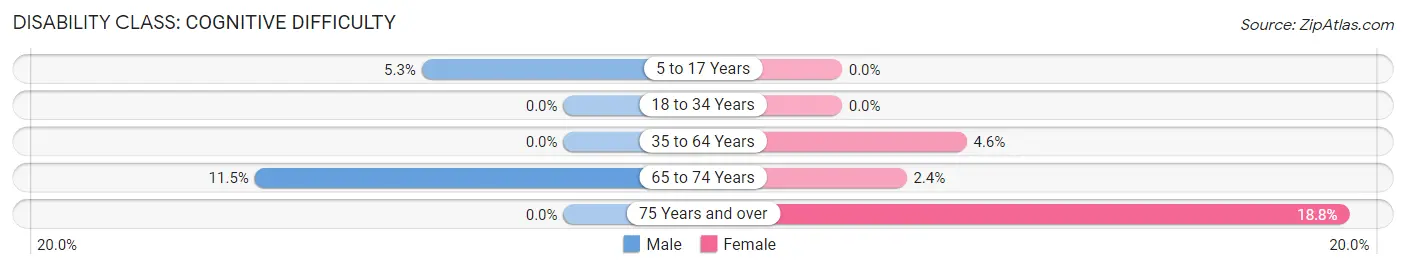
| Age Bracket | Male | Female |
| 5 to 17 Years | 10 (5.3%) | 0 (0.0%) |
| 18 to 34 Years | 0 (0.0%) | 0 (0.0%) |
| 35 to 64 Years | 0 (0.0%) | 21 (4.6%) |
| 65 to 74 Years | 11 (11.5%) | 4 (2.4%) |
| 75 Years and over | 0 (0.0%) | 13 (18.8%) |
Disability Class: Ambulatory Difficulty
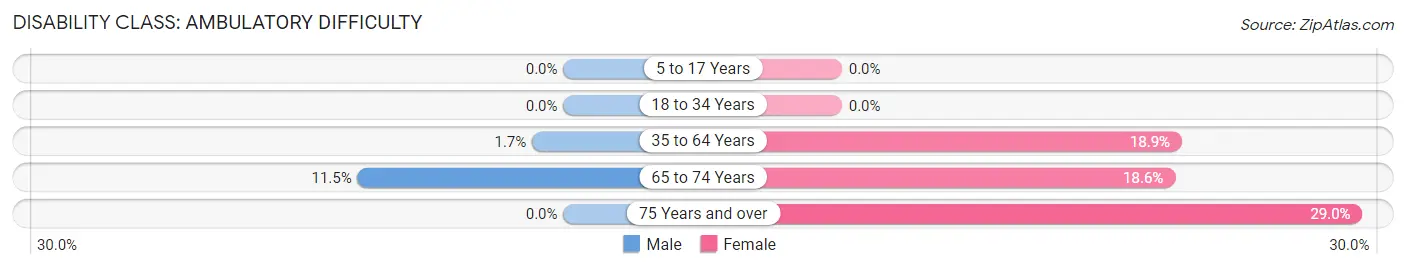
| Age Bracket | Male | Female |
| 5 to 17 Years | 0 (0.0%) | 0 (0.0%) |
| 18 to 34 Years | 0 (0.0%) | 0 (0.0%) |
| 35 to 64 Years | 5 (1.7%) | 86 (18.9%) |
| 65 to 74 Years | 11 (11.5%) | 31 (18.6%) |
| 75 Years and over | 0 (0.0%) | 20 (29.0%) |
Disability Class: Self-Care Difficulty
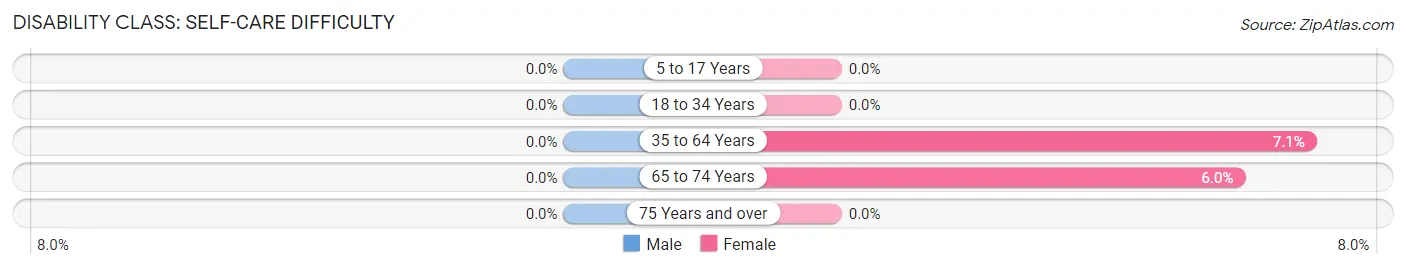
| Age Bracket | Male | Female |
| 5 to 17 Years | 0 (0.0%) | 0 (0.0%) |
| 18 to 34 Years | 0 (0.0%) | 0 (0.0%) |
| 35 to 64 Years | 0 (0.0%) | 32 (7.0%) |
| 65 to 74 Years | 0 (0.0%) | 10 (6.0%) |
| 75 Years and over | 0 (0.0%) | 0 (0.0%) |
Technology Access in Kirbyville
Computing Device Access in Kirbyville
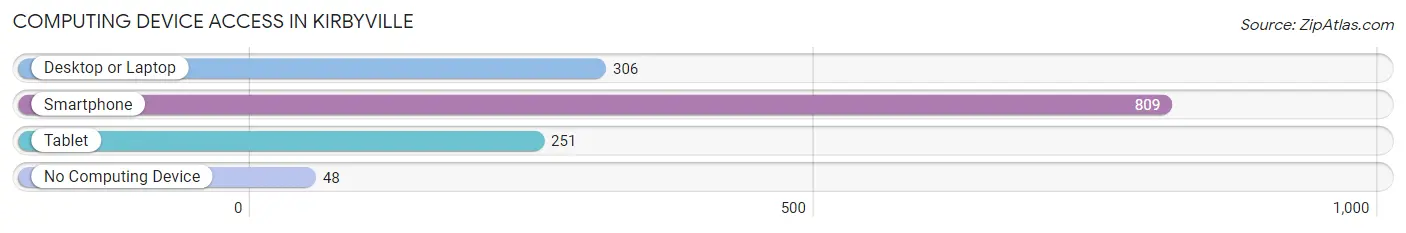
| Device Type | # Households | % Households |
| Desktop or Laptop | 306 | 34.9% |
| Smartphone | 809 | 92.2% |
| Tablet | 251 | 28.6% |
| No Computing Device | 48 | 5.5% |
| Total | 877 | 100.0% |
Internet Access in Kirbyville
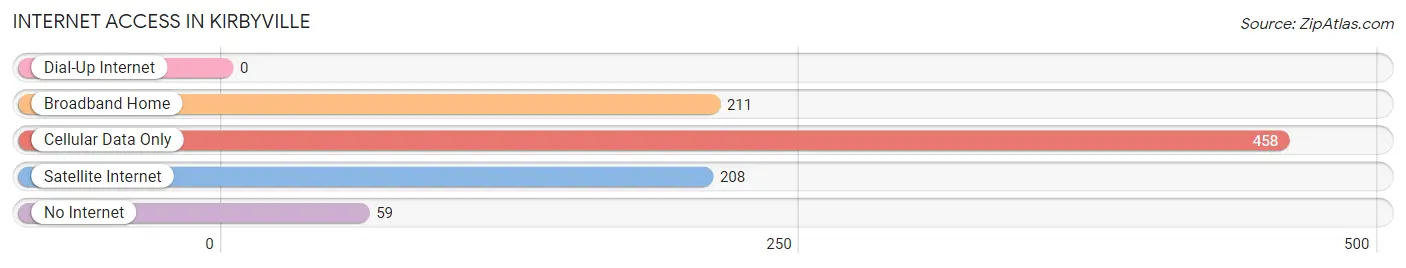
| Internet Type | # Households | % Households |
| Dial-Up Internet | 0 | 0.0% |
| Broadband Home | 211 | 24.1% |
| Cellular Data Only | 458 | 52.2% |
| Satellite Internet | 208 | 23.7% |
| No Internet | 59 | 6.7% |
| Total | 877 | 100.0% |
Kirbyville Summary
Kirbyville is a small city located in Jasper County, Texas, United States. It is situated on the banks of the Neches River, about 25 miles east of Beaumont. The population was 2,945 at the 2010 census.
History
Kirbyville was founded in 1883 by William Kirby, a former Confederate soldier. He named the town after himself and it quickly became a thriving community. The town was incorporated in 1891 and soon became a center for the lumber industry. The town was also home to a number of sawmills, cotton gins, and other businesses.
In the early 1900s, Kirbyville was a major stop on the Beaumont, Sour Lake and Western Railway. The railroad brought in many new residents and businesses, and the town continued to grow.
In the 1920s, the lumber industry began to decline and the town's population began to decline as well. However, the town was able to survive and in the 1940s, the economy began to improve. The town was home to a number of oil refineries and other industries, and the population began to grow again.
Geography
Kirbyville is located at 30°48'25" North, 94°14'17" West (30.806944, -94.238056). It is situated on the banks of the Neches River, about 25 miles east of Beaumont.
The city has a total area of 2.2 square miles, all of which is land. The terrain is mostly flat, with some rolling hills.
Economy
Kirbyville's economy is largely based on the oil and gas industry. The city is home to several oil refineries and other related businesses. The city is also home to a number of manufacturing and service businesses.
The city is also home to a number of retail stores restaurants and other businesses
Demographics
As of the 2010 census, there were 2,945 people, 1,093 households, and 745 families residing in the city. The population density was 1,334.2 people per square mile. The racial makeup of the city was 79.2% White, 16.2% African American, 0.3% Native American, 0.7% Asian, 0.1% Pacific Islander, 1.7% from other races, and 1.8% from two or more races. Hispanic or Latino of any race were 4.3% of the population.
The median income for a household in the city was $35,938, and the median income for a family was $41,250. Males had a median income of $31,250 versus $21,250 for females. The per capita income for the city was $17,845. About 11.2% of families and 14.2% of the population were below the poverty line, including 19.2% of those under age 18 and 11.2% of those age 65 or over.
Common Questions
What is the Total Population of Kirbyville?
Total Population of Kirbyville is 2,340.
What is the Total Male Population of Kirbyville?
Total Male Population of Kirbyville is 1,127.
What is the Total Female Population of Kirbyville?
Total Female Population of Kirbyville is 1,213.
What is the Ratio of Males per 100 Females in Kirbyville?
There are 92.91 Males per 100 Females in Kirbyville.
What is the Ratio of Females per 100 Males in Kirbyville?
There are 107.63 Females per 100 Males in Kirbyville.
What is the Median Population Age in Kirbyville?
Median Population Age in Kirbyville is 36.3 Years.
What is the Average Family Size in Kirbyville
Average Family Size in Kirbyville is 3.4 People.
What is the Average Household Size in Kirbyville
Average Household Size in Kirbyville is 2.6 People.
What is Per Capita Income in Kirbyville?
Per Capita income in Kirbyville is $19,284.
What is the Median Family Income in Kirbyville?
Median Family Income in Kirbyville is $35,556.
What is the Median Household income in Kirbyville?
Median Household Income in Kirbyville is $30,152.
What is Income or Wage Gap in Kirbyville?
Income or Wage Gap in Kirbyville is 38.6%.
Women in Kirbyville earn 61.4 cents for every dollar earned by a man.
What is Inequality or Gini Index in Kirbyville?
Inequality or Gini Index in Kirbyville is 0.52.
How Large is the Labor Force in Kirbyville?
There are 954 People in the Labor Forcein in Kirbyville.
What is the Percentage of People in the Labor Force in Kirbyville?
50.9% of People are in the Labor Force in Kirbyville.
What is the Unemployment Rate in Kirbyville?
Unemployment Rate in Kirbyville is 23.6%.