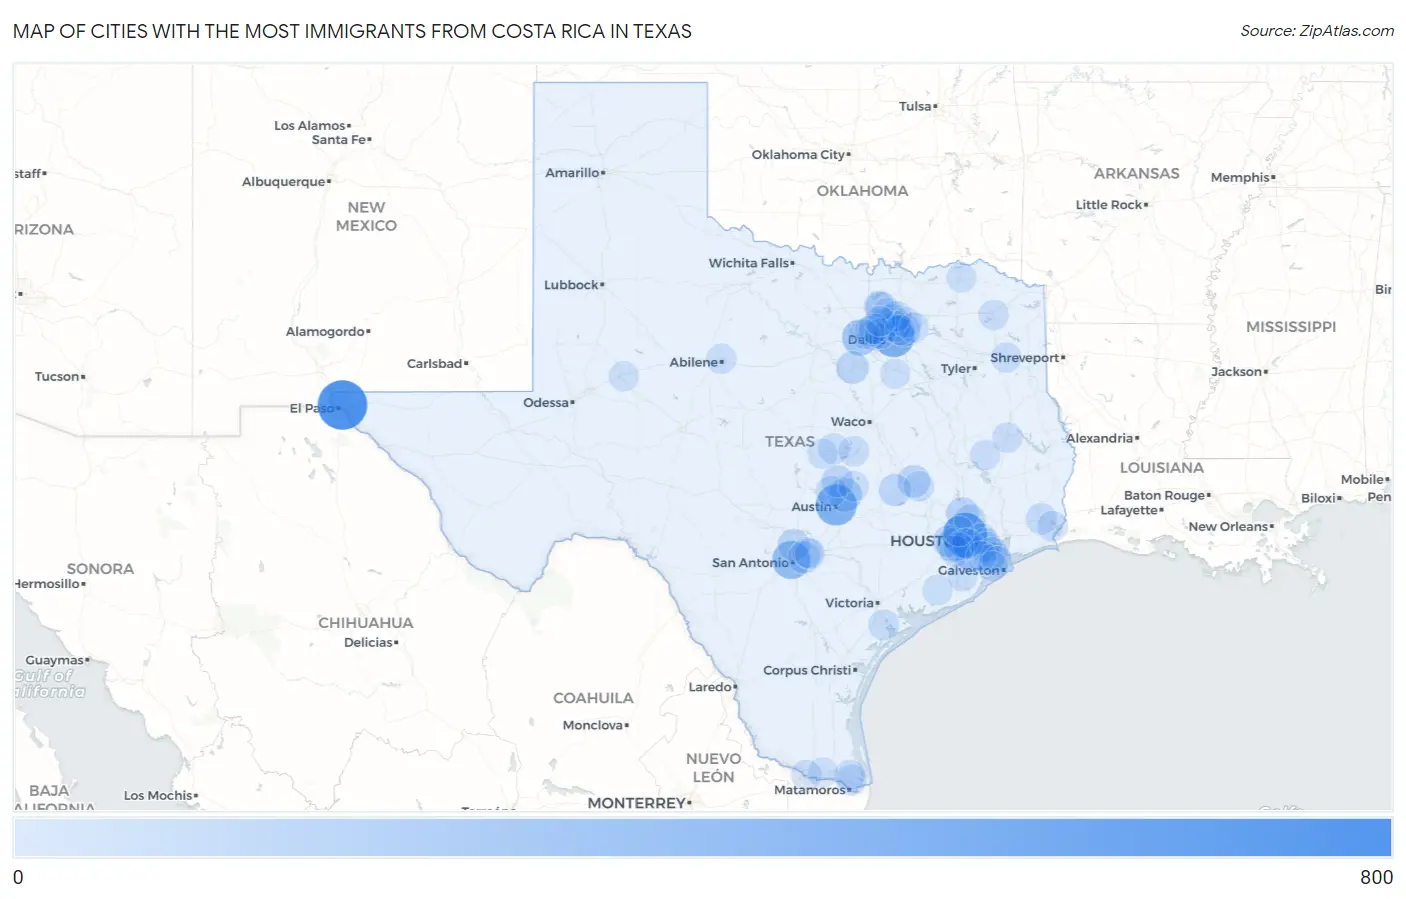
Cities with the Most Immigrants from Costa Rica in Texas
RELATED REPORTS & OPTIONS
Costa Rica
Texas
Compare Cities
Map of Cities with the Most Immigrants from Costa Rica in Texas
0
800
Cities with the Most Immigrants from Costa Rica in Texas
| City | Costa Rica | vs State | vs National | |
| 1. | El Paso | 780 | 6,336(12.31%)#1 | 95,844(0.81%)#8 |
| 2. | Houston | 565 | 6,336(8.92%)#2 | 95,844(0.59%)#14 |
| 3. | Dallas | 458 | 6,336(7.23%)#3 | 95,844(0.48%)#19 |
| 4. | Austin | 430 | 6,336(6.79%)#4 | 95,844(0.45%)#25 |
| 5. | San Antonio | 319 | 6,336(5.03%)#5 | 95,844(0.33%)#32 |
| 6. | Fort Worth | 228 | 6,336(3.60%)#6 | 95,844(0.24%)#51 |
| 7. | Pearland | 213 | 6,336(3.36%)#7 | 95,844(0.22%)#56 |
| 8. | Mission Bend | 161 | 6,336(2.54%)#8 | 95,844(0.17%)#86 |
| 9. | Pflugerville | 139 | 6,336(2.19%)#9 | 95,844(0.15%)#108 |
| 10. | Rowlett | 120 | 6,336(1.89%)#10 | 95,844(0.13%)#130 |
| 11. | The Woodlands | 109 | 6,336(1.72%)#11 | 95,844(0.11%)#148 |
| 12. | Cleburne | 97 | 6,336(1.53%)#12 | 95,844(0.10%)#169 |
| 13. | Bryan | 94 | 6,336(1.48%)#13 | 95,844(0.10%)#178 |
| 14. | Caldwell | 81 | 6,336(1.28%)#14 | 95,844(0.08%)#226 |
| 15. | Georgetown | 78 | 6,336(1.23%)#15 | 95,844(0.08%)#236 |
| 16. | Timberwood Park | 78 | 6,336(1.23%)#16 | 95,844(0.08%)#237 |
| 17. | Cinco Ranch | 75 | 6,336(1.18%)#17 | 95,844(0.08%)#248 |
| 18. | Carrollton | 72 | 6,336(1.14%)#18 | 95,844(0.08%)#260 |
| 19. | Converse | 69 | 6,336(1.09%)#19 | 95,844(0.07%)#274 |
| 20. | Providence Village | 59 | 6,336(0.93%)#20 | 95,844(0.06%)#336 |
| 21. | Plano | 53 | 6,336(0.84%)#21 | 95,844(0.06%)#359 |
| 22. | Spring | 53 | 6,336(0.84%)#22 | 95,844(0.06%)#362 |
| 23. | Deer Park | 51 | 6,336(0.80%)#23 | 95,844(0.05%)#371 |
| 24. | Frisco | 43 | 6,336(0.68%)#24 | 95,844(0.04%)#433 |
| 25. | Beaumont | 42 | 6,336(0.66%)#25 | 95,844(0.04%)#445 |
| 26. | Richardson | 36 | 6,336(0.57%)#26 | 95,844(0.04%)#509 |
| 27. | Pasadena | 35 | 6,336(0.55%)#27 | 95,844(0.04%)#517 |
| 28. | Cedar Park | 33 | 6,336(0.52%)#28 | 95,844(0.03%)#543 |
| 29. | Fort Hood | 32 | 6,336(0.51%)#29 | 95,844(0.03%)#568 |
| 30. | San Leon | 31 | 6,336(0.49%)#30 | 95,844(0.03%)#588 |
| 31. | Bellaire | 25 | 6,336(0.39%)#31 | 95,844(0.03%)#683 |
| 32. | Cloverleaf | 24 | 6,336(0.38%)#32 | 95,844(0.03%)#700 |
| 33. | Tivoli | 22 | 6,336(0.35%)#33 | 95,844(0.02%)#754 |
| 34. | Brownsville | 21 | 6,336(0.33%)#34 | 95,844(0.02%)#756 |
| 35. | Sugar Land | 20 | 6,336(0.32%)#35 | 95,844(0.02%)#784 |
| 36. | Allen | 20 | 6,336(0.32%)#36 | 95,844(0.02%)#785 |
| 37. | Temple | 19 | 6,336(0.30%)#37 | 95,844(0.02%)#810 |
| 38. | Dickinson | 19 | 6,336(0.30%)#38 | 95,844(0.02%)#817 |
| 39. | Laureles | 19 | 6,336(0.30%)#39 | 95,844(0.02%)#822 |
| 40. | Euless | 18 | 6,336(0.28%)#40 | 95,844(0.02%)#831 |
| 41. | Seabrook | 18 | 6,336(0.28%)#41 | 95,844(0.02%)#836 |
| 42. | North Richland Hills | 16 | 6,336(0.25%)#42 | 95,844(0.02%)#877 |
| 43. | Schertz | 16 | 6,336(0.25%)#43 | 95,844(0.02%)#880 |
| 44. | Port Neches | 15 | 6,336(0.24%)#44 | 95,844(0.02%)#925 |
| 45. | Wylie | 14 | 6,336(0.22%)#45 | 95,844(0.01%)#947 |
| 46. | Sienna | 14 | 6,336(0.22%)#46 | 95,844(0.01%)#959 |
| 47. | College Station | 13 | 6,336(0.21%)#47 | 95,844(0.01%)#975 |
| 48. | Longview | 13 | 6,336(0.21%)#48 | 95,844(0.01%)#976 |
| 49. | Bay City | 13 | 6,336(0.21%)#49 | 95,844(0.01%)#991 |
| 50. | Hidalgo | 13 | 6,336(0.21%)#50 | 95,844(0.01%)#994 |
| 51. | Krugerville | 13 | 6,336(0.21%)#51 | 95,844(0.01%)#1,012 |
| 52. | West University Place | 12 | 6,336(0.19%)#52 | 95,844(0.01%)#1,042 |
| 53. | Abilene | 11 | 6,336(0.17%)#53 | 95,844(0.01%)#1,059 |
| 54. | Lufkin | 11 | 6,336(0.17%)#54 | 95,844(0.01%)#1,076 |
| 55. | Colleyville | 11 | 6,336(0.17%)#55 | 95,844(0.01%)#1,084 |
| 56. | Mount Pleasant | 11 | 6,336(0.17%)#56 | 95,844(0.01%)#1,087 |
| 57. | Cibolo | 10 | 6,336(0.16%)#57 | 95,844(0.01%)#1,128 |
| 58. | Irving | 9 | 6,336(0.14%)#58 | 95,844(0.01%)#1,151 |
| 59. | Grapevine | 9 | 6,336(0.14%)#59 | 95,844(0.01%)#1,159 |
| 60. | Taylor | 9 | 6,336(0.14%)#60 | 95,844(0.01%)#1,173 |
| 61. | Meadows Place | 9 | 6,336(0.14%)#61 | 95,844(0.01%)#1,188 |
| 62. | Fate | 8 | 6,336(0.13%)#62 | 95,844(0.01%)#1,213 |
| 63. | Groveton | 8 | 6,336(0.13%)#63 | 95,844(0.01%)#1,234 |
| 64. | Holiday Lakes | 8 | 6,336(0.13%)#64 | 95,844(0.01%)#1,235 |
| 65. | Big Spring | 6 | 6,336(0.09%)#65 | 95,844(0.01%)#1,294 |
| 66. | Garland | 5 | 6,336(0.08%)#66 | 95,844(0.01%)#1,327 |
| 67. | Weslaco | 5 | 6,336(0.08%)#67 | 95,844(0.01%)#1,337 |
| 68. | Lewisville | 4 | 6,336(0.06%)#68 | 95,844(0.00%)#1,362 |
| 69. | Texas City | 4 | 6,336(0.06%)#69 | 95,844(0.00%)#1,364 |
| 70. | Friendswood | 4 | 6,336(0.06%)#70 | 95,844(0.00%)#1,366 |
| 71. | Jersey Village | 4 | 6,336(0.06%)#71 | 95,844(0.00%)#1,373 |
| 72. | La Marque | 3 | 6,336(0.05%)#72 | 95,844(0.00%)#1,393 |
| 73. | Kempner | 3 | 6,336(0.05%)#73 | 95,844(0.00%)#1,403 |
| 74. | Bardwell | 2 | 6,336(0.03%)#74 | 95,844(0.00%)#1,427 |
| 75. | Paris | 1 | 6,336(0.02%)#75 | 95,844(0.00%)#1,434 |
Common Questions
What are the Top 10 Cities with the Most Immigrants from Costa Rica in Texas?
Top 10 Cities with the Most Immigrants from Costa Rica in Texas are:
#1
780
#2
565
#3
458
#4
430
#5
319
#6
228
#7
213
#8
161
#9
139
#10
120
What city has the Most Immigrants from Costa Rica in Texas?
El Paso has the Most Immigrants from Costa Rica in Texas with 780.
What is the Total Immigrants from Costa Rica in the State of Texas?
Total Immigrants from Costa Rica in Texas is 6,336.
What is the Total Immigrants from Costa Rica in the United States?
Total Immigrants from Costa Rica in the United States is 95,844.