Cities with the Highest Percentage of Immigrants from Europe in Texas
RELATED REPORTS & OPTIONS
Europe
Texas
Compare Cities
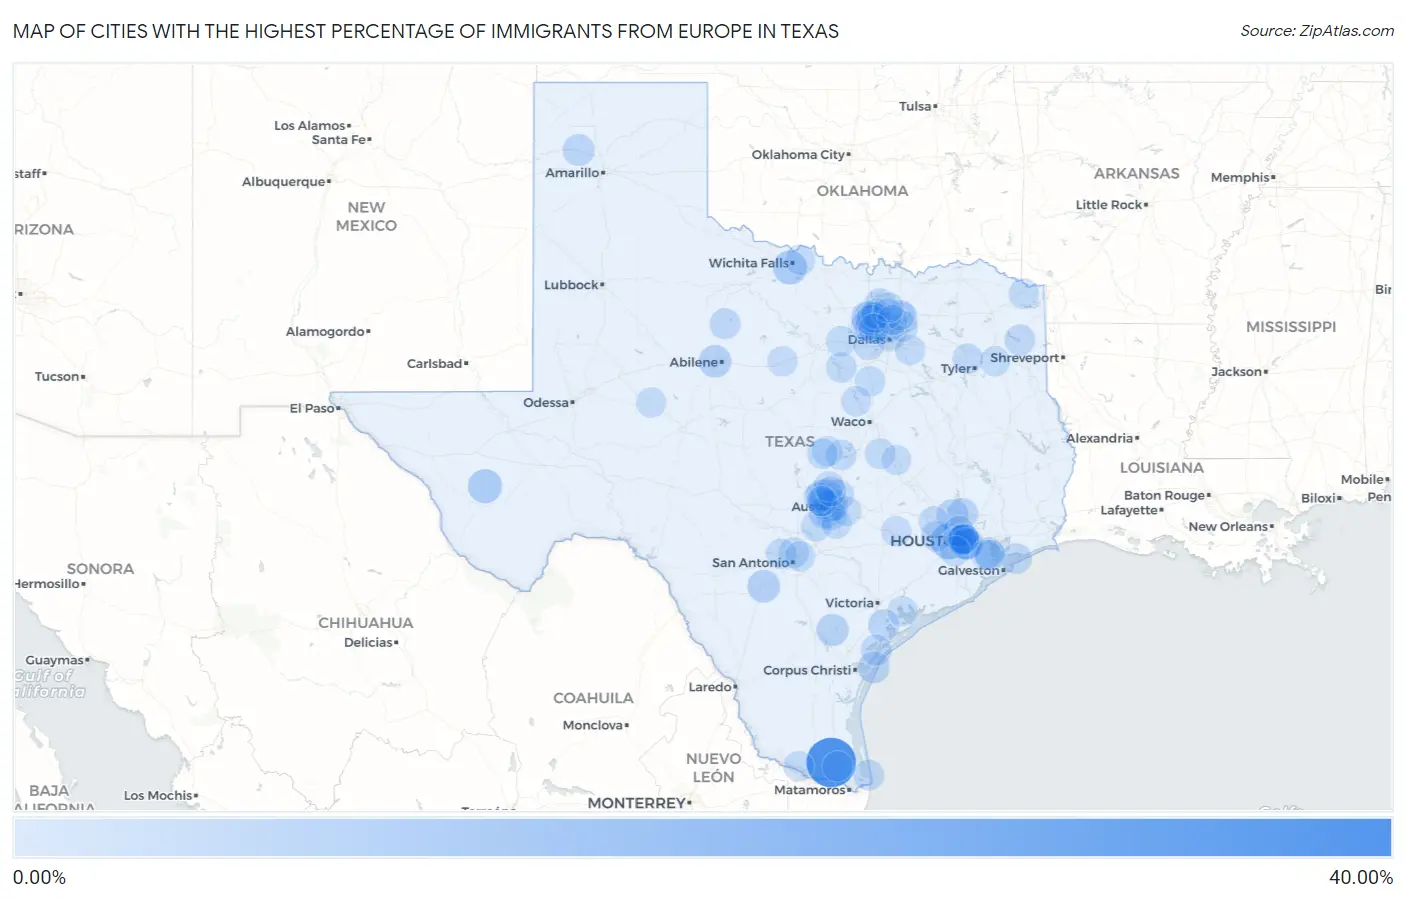
Map of Cities with the Highest Percentage of Immigrants from Europe in Texas
0.00%
40.00%
Cities with the Highest Percentage of Immigrants from Europe in Texas
| City | Europe | vs State | vs National | |
| 1. | Yznaga | 31.82% | 0.74%(+31.1)#1 | 1.46%(+30.4)#18 |
| 2. | Cinco Ranch | 10.58% | 0.74%(+9.84)#2 | 1.46%(+9.12)#180 |
| 3. | Fort Davis | 7.47% | 0.74%(+6.73)#3 | 1.46%(+6.01)#417 |
| 4. | Lakeside City | 7.33% | 0.74%(+6.59)#4 | 1.46%(+5.88)#433 |
| 5. | Waka | 6.67% | 0.74%(+5.93)#5 | 1.46%(+5.21)#528 |
| 6. | Lantana | 6.40% | 0.74%(+5.66)#6 | 1.46%(+4.94)#591 |
| 7. | South Frydek | 6.05% | 0.74%(+5.31)#7 | 1.46%(+4.59)#663 |
| 8. | Moore | 5.38% | 0.74%(+4.64)#8 | 1.46%(+3.92)#858 |
| 9. | Tye | 5.13% | 0.74%(+4.39)#9 | 1.46%(+3.68)#935 |
| 10. | Argyle | 4.79% | 0.74%(+4.05)#10 | 1.46%(+3.33)#1,040 |
| 11. | Blue Berry Hill | 4.68% | 0.74%(+3.94)#11 | 1.46%(+3.23)#1,098 |
| 12. | Volente | 4.49% | 0.74%(+3.75)#12 | 1.46%(+3.04)#1,187 |
| 13. | Hilshire Village | 4.37% | 0.74%(+3.63)#13 | 1.46%(+2.91)#1,246 |
| 14. | Bear Creek | 4.33% | 0.74%(+3.59)#14 | 1.46%(+2.87)#1,261 |
| 15. | Barton Creek | 4.33% | 0.74%(+3.59)#15 | 1.46%(+2.87)#1,263 |
| 16. | Rockwell Place | 4.33% | 0.74%(+3.59)#16 | 1.46%(+2.87)#1,264 |
| 17. | Stagecoach | 4.15% | 0.74%(+3.41)#17 | 1.46%(+2.70)#1,327 |
| 18. | Piney Point Village | 4.05% | 0.74%(+3.31)#18 | 1.46%(+2.59)#1,384 |
| 19. | Boys Ranch | 3.97% | 0.74%(+3.23)#19 | 1.46%(+2.51)#1,439 |
| 20. | Hedwig Village | 3.92% | 0.74%(+3.18)#20 | 1.46%(+2.47)#1,457 |
| 21. | Port Aransas | 3.91% | 0.74%(+3.17)#21 | 1.46%(+2.45)#1,467 |
| 22. | Bellaire | 3.72% | 0.74%(+2.98)#22 | 1.46%(+2.27)#1,580 |
| 23. | West Lake Hills | 3.72% | 0.74%(+2.98)#23 | 1.46%(+2.26)#1,582 |
| 24. | The Woodlands | 3.37% | 0.74%(+2.63)#24 | 1.46%(+1.92)#1,860 |
| 25. | Steiner Ranch | 3.22% | 0.74%(+2.48)#25 | 1.46%(+1.77)#1,986 |
| 26. | Tivoli | 3.18% | 0.74%(+2.45)#26 | 1.46%(+1.73)#2,012 |
| 27. | West University Place | 3.10% | 0.74%(+2.36)#27 | 1.46%(+1.65)#2,096 |
| 28. | Southside Place | 3.00% | 0.74%(+2.26)#28 | 1.46%(+1.54)#2,195 |
| 29. | Southlake | 2.98% | 0.74%(+2.24)#29 | 1.46%(+1.52)#2,213 |
| 30. | Coppell | 2.91% | 0.74%(+2.17)#30 | 1.46%(+1.45)#2,277 |
| 31. | Fulton | 2.82% | 0.74%(+2.08)#31 | 1.46%(+1.36)#2,386 |
| 32. | Bolivar Peninsula | 2.78% | 0.74%(+2.04)#32 | 1.46%(+1.32)#2,441 |
| 33. | Lago Vista | 2.71% | 0.74%(+1.97)#33 | 1.46%(+1.25)#2,514 |
| 34. | Stamford | 2.67% | 0.74%(+1.94)#34 | 1.46%(+1.22)#2,560 |
| 35. | Addison | 2.65% | 0.74%(+1.92)#35 | 1.46%(+1.20)#2,592 |
| 36. | Jersey Village | 2.55% | 0.74%(+1.81)#36 | 1.46%(+1.09)#2,741 |
| 37. | Belterra | 2.55% | 0.74%(+1.81)#37 | 1.46%(+1.09)#2,746 |
| 38. | Westlake | 2.54% | 0.74%(+1.80)#38 | 1.46%(+1.08)#2,753 |
| 39. | Aubrey | 2.51% | 0.74%(+1.77)#39 | 1.46%(+1.06)#2,788 |
| 40. | Hunters Creek Village | 2.51% | 0.74%(+1.77)#40 | 1.46%(+1.05)#2,791 |
| 41. | Pine Harbor | 2.48% | 0.74%(+1.74)#41 | 1.46%(+1.02)#2,847 |
| 42. | South Padre Island | 2.47% | 0.74%(+1.73)#42 | 1.46%(+1.02)#2,852 |
| 43. | El Lago | 2.47% | 0.74%(+1.73)#43 | 1.46%(+1.01)#2,864 |
| 44. | Pattison | 2.45% | 0.74%(+1.71)#44 | 1.46%(+0.991)#2,889 |
| 45. | Wells Branch | 2.42% | 0.74%(+1.68)#45 | 1.46%(+0.961)#2,914 |
| 46. | Lucas | 2.32% | 0.74%(+1.58)#46 | 1.46%(+0.868)#3,059 |
| 47. | Sachse | 2.32% | 0.74%(+1.58)#47 | 1.46%(+0.865)#3,063 |
| 48. | Rosebud | 2.26% | 0.74%(+1.52)#48 | 1.46%(+0.800)#3,153 |
| 49. | Hill Country Village | 2.24% | 0.74%(+1.51)#49 | 1.46%(+0.789)#3,174 |
| 50. | San Leanna | 2.24% | 0.74%(+1.50)#50 | 1.46%(+0.780)#3,196 |
| 51. | Huckabay | 2.22% | 0.74%(+1.48)#51 | 1.46%(+0.766)#3,217 |
| 52. | Harker Heights | 2.16% | 0.74%(+1.43)#52 | 1.46%(+0.708)#3,321 |
| 53. | Willow Park | 2.16% | 0.74%(+1.42)#53 | 1.46%(+0.700)#3,334 |
| 54. | Copperas Cove | 2.15% | 0.74%(+1.41)#54 | 1.46%(+0.693)#3,342 |
| 55. | Dalworthington Gardens | 2.13% | 0.74%(+1.39)#55 | 1.46%(+0.678)#3,356 |
| 56. | Pecan Plantation | 2.13% | 0.74%(+1.39)#56 | 1.46%(+0.675)#3,358 |
| 57. | Kempner | 2.08% | 0.74%(+1.34)#57 | 1.46%(+0.624)#3,456 |
| 58. | Santa Rita Ranch | 2.08% | 0.74%(+1.34)#58 | 1.46%(+0.623)#3,457 |
| 59. | Nassau Bay | 2.07% | 0.74%(+1.33)#59 | 1.46%(+0.615)#3,471 |
| 60. | Bee Cave | 2.03% | 0.74%(+1.29)#60 | 1.46%(+0.574)#3,541 |
| 61. | Wimberley | 2.03% | 0.74%(+1.29)#61 | 1.46%(+0.574)#3,542 |
| 62. | Highland Village | 2.02% | 0.74%(+1.28)#62 | 1.46%(+0.565)#3,561 |
| 63. | Copper Canyon | 1.98% | 0.74%(+1.24)#63 | 1.46%(+0.521)#3,657 |
| 64. | Itasca | 1.98% | 0.74%(+1.24)#64 | 1.46%(+0.519)#3,660 |
| 65. | Clear Lake Shores | 1.95% | 0.74%(+1.21)#65 | 1.46%(+0.492)#3,733 |
| 66. | Seis Lagos | 1.93% | 0.74%(+1.19)#66 | 1.46%(+0.473)#3,759 |
| 67. | Lindale | 1.93% | 0.74%(+1.19)#67 | 1.46%(+0.472)#3,761 |
| 68. | Perezville | 1.92% | 0.74%(+1.18)#68 | 1.46%(+0.468)#3,763 |
| 69. | Double Oak | 1.91% | 0.74%(+1.17)#69 | 1.46%(+0.453)#3,800 |
| 70. | Fairview | 1.88% | 0.74%(+1.14)#70 | 1.46%(+0.427)#3,850 |
| 71. | New Boston | 1.88% | 0.74%(+1.14)#71 | 1.46%(+0.425)#3,857 |
| 72. | Helotes | 1.87% | 0.74%(+1.13)#72 | 1.46%(+0.415)#3,878 |
| 73. | Bunker Hill Village | 1.86% | 0.74%(+1.12)#73 | 1.46%(+0.403)#3,900 |
| 74. | Briarcliff | 1.85% | 0.74%(+1.11)#74 | 1.46%(+0.392)#3,923 |
| 75. | Highland Park | 1.83% | 0.74%(+1.09)#75 | 1.46%(+0.377)#3,969 |
| 76. | Ranger | 1.82% | 0.74%(+1.08)#76 | 1.46%(+0.367)#3,989 |
| 77. | Windcrest | 1.80% | 0.74%(+1.06)#77 | 1.46%(+0.347)#4,025 |
| 78. | Sugar Land | 1.77% | 0.74%(+1.03)#78 | 1.46%(+0.311)#4,114 |
| 79. | Dean | 1.77% | 0.74%(+1.03)#79 | 1.46%(+0.310)#4,118 |
| 80. | Niederwald | 1.76% | 0.74%(+1.02)#80 | 1.46%(+0.300)#4,145 |
| 81. | Combes | 1.75% | 0.74%(+1.01)#81 | 1.46%(+0.295)#4,153 |
| 82. | Point Comfort | 1.75% | 0.74%(+1.01)#82 | 1.46%(+0.291)#4,163 |
| 83. | Shady Shores | 1.74% | 0.74%(+1.00)#83 | 1.46%(+0.287)#4,172 |
| 84. | Frisco | 1.74% | 0.74%(+0.998)#84 | 1.46%(+0.281)#4,187 |
| 85. | Fayetteville | 1.74% | 0.74%(+0.997)#85 | 1.46%(+0.280)#4,188 |
| 86. | Laguna Park | 1.69% | 0.74%(+0.954)#86 | 1.46%(+0.237)#4,289 |
| 87. | Spring Valley Village | 1.68% | 0.74%(+0.943)#87 | 1.46%(+0.226)#4,308 |
| 88. | The Hills | 1.68% | 0.74%(+0.938)#88 | 1.46%(+0.221)#4,323 |
| 89. | Liberty City | 1.67% | 0.74%(+0.933)#89 | 1.46%(+0.216)#4,333 |
| 90. | Pine Island | 1.67% | 0.74%(+0.930)#90 | 1.46%(+0.213)#4,338 |
| 91. | Plano | 1.66% | 0.74%(+0.926)#91 | 1.46%(+0.209)#4,347 |
| 92. | Leander | 1.66% | 0.74%(+0.925)#92 | 1.46%(+0.208)#4,349 |
| 93. | Garfield | 1.64% | 0.74%(+0.899)#93 | 1.46%(+0.182)#4,411 |
| 94. | Lakeway | 1.64% | 0.74%(+0.896)#94 | 1.46%(+0.179)#4,415 |
| 95. | Prosper | 1.62% | 0.74%(+0.877)#95 | 1.46%(+0.160)#4,463 |
| 96. | Grapevine | 1.61% | 0.74%(+0.874)#96 | 1.46%(+0.158)#4,473 |
| 97. | Calvert | 1.61% | 0.74%(+0.868)#97 | 1.46%(+0.151)#4,492 |
| 98. | Crandall | 1.59% | 0.74%(+0.850)#98 | 1.46%(+0.133)#4,558 |
| 99. | Sterling City | 1.59% | 0.74%(+0.847)#99 | 1.46%(+0.130)#4,569 |
| 100. | Cedar Park | 1.58% | 0.74%(+0.845)#100 | 1.46%(+0.128)#4,575 |
Common Questions
What are the Top 10 Cities with the Highest Percentage of Immigrants from Europe in Texas?
Top 10 Cities with the Highest Percentage of Immigrants from Europe in Texas are:
#1
31.82%
#2
10.58%
#3
7.47%
#4
7.33%
#5
6.40%
#6
5.38%
#7
5.13%
#8
4.79%
#9
4.68%
#10
4.49%
What city has the Highest Percentage of Immigrants from Europe in Texas?
Yznaga has the Highest Percentage of Immigrants from Europe in Texas with 31.82%.
What is the Percentage of Immigrants from Europe in the State of Texas?
Percentage of Immigrants from Europe in Texas is 0.74%.
What is the Percentage of Immigrants from Europe in the United States?
Percentage of Immigrants from Europe in the United States is 1.46%.