Cities with the Most Immigrants from Western Africa in Texas
RELATED REPORTS & OPTIONS
Western Africa
Texas
Compare Cities
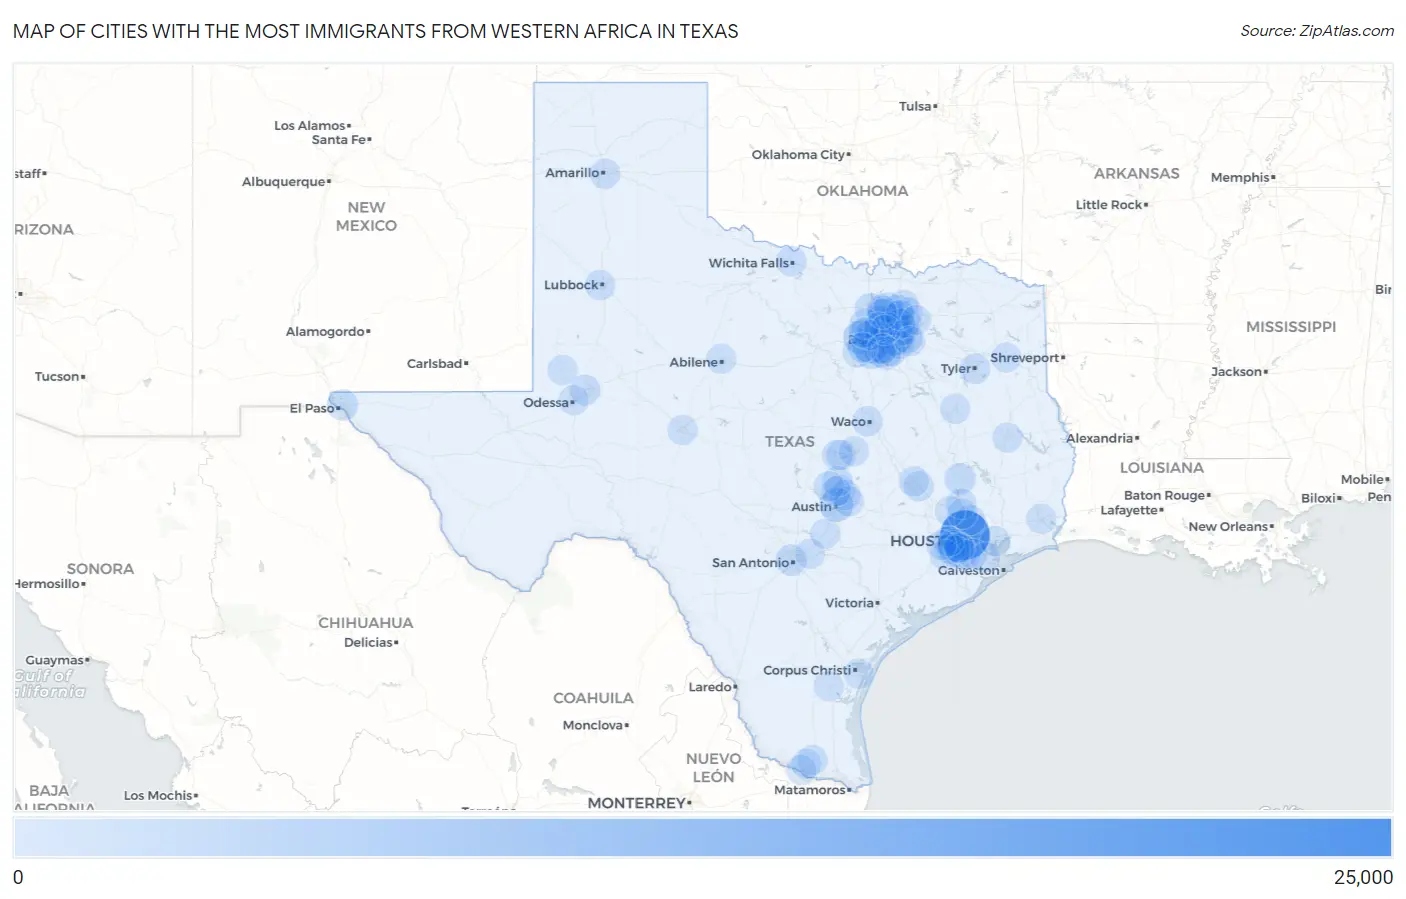
Map of Cities with the Most Immigrants from Western Africa in Texas
0
25,000
Cities with the Most Immigrants from Western Africa in Texas
| City | Western Africa | vs State | vs National | |
| 1. | Houston | 23,403 | 130,638(17.91%)#1 | 985,560(2.37%)#2 |
| 2. | Dallas | 10,008 | 130,638(7.66%)#2 | 985,560(1.02%)#10 |
| 3. | Arlington | 6,858 | 130,638(5.25%)#3 | 985,560(0.70%)#14 |
| 4. | Austin | 4,161 | 130,638(3.19%)#4 | 985,560(0.42%)#20 |
| 5. | Fort Worth | 4,032 | 130,638(3.09%)#5 | 985,560(0.41%)#21 |
| 6. | Grand Prairie | 3,667 | 130,638(2.81%)#6 | 985,560(0.37%)#25 |
| 7. | Irving | 2,767 | 130,638(2.12%)#7 | 985,560(0.28%)#33 |
| 8. | Mission Bend | 2,262 | 130,638(1.73%)#8 | 985,560(0.23%)#48 |
| 9. | Garland | 2,103 | 130,638(1.61%)#9 | 985,560(0.21%)#56 |
| 10. | Frisco | 1,297 | 130,638(0.99%)#10 | 985,560(0.13%)#94 |
| 11. | San Antonio | 1,278 | 130,638(0.98%)#11 | 985,560(0.13%)#96 |
| 12. | El Paso | 1,256 | 130,638(0.96%)#12 | 985,560(0.13%)#98 |
| 13. | Plano | 1,230 | 130,638(0.94%)#13 | 985,560(0.12%)#99 |
| 14. | Carrollton | 1,225 | 130,638(0.94%)#14 | 985,560(0.12%)#100 |
| 15. | Missouri City | 1,130 | 130,638(0.86%)#15 | 985,560(0.11%)#119 |
| 16. | Huntsville | 1,116 | 130,638(0.85%)#16 | 985,560(0.11%)#121 |
| 17. | Four Corners | 1,071 | 130,638(0.82%)#17 | 985,560(0.11%)#126 |
| 18. | Mckinney | 1,063 | 130,638(0.81%)#18 | 985,560(0.11%)#128 |
| 19. | Denton | 1,057 | 130,638(0.81%)#19 | 985,560(0.11%)#129 |
| 20. | Richardson | 984 | 130,638(0.75%)#20 | 985,560(0.10%)#135 |
| 21. | Sugar Land | 984 | 130,638(0.75%)#21 | 985,560(0.10%)#136 |
| 22. | Midland | 928 | 130,638(0.71%)#22 | 985,560(0.09%)#148 |
| 23. | Mansfield | 891 | 130,638(0.68%)#23 | 985,560(0.09%)#154 |
| 24. | Killeen | 736 | 130,638(0.56%)#24 | 985,560(0.07%)#181 |
| 25. | Lewisville | 680 | 130,638(0.52%)#25 | 985,560(0.07%)#202 |
| 26. | Euless | 653 | 130,638(0.50%)#26 | 985,560(0.07%)#214 |
| 27. | Tyler | 603 | 130,638(0.46%)#27 | 985,560(0.06%)#237 |
| 28. | Round Rock | 564 | 130,638(0.43%)#28 | 985,560(0.06%)#251 |
| 29. | Wichita Falls | 506 | 130,638(0.39%)#29 | 985,560(0.05%)#284 |
| 30. | Pflugerville | 500 | 130,638(0.38%)#30 | 985,560(0.05%)#287 |
| 31. | Conroe | 489 | 130,638(0.37%)#31 | 985,560(0.05%)#290 |
| 32. | Spring | 449 | 130,638(0.34%)#32 | 985,560(0.05%)#320 |
| 33. | Lubbock | 417 | 130,638(0.32%)#33 | 985,560(0.04%)#337 |
| 34. | Waco | 410 | 130,638(0.31%)#34 | 985,560(0.04%)#346 |
| 35. | Travis Ranch | 362 | 130,638(0.28%)#35 | 985,560(0.04%)#388 |
| 36. | Little Elm | 341 | 130,638(0.26%)#36 | 985,560(0.03%)#408 |
| 37. | Fresno | 314 | 130,638(0.24%)#37 | 985,560(0.03%)#441 |
| 38. | Allen | 311 | 130,638(0.24%)#38 | 985,560(0.03%)#443 |
| 39. | Rowlett | 307 | 130,638(0.24%)#39 | 985,560(0.03%)#449 |
| 40. | Amarillo | 301 | 130,638(0.23%)#40 | 985,560(0.03%)#457 |
| 41. | Manor | 297 | 130,638(0.23%)#41 | 985,560(0.03%)#465 |
| 42. | Pecan Grove | 295 | 130,638(0.23%)#42 | 985,560(0.03%)#468 |
| 43. | Georgetown | 284 | 130,638(0.22%)#43 | 985,560(0.03%)#487 |
| 44. | College Station | 274 | 130,638(0.21%)#44 | 985,560(0.03%)#504 |
| 45. | Desoto | 273 | 130,638(0.21%)#45 | 985,560(0.03%)#510 |
| 46. | Princeton | 270 | 130,638(0.21%)#46 | 985,560(0.03%)#516 |
| 47. | Wylie | 269 | 130,638(0.21%)#47 | 985,560(0.03%)#518 |
| 48. | Pearland | 257 | 130,638(0.20%)#48 | 985,560(0.03%)#538 |
| 49. | Bryan | 243 | 130,638(0.19%)#49 | 985,560(0.02%)#570 |
| 50. | Balch Springs | 238 | 130,638(0.18%)#50 | 985,560(0.02%)#576 |
| 51. | Melissa | 222 | 130,638(0.17%)#51 | 985,560(0.02%)#601 |
| 52. | North Richland Hills | 220 | 130,638(0.17%)#52 | 985,560(0.02%)#602 |
| 53. | Paloma Creek South | 213 | 130,638(0.16%)#53 | 985,560(0.02%)#614 |
| 54. | League City | 212 | 130,638(0.16%)#54 | 985,560(0.02%)#615 |
| 55. | Murphy | 208 | 130,638(0.16%)#55 | 985,560(0.02%)#626 |
| 56. | Cedar Hill | 205 | 130,638(0.16%)#56 | 985,560(0.02%)#640 |
| 57. | Edinburg | 200 | 130,638(0.15%)#57 | 985,560(0.02%)#651 |
| 58. | Bedford | 194 | 130,638(0.15%)#58 | 985,560(0.02%)#666 |
| 59. | Heartland | 189 | 130,638(0.14%)#59 | 985,560(0.02%)#680 |
| 60. | Rosenberg | 188 | 130,638(0.14%)#60 | 985,560(0.02%)#685 |
| 61. | Glenn Heights | 188 | 130,638(0.14%)#61 | 985,560(0.02%)#688 |
| 62. | Leander | 186 | 130,638(0.14%)#62 | 985,560(0.02%)#695 |
| 63. | Prosper | 182 | 130,638(0.14%)#63 | 985,560(0.02%)#704 |
| 64. | Addison | 179 | 130,638(0.14%)#64 | 985,560(0.02%)#713 |
| 65. | Odessa | 169 | 130,638(0.13%)#65 | 985,560(0.02%)#744 |
| 66. | Mission | 164 | 130,638(0.13%)#66 | 985,560(0.02%)#766 |
| 67. | The Woodlands | 161 | 130,638(0.12%)#67 | 985,560(0.02%)#776 |
| 68. | Coppell | 154 | 130,638(0.12%)#68 | 985,560(0.02%)#815 |
| 69. | Lancaster | 153 | 130,638(0.12%)#69 | 985,560(0.02%)#820 |
| 70. | Crowley | 152 | 130,638(0.12%)#70 | 985,560(0.02%)#825 |
| 71. | Harker Heights | 142 | 130,638(0.11%)#71 | 985,560(0.01%)#863 |
| 72. | Stafford | 141 | 130,638(0.11%)#72 | 985,560(0.01%)#869 |
| 73. | Roanoke | 138 | 130,638(0.11%)#73 | 985,560(0.01%)#888 |
| 74. | Palestine | 136 | 130,638(0.10%)#74 | 985,560(0.01%)#898 |
| 75. | Cinco Ranch | 134 | 130,638(0.10%)#75 | 985,560(0.01%)#906 |
| 76. | Farmers Branch | 133 | 130,638(0.10%)#76 | 985,560(0.01%)#908 |
| 77. | Watauga | 133 | 130,638(0.10%)#77 | 985,560(0.01%)#910 |
| 78. | Fairview | 121 | 130,638(0.09%)#78 | 985,560(0.01%)#967 |
| 79. | Corpus Christi | 120 | 130,638(0.09%)#79 | 985,560(0.01%)#968 |
| 80. | Lufkin | 117 | 130,638(0.09%)#80 | 985,560(0.01%)#988 |
| 81. | Longview | 105 | 130,638(0.08%)#81 | 985,560(0.01%)#1,046 |
| 82. | Duncanville | 105 | 130,638(0.08%)#82 | 985,560(0.01%)#1,048 |
| 83. | Cibolo | 105 | 130,638(0.08%)#83 | 985,560(0.01%)#1,049 |
| 84. | Temple | 103 | 130,638(0.08%)#84 | 985,560(0.01%)#1,058 |
| 85. | Abilene | 100 | 130,638(0.08%)#85 | 985,560(0.01%)#1,078 |
| 86. | Mcallen | 98 | 130,638(0.08%)#86 | 985,560(0.01%)#1,096 |
| 87. | Beaumont | 96 | 130,638(0.07%)#87 | 985,560(0.01%)#1,112 |
| 88. | Fulshear | 93 | 130,638(0.07%)#88 | 985,560(0.01%)#1,139 |
| 89. | Forest Hill | 93 | 130,638(0.07%)#89 | 985,560(0.01%)#1,140 |
| 90. | Josephine | 93 | 130,638(0.07%)#90 | 985,560(0.01%)#1,141 |
| 91. | Meadows Place | 92 | 130,638(0.07%)#91 | 985,560(0.01%)#1,151 |
| 92. | Kingsville | 90 | 130,638(0.07%)#92 | 985,560(0.01%)#1,165 |
| 93. | Magnolia | 88 | 130,638(0.07%)#93 | 985,560(0.01%)#1,187 |
| 94. | Brushy Creek | 80 | 130,638(0.06%)#94 | 985,560(0.01%)#1,256 |
| 95. | Forney | 78 | 130,638(0.06%)#95 | 985,560(0.01%)#1,281 |
| 96. | San Marcos | 76 | 130,638(0.06%)#96 | 985,560(0.01%)#1,296 |
| 97. | Andrews | 76 | 130,638(0.06%)#97 | 985,560(0.01%)#1,301 |
| 98. | San Angelo | 75 | 130,638(0.06%)#98 | 985,560(0.01%)#1,305 |
| 99. | Hackberry | 75 | 130,638(0.06%)#99 | 985,560(0.01%)#1,310 |
| 100. | Baytown | 73 | 130,638(0.06%)#100 | 985,560(0.01%)#1,324 |
Common Questions
What are the Top 10 Cities with the Most Immigrants from Western Africa in Texas?
Top 10 Cities with the Most Immigrants from Western Africa in Texas are:
#1
23,403
#2
10,008
#3
6,858
#4
4,161
#5
4,032
#6
3,667
#7
2,767
#8
2,262
#9
2,103
#10
1,297
What city has the Most Immigrants from Western Africa in Texas?
Houston has the Most Immigrants from Western Africa in Texas with 23,403.
What is the Total Immigrants from Western Africa in the State of Texas?
Total Immigrants from Western Africa in Texas is 130,638.
What is the Total Immigrants from Western Africa in the United States?
Total Immigrants from Western Africa in the United States is 985,560.