Cities with the Highest Percentage of Population with a Degree in Psychology in Texas
RELATED REPORTS & OPTIONS
Psychology
Texas
Compare Cities
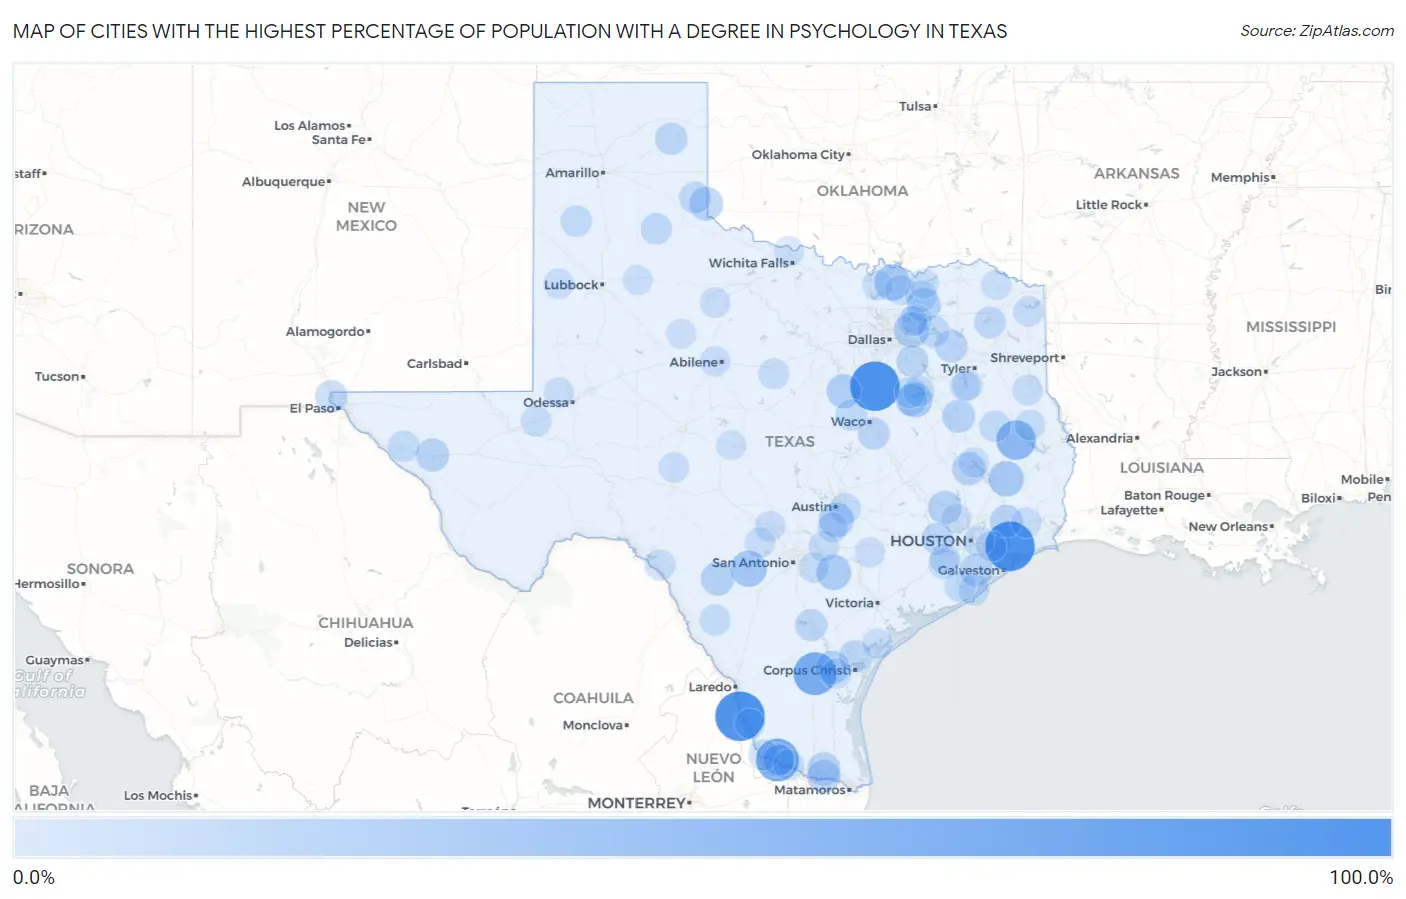
Map of Cities with the Highest Percentage of Population with a Degree in Psychology in Texas
0.0%
100.0%
Cities with the Highest Percentage of Population with a Degree in Psychology in Texas
| City | % Graduates | vs State | vs National | |
| 1. | San Ygnacio | 100.0% | 4.3%(+95.7)#1 | 5.1%(+94.9)#8 |
| 2. | Carl S Corner | 100.0% | 4.3%(+95.7)#2 | 5.1%(+94.9)#17 |
| 3. | Oak Island | 100.0% | 4.3%(+95.7)#3 | 5.1%(+94.9)#20 |
| 4. | Alice Acres | 69.8% | 4.3%(+65.5)#4 | 5.1%(+64.7)#75 |
| 5. | Garza Salinas Ii | 69.6% | 4.3%(+65.3)#5 | 5.1%(+64.5)#76 |
| 6. | Shelbyville | 58.3% | 4.3%(+54.0)#6 | 5.1%(+53.3)#126 |
| 7. | Huntington | 54.3% | 4.3%(+50.0)#7 | 5.1%(+49.2)#142 |
| 8. | D Hanis | 39.1% | 4.3%(+34.8)#8 | 5.1%(+34.1)#323 |
| 9. | Southmayd | 37.3% | 4.3%(+33.0)#9 | 5.1%(+32.2)#350 |
| 10. | Indian Springs | 36.0% | 4.3%(+31.7)#10 | 5.1%(+30.9)#372 |
| 11. | Nixon | 33.3% | 4.3%(+29.0)#11 | 5.1%(+28.3)#405 |
| 12. | Streetman | 33.3% | 4.3%(+29.0)#12 | 5.1%(+28.3)#409 |
| 13. | Creedmoor | 33.3% | 4.3%(+29.0)#13 | 5.1%(+28.3)#412 |
| 14. | Mobile City | 33.3% | 4.3%(+29.0)#14 | 5.1%(+28.3)#414 |
| 15. | Morgan | 30.0% | 4.3%(+25.7)#15 | 5.1%(+24.9)#492 |
| 16. | Las Lomas | 28.9% | 4.3%(+24.6)#16 | 5.1%(+23.9)#521 |
| 17. | Dodson | 28.6% | 4.3%(+24.3)#17 | 5.1%(+23.5)#548 |
| 18. | Celeste | 28.2% | 4.3%(+23.9)#18 | 5.1%(+23.2)#558 |
| 19. | Banquete | 28.1% | 4.3%(+23.8)#19 | 5.1%(+23.1)#563 |
| 20. | Todd Mission | 26.9% | 4.3%(+22.6)#20 | 5.1%(+21.9)#604 |
| 21. | Uvalde Estates | 26.6% | 4.3%(+22.3)#21 | 5.1%(+21.5)#617 |
| 22. | Riverside | 26.0% | 4.3%(+21.7)#22 | 5.1%(+21.0)#643 |
| 23. | Van Horn | 26.0% | 4.3%(+21.7)#23 | 5.1%(+20.9)#645 |
| 24. | Liverpool | 25.8% | 4.3%(+21.5)#24 | 5.1%(+20.8)#652 |
| 25. | Mila Doce | 25.7% | 4.3%(+21.4)#25 | 5.1%(+20.6)#659 |
| 26. | Progreso | 25.5% | 4.3%(+21.2)#26 | 5.1%(+20.4)#667 |
| 27. | Elkhart | 25.0% | 4.3%(+20.7)#27 | 5.1%(+19.9)#676 |
| 28. | Gause | 25.0% | 4.3%(+20.7)#28 | 5.1%(+19.9)#687 |
| 29. | Ames | 24.2% | 4.3%(+19.9)#29 | 5.1%(+19.1)#749 |
| 30. | Grand Saline | 23.0% | 4.3%(+18.7)#30 | 5.1%(+18.0)#816 |
| 31. | May | 22.9% | 4.3%(+18.6)#31 | 5.1%(+17.8)#820 |
| 32. | Miami | 21.9% | 4.3%(+17.6)#32 | 5.1%(+16.9)#888 |
| 33. | Cottonwood | 21.6% | 4.3%(+17.3)#33 | 5.1%(+16.5)#908 |
| 34. | Brookshire | 21.5% | 4.3%(+17.2)#34 | 5.1%(+16.4)#914 |
| 35. | Canutillo | 21.4% | 4.3%(+17.1)#35 | 5.1%(+16.3)#931 |
| 36. | Taft | 21.3% | 4.3%(+17.0)#36 | 5.1%(+16.3)#938 |
| 37. | Three Rivers | 21.0% | 4.3%(+16.7)#37 | 5.1%(+15.9)#963 |
| 38. | Golinda | 20.7% | 4.3%(+16.4)#38 | 5.1%(+15.6)#988 |
| 39. | Lakeside Town San Patricio County | 20.4% | 4.3%(+16.1)#39 | 5.1%(+15.4)#1,004 |
| 40. | Rocky Mound | 20.0% | 4.3%(+15.7)#40 | 5.1%(+14.9)#1,055 |
| 41. | West Tawakoni | 19.6% | 4.3%(+15.3)#41 | 5.1%(+14.6)#1,087 |
| 42. | Wellington | 19.6% | 4.3%(+15.3)#42 | 5.1%(+14.5)#1,091 |
| 43. | Richland | 19.6% | 4.3%(+15.3)#43 | 5.1%(+14.5)#1,094 |
| 44. | Turkey | 19.0% | 4.3%(+14.7)#44 | 5.1%(+14.0)#1,150 |
| 45. | Wells | 18.8% | 4.3%(+14.5)#45 | 5.1%(+13.7)#1,170 |
| 46. | Dimmitt | 18.7% | 4.3%(+14.4)#46 | 5.1%(+13.6)#1,187 |
| 47. | Sierra Blanca | 18.5% | 4.3%(+14.2)#47 | 5.1%(+13.5)#1,200 |
| 48. | Angus | 18.4% | 4.3%(+14.1)#48 | 5.1%(+13.3)#1,215 |
| 49. | Valley Mills | 18.3% | 4.3%(+14.0)#49 | 5.1%(+13.3)#1,218 |
| 50. | Leonard | 18.1% | 4.3%(+13.8)#50 | 5.1%(+13.0)#1,255 |
| 51. | Alamo Beach | 17.6% | 4.3%(+13.3)#51 | 5.1%(+12.5)#1,318 |
| 52. | Brazoria | 17.5% | 4.3%(+13.2)#52 | 5.1%(+12.4)#1,323 |
| 53. | Carrizo Springs | 17.1% | 4.3%(+12.8)#53 | 5.1%(+12.0)#1,369 |
| 54. | Hornsby Bend | 17.0% | 4.3%(+12.7)#54 | 5.1%(+11.9)#1,372 |
| 55. | Rice Tracts | 16.7% | 4.3%(+12.4)#55 | 5.1%(+11.7)#1,392 |
| 56. | Oyster Creek | 16.7% | 4.3%(+12.4)#56 | 5.1%(+11.6)#1,398 |
| 57. | Eureka | 16.7% | 4.3%(+12.4)#57 | 5.1%(+11.6)#1,428 |
| 58. | Carbon | 16.0% | 4.3%(+11.7)#58 | 5.1%(+10.9)#1,525 |
| 59. | Roma | 15.8% | 4.3%(+11.5)#59 | 5.1%(+10.8)#1,553 |
| 60. | Douglassville | 15.8% | 4.3%(+11.5)#60 | 5.1%(+10.7)#1,562 |
| 61. | Josephine | 15.7% | 4.3%(+11.4)#61 | 5.1%(+10.7)#1,570 |
| 62. | Val Verde Park | 15.7% | 4.3%(+11.4)#62 | 5.1%(+10.6)#1,576 |
| 63. | Sullivan City | 15.6% | 4.3%(+11.3)#63 | 5.1%(+10.6)#1,581 |
| 64. | La Puerta | 15.6% | 4.3%(+11.3)#64 | 5.1%(+10.6)#1,583 |
| 65. | Galena Park | 15.6% | 4.3%(+11.3)#65 | 5.1%(+10.5)#1,590 |
| 66. | Geronimo | 15.5% | 4.3%(+11.2)#66 | 5.1%(+10.5)#1,600 |
| 67. | Gary City | 15.4% | 4.3%(+11.1)#67 | 5.1%(+10.3)#1,628 |
| 68. | Needville | 15.2% | 4.3%(+10.9)#68 | 5.1%(+10.2)#1,658 |
| 69. | Wickett | 15.2% | 4.3%(+10.9)#69 | 5.1%(+10.1)#1,667 |
| 70. | Shadybrook | 15.1% | 4.3%(+10.8)#70 | 5.1%(+10.1)#1,676 |
| 71. | Chireno | 15.1% | 4.3%(+10.8)#71 | 5.1%(+10.0)#1,678 |
| 72. | Comfort | 15.1% | 4.3%(+10.8)#72 | 5.1%(+10.0)#1,681 |
| 73. | La Vernia | 14.7% | 4.3%(+10.4)#73 | 5.1%(+9.64)#1,742 |
| 74. | Pleak | 14.7% | 4.3%(+10.4)#74 | 5.1%(+9.63)#1,745 |
| 75. | Lake Kiowa | 14.5% | 4.3%(+10.2)#75 | 5.1%(+9.42)#1,796 |
| 76. | Eldorado | 14.4% | 4.3%(+10.1)#76 | 5.1%(+9.38)#1,799 |
| 77. | La Paloma Lost Creek | 14.3% | 4.3%(+9.99)#77 | 5.1%(+9.23)#1,819 |
| 78. | Whiteface | 14.3% | 4.3%(+9.99)#78 | 5.1%(+9.23)#1,825 |
| 79. | Nome | 14.3% | 4.3%(+9.99)#79 | 5.1%(+9.23)#1,828 |
| 80. | Rochester | 14.3% | 4.3%(+9.99)#80 | 5.1%(+9.23)#1,835 |
| 81. | Uhland | 14.1% | 4.3%(+9.80)#81 | 5.1%(+9.05)#1,879 |
| 82. | Westwood Shores | 13.7% | 4.3%(+9.43)#82 | 5.1%(+8.68)#1,965 |
| 83. | Tye | 13.7% | 4.3%(+9.43)#83 | 5.1%(+8.67)#1,966 |
| 84. | Moulton | 13.7% | 4.3%(+9.38)#84 | 5.1%(+8.62)#1,973 |
| 85. | Holiday Beach | 13.6% | 4.3%(+9.34)#85 | 5.1%(+8.59)#1,979 |
| 86. | Goldsmith | 13.6% | 4.3%(+9.34)#86 | 5.1%(+8.59)#1,981 |
| 87. | Morgan S Point | 13.5% | 4.3%(+9.21)#87 | 5.1%(+8.46)#2,005 |
| 88. | Annona | 13.3% | 4.3%(+9.03)#88 | 5.1%(+8.28)#2,058 |
| 89. | Bandera | 13.3% | 4.3%(+8.95)#89 | 5.1%(+8.20)#2,082 |
| 90. | Plum | 13.0% | 4.3%(+8.74)#90 | 5.1%(+7.99)#2,129 |
| 91. | Howe | 12.9% | 4.3%(+8.58)#91 | 5.1%(+7.83)#2,164 |
| 92. | Bonham | 12.8% | 4.3%(+8.51)#92 | 5.1%(+7.76)#2,180 |
| 93. | Burkburnett | 12.8% | 4.3%(+8.49)#93 | 5.1%(+7.74)#2,187 |
| 94. | Berryville | 12.7% | 4.3%(+8.40)#94 | 5.1%(+7.65)#2,208 |
| 95. | Medina | 12.7% | 4.3%(+8.37)#95 | 5.1%(+7.62)#2,216 |
| 96. | Melvin | 12.5% | 4.3%(+8.20)#96 | 5.1%(+7.45)#2,288 |
| 97. | Tomball | 12.5% | 4.3%(+8.16)#97 | 5.1%(+7.40)#2,303 |
| 98. | Crosbyton | 12.4% | 4.3%(+8.12)#98 | 5.1%(+7.37)#2,311 |
| 99. | Rotan | 12.4% | 4.3%(+8.11)#99 | 5.1%(+7.36)#2,313 |
| 100. | Nevada | 12.4% | 4.3%(+8.05)#100 | 5.1%(+7.30)#2,330 |
Common Questions
What are the Top 10 Cities with the Highest Percentage of Population with a Degree in Psychology in Texas?
Top 10 Cities with the Highest Percentage of Population with a Degree in Psychology in Texas are:
#1
100.0%
#2
100.0%
#3
100.0%
#4
69.8%
#5
69.6%
#6
54.3%
#7
39.1%
#8
37.3%
#9
36.0%
#10
33.3%
What city has the Highest Percentage of Population with a Degree in Psychology in Texas?
San Ygnacio has the Highest Percentage of Population with a Degree in Psychology in Texas with 100.0%.
What is the Percentage of Population with a Degree in Psychology in the State of Texas?
Percentage of Population with a Degree in Psychology in Texas is 4.3%.
What is the Percentage of Population with a Degree in Psychology in the United States?
Percentage of Population with a Degree in Psychology in the United States is 5.1%.