Zip Codes with the Highest Percentage of Population with a Degree in Visual and Performing Arts in Brownsville, TX
RELATED REPORTS & OPTIONS
Visual and Performing Arts
Brownsville
Compare Zip Codes
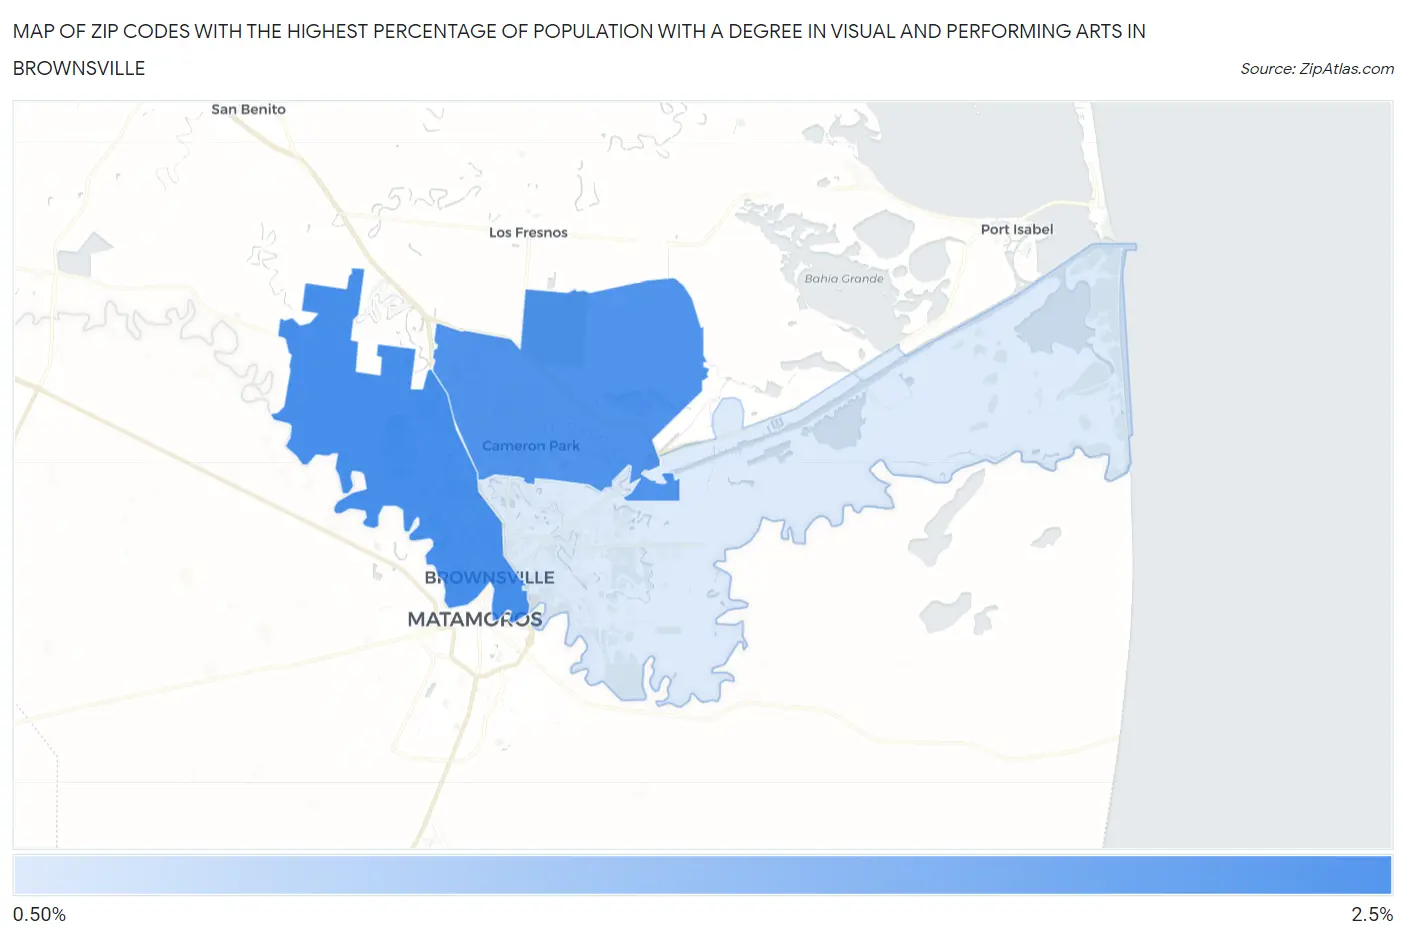
Map of Zip Codes with the Highest Percentage of Population with a Degree in Visual and Performing Arts in Brownsville
0.0%
2.5%
Zip Codes with the Highest Percentage of Population with a Degree in Visual and Performing Arts in Brownsville, TX
| Zip Code | % Graduates | vs State | vs National | |
| 1. | 78520 | 2.1% | 3.2%(-1.07)#825 | 4.3%(-2.12)#15,933 |
| 2. | 78526 | 2.1% | 3.2%(-1.13)#841 | 4.3%(-2.17)#16,119 |
| 3. | 78521 | 1.2% | 3.2%(-1.99)#1,057 | 4.3%(-3.04)#19,028 |
1
Common Questions
What are the Top Zip Codes with the Highest Percentage of Population with a Degree in Visual and Performing Arts in Brownsville, TX?
Top Zip Codes with the Highest Percentage of Population with a Degree in Visual and Performing Arts in Brownsville, TX are:
What zip code has the Highest Percentage of Population with a Degree in Visual and Performing Arts in Brownsville, TX?
78520 has the Highest Percentage of Population with a Degree in Visual and Performing Arts in Brownsville, TX with 2.1%.
What is the Percentage of Population with a Degree in Visual and Performing Arts in Brownsville, TX?
Percentage of Population with a Degree in Visual and Performing Arts in Brownsville is 2.0%.
What is the Percentage of Population with a Degree in Visual and Performing Arts in Texas?
Percentage of Population with a Degree in Visual and Performing Arts in Texas is 3.2%.
What is the Percentage of Population with a Degree in Visual and Performing Arts in the United States?
Percentage of Population with a Degree in Visual and Performing Arts in the United States is 4.3%.