Cities with the Lowest Poverty Level Among Families in Texas
RELATED REPORTS & OPTIONS
Lowest Family Poverty
Texas
Compare Cities
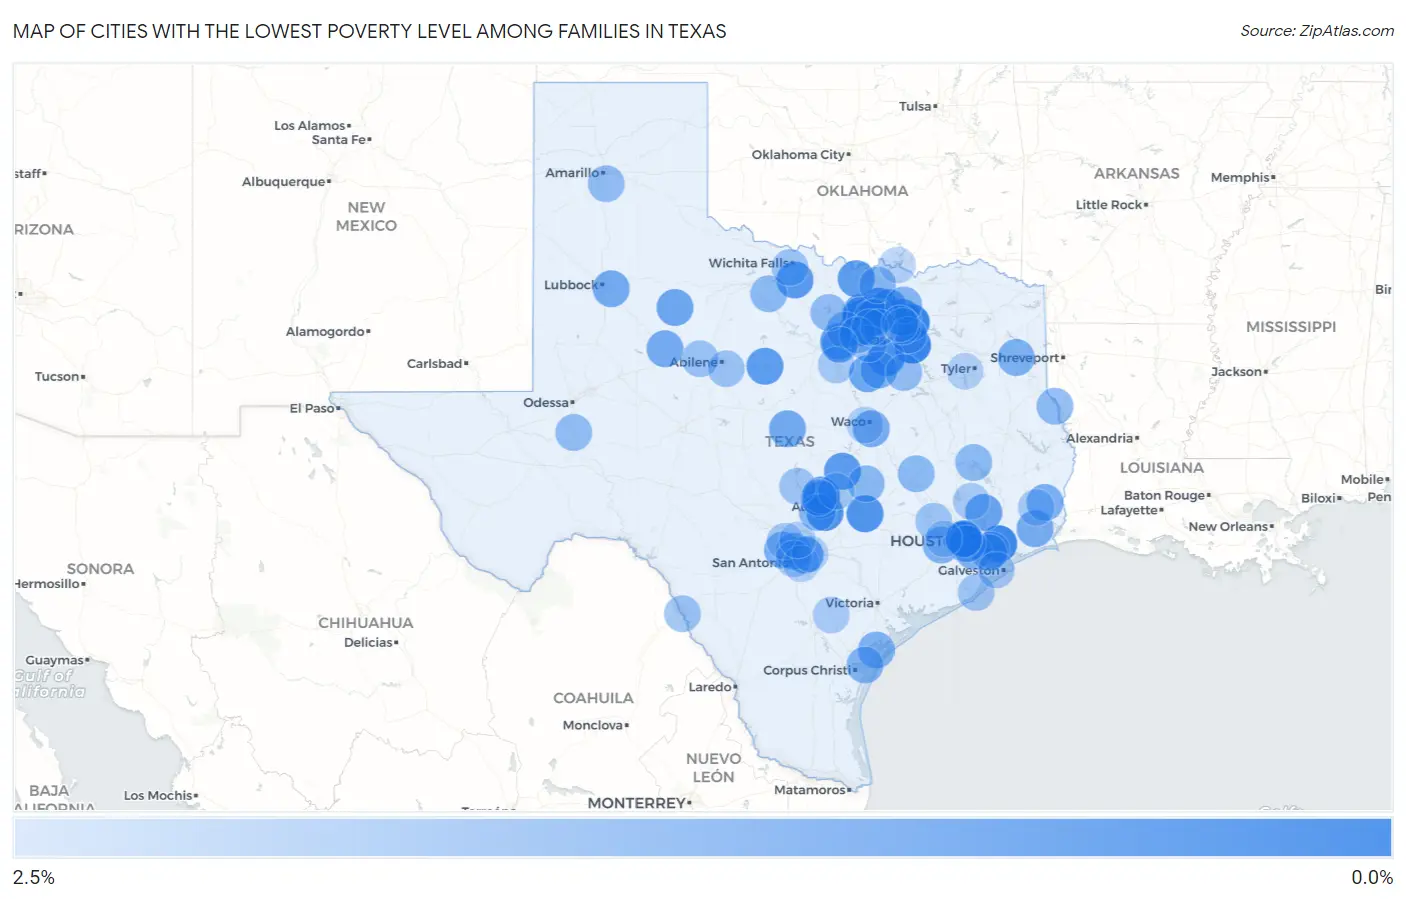
Map of Cities with the Lowest Poverty Level Among Families in Texas
2.5%
0.0%
Cities with the Lowest Poverty Level Among Families in Texas
| City | Family Poverty | vs State | vs National | |
| 1. | Talty | 0.28% | 10.7%(-10.4)#1 | 8.8%(-8.50)#16 |
| 2. | Haslet | 0.29% | 10.7%(-10.4)#2 | 8.8%(-8.49)#18 |
| 3. | Lavon | 0.31% | 10.7%(-10.4)#3 | 8.8%(-8.47)#22 |
| 4. | Beach City | 0.41% | 10.7%(-10.3)#4 | 8.8%(-8.37)#50 |
| 5. | Krugerville | 0.45% | 10.7%(-10.2)#5 | 8.8%(-8.33)#65 |
| 6. | Steiner Ranch | 0.53% | 10.7%(-10.1)#6 | 8.8%(-8.25)#105 |
| 7. | Piney Point Village | 0.61% | 10.7%(-10.1)#7 | 8.8%(-8.17)#160 |
| 8. | Oak Leaf | 0.61% | 10.7%(-10.1)#8 | 8.8%(-8.17)#165 |
| 9. | Bear Creek | 0.64% | 10.7%(-10.0)#9 | 8.8%(-8.14)#178 |
| 10. | Circle D Kc Estates | 0.64% | 10.7%(-10.0)#10 | 8.8%(-8.14)#179 |
| 11. | Oak Point | 0.64% | 10.7%(-10.0)#11 | 8.8%(-8.14)#180 |
| 12. | Hilshire Village | 0.68% | 10.7%(-9.99)#12 | 8.8%(-8.11)#208 |
| 13. | Lucas | 0.74% | 10.7%(-9.93)#13 | 8.8%(-8.05)#261 |
| 14. | Justin | 0.76% | 10.7%(-9.91)#14 | 8.8%(-8.02)#283 |
| 15. | Scotland | 0.77% | 10.7%(-9.90)#15 | 8.8%(-8.01)#292 |
| 16. | Jarrell | 0.81% | 10.7%(-9.86)#16 | 8.8%(-7.97)#327 |
| 17. | Ponder | 0.83% | 10.7%(-9.84)#17 | 8.8%(-7.95)#350 |
| 18. | Cisco | 0.83% | 10.7%(-9.84)#18 | 8.8%(-7.95)#354 |
| 19. | Muenster | 0.85% | 10.7%(-9.82)#19 | 8.8%(-7.93)#371 |
| 20. | Point Venture | 0.86% | 10.7%(-9.81)#20 | 8.8%(-7.92)#381 |
| 21. | Randolph Afb | 0.97% | 10.7%(-9.70)#21 | 8.8%(-7.81)#495 |
| 22. | Lago Vista | 0.97% | 10.7%(-9.70)#22 | 8.8%(-7.81)#499 |
| 23. | Roman Forest | 1.0% | 10.7%(-9.67)#23 | 8.8%(-7.78)#529 |
| 24. | Grandview | 1.1% | 10.7%(-9.60)#24 | 8.8%(-7.71)#624 |
| 25. | Jayton | 1.1% | 10.7%(-9.59)#25 | 8.8%(-7.71)#626 |
| 26. | Prosper | 1.1% | 10.7%(-9.57)#26 | 8.8%(-7.68)#650 |
| 27. | Santa Rita Ranch | 1.2% | 10.7%(-9.52)#27 | 8.8%(-7.63)#698 |
| 28. | Goldthwaite | 1.2% | 10.7%(-9.51)#28 | 8.8%(-7.63)#701 |
| 29. | Hermleigh | 1.2% | 10.7%(-9.49)#29 | 8.8%(-7.61)#731 |
| 30. | Ransom Canyon | 1.2% | 10.7%(-9.48)#30 | 8.8%(-7.59)#746 |
| 31. | Sienna | 1.2% | 10.7%(-9.47)#31 | 8.8%(-7.58)#756 |
| 32. | Dish | 1.2% | 10.7%(-9.47)#32 | 8.8%(-7.58)#759 |
| 33. | Annetta North | 1.2% | 10.7%(-9.47)#33 | 8.8%(-7.58)#766 |
| 34. | Robinson | 1.2% | 10.7%(-9.46)#34 | 8.8%(-7.58)#768 |
| 35. | Fannett | 1.2% | 10.7%(-9.45)#35 | 8.8%(-7.56)#781 |
| 36. | Lake Dallas | 1.2% | 10.7%(-9.42)#36 | 8.8%(-7.53)#828 |
| 37. | Maypearl | 1.3% | 10.7%(-9.40)#37 | 8.8%(-7.51)#855 |
| 38. | Evadale | 1.3% | 10.7%(-9.39)#38 | 8.8%(-7.51)#862 |
| 39. | Hallsville | 1.3% | 10.7%(-9.37)#39 | 8.8%(-7.48)#877 |
| 40. | Grey Forest | 1.3% | 10.7%(-9.35)#40 | 8.8%(-7.47)#899 |
| 41. | Shoreacres | 1.3% | 10.7%(-9.35)#41 | 8.8%(-7.46)#907 |
| 42. | Hudson Oaks | 1.3% | 10.7%(-9.35)#42 | 8.8%(-7.46)#908 |
| 43. | Fulton | 1.3% | 10.7%(-9.33)#43 | 8.8%(-7.44)#935 |
| 44. | Highland Village | 1.3% | 10.7%(-9.33)#44 | 8.8%(-7.44)#936 |
| 45. | Copper Canyon | 1.3% | 10.7%(-9.32)#45 | 8.8%(-7.44)#939 |
| 46. | Fulshear | 1.3% | 10.7%(-9.32)#46 | 8.8%(-7.43)#947 |
| 47. | Bellaire | 1.4% | 10.7%(-9.32)#47 | 8.8%(-7.43)#949 |
| 48. | Brookside Village | 1.4% | 10.7%(-9.30)#48 | 8.8%(-7.41)#974 |
| 49. | Ingleside On The Bay | 1.4% | 10.7%(-9.26)#49 | 8.8%(-7.37)#1,015 |
| 50. | Lakeside Town Tarrant County | 1.4% | 10.7%(-9.25)#50 | 8.8%(-7.36)#1,028 |
| 51. | Dripping Springs | 1.4% | 10.7%(-9.24)#51 | 8.8%(-7.35)#1,054 |
| 52. | Lake Kiowa | 1.5% | 10.7%(-9.21)#52 | 8.8%(-7.32)#1,085 |
| 53. | Hollywood Park | 1.5% | 10.7%(-9.21)#53 | 8.8%(-7.32)#1,094 |
| 54. | Sanctuary | 1.5% | 10.7%(-9.20)#54 | 8.8%(-7.31)#1,109 |
| 55. | Melissa | 1.5% | 10.7%(-9.20)#55 | 8.8%(-7.31)#1,114 |
| 56. | Thorndale | 1.5% | 10.7%(-9.16)#56 | 8.8%(-7.27)#1,158 |
| 57. | Megargel | 1.5% | 10.7%(-9.15)#57 | 8.8%(-7.27)#1,173 |
| 58. | Wixon Valley | 1.5% | 10.7%(-9.15)#58 | 8.8%(-7.27)#1,174 |
| 59. | Westwood Shores | 1.5% | 10.7%(-9.14)#59 | 8.8%(-7.25)#1,188 |
| 60. | Huxley | 1.5% | 10.7%(-9.13)#60 | 8.8%(-7.24)#1,208 |
| 61. | El Lago | 1.6% | 10.7%(-9.12)#61 | 8.8%(-7.23)#1,228 |
| 62. | Runaway Bay | 1.6% | 10.7%(-9.09)#62 | 8.8%(-7.20)#1,265 |
| 63. | Hunters Creek Village | 1.6% | 10.7%(-9.08)#63 | 8.8%(-7.19)#1,278 |
| 64. | Alma | 1.6% | 10.7%(-9.06)#64 | 8.8%(-7.17)#1,308 |
| 65. | Lake Tanglewood | 1.6% | 10.7%(-9.04)#65 | 8.8%(-7.16)#1,330 |
| 66. | Crane | 1.6% | 10.7%(-9.04)#66 | 8.8%(-7.15)#1,334 |
| 67. | Pantego | 1.7% | 10.7%(-9.01)#67 | 8.8%(-7.12)#1,372 |
| 68. | Willow Grove | 1.7% | 10.7%(-8.97)#68 | 8.8%(-7.09)#1,415 |
| 69. | Rosita | 1.7% | 10.7%(-8.93)#69 | 8.8%(-7.05)#1,490 |
| 70. | Saginaw | 1.7% | 10.7%(-8.92)#70 | 8.8%(-7.04)#1,506 |
| 71. | Trent | 1.8% | 10.7%(-8.92)#71 | 8.8%(-7.03)#1,521 |
| 72. | Potosi | 1.8% | 10.7%(-8.91)#72 | 8.8%(-7.02)#1,528 |
| 73. | Coppell | 1.8% | 10.7%(-8.89)#73 | 8.8%(-7.01)#1,557 |
| 74. | Lakeside City | 1.8% | 10.7%(-8.88)#74 | 8.8%(-7.00)#1,567 |
| 75. | Surfside Beach | 1.8% | 10.7%(-8.88)#75 | 8.8%(-7.00)#1,568 |
| 76. | Pine Island | 1.8% | 10.7%(-8.88)#76 | 8.8%(-6.99)#1,582 |
| 77. | Sunrise Beach Village | 1.8% | 10.7%(-8.87)#77 | 8.8%(-6.98)#1,594 |
| 78. | West University Place | 1.8% | 10.7%(-8.85)#78 | 8.8%(-6.96)#1,619 |
| 79. | Tiki Island | 1.8% | 10.7%(-8.83)#79 | 8.8%(-6.94)#1,639 |
| 80. | Brushy Creek | 1.9% | 10.7%(-8.81)#80 | 8.8%(-6.92)#1,671 |
| 81. | Spring Valley Village | 1.9% | 10.7%(-8.79)#81 | 8.8%(-6.91)#1,694 |
| 82. | Briarcliff | 1.9% | 10.7%(-8.78)#82 | 8.8%(-6.89)#1,730 |
| 83. | Canyon Creek | 1.9% | 10.7%(-8.78)#83 | 8.8%(-6.89)#1,732 |
| 84. | Fair Oaks Ranch | 1.9% | 10.7%(-8.73)#84 | 8.8%(-6.85)#1,803 |
| 85. | Lumberton | 1.9% | 10.7%(-8.73)#85 | 8.8%(-6.84)#1,813 |
| 86. | Cut And Shoot | 1.9% | 10.7%(-8.72)#86 | 8.8%(-6.84)#1,817 |
| 87. | Pettus | 2.0% | 10.7%(-8.71)#87 | 8.8%(-6.82)#1,834 |
| 88. | Heath | 2.0% | 10.7%(-8.71)#88 | 8.8%(-6.82)#1,842 |
| 89. | Alamo Heights | 2.0% | 10.7%(-8.68)#89 | 8.8%(-6.79)#1,879 |
| 90. | Sachse | 2.0% | 10.7%(-8.67)#90 | 8.8%(-6.79)#1,883 |
| 91. | Woodway | 2.0% | 10.7%(-8.63)#91 | 8.8%(-6.74)#1,945 |
| 92. | China Grove | 2.1% | 10.7%(-8.62)#92 | 8.8%(-6.73)#1,968 |
| 93. | Cibolo | 2.1% | 10.7%(-8.60)#93 | 8.8%(-6.71)#1,986 |
| 94. | Chandler | 2.1% | 10.7%(-8.60)#94 | 8.8%(-6.71)#1,990 |
| 95. | Preston | 2.1% | 10.7%(-8.58)#95 | 8.8%(-6.69)#2,015 |
| 96. | Katy | 2.1% | 10.7%(-8.57)#96 | 8.8%(-6.68)#2,026 |
| 97. | Bulverde | 2.1% | 10.7%(-8.57)#97 | 8.8%(-6.68)#2,029 |
| 98. | Southlake | 2.1% | 10.7%(-8.56)#98 | 8.8%(-6.68)#2,044 |
| 99. | Murphy | 2.1% | 10.7%(-8.54)#99 | 8.8%(-6.65)#2,076 |
| 100. | Annetta | 2.2% | 10.7%(-8.52)#100 | 8.8%(-6.63)#2,108 |
Common Questions
What are the Top 10 Cities with the Lowest Poverty Level Among Families in Texas?
Top 10 Cities with the Lowest Poverty Level Among Families in Texas are:
#1
0.28%
#2
0.29%
#3
0.31%
#4
0.41%
#5
0.45%
#6
0.61%
#7
0.61%
#8
0.64%
#9
0.64%
#10
0.64%
What city has the Lowest Poverty Level Among Families in Texas?
Talty has the Lowest Poverty Level Among Families in Texas with 0.28%.
What is the Poverty Level Among Families in the State of Texas?
Poverty Level Among Families in Texas is 10.7%.
What is the Poverty Level Among Families in the United States?
Poverty Level Among Families in the United States is 8.8%.