Cities with the Most Immigrants from Malaysia in Texas
RELATED REPORTS & OPTIONS
Malaysia
Texas
Compare Cities
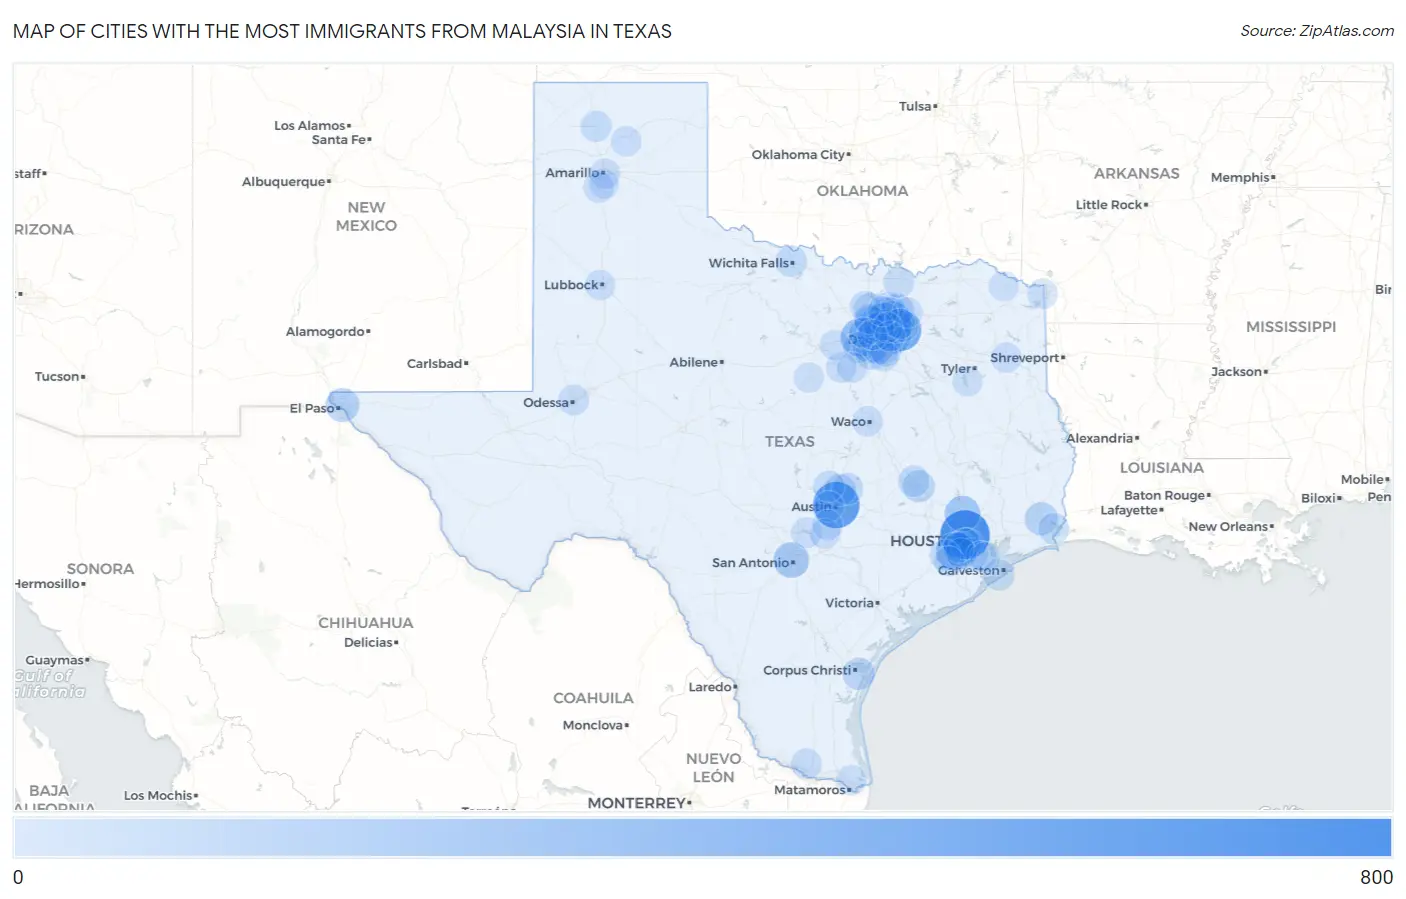
Map of Cities with the Most Immigrants from Malaysia in Texas
0
800
Cities with the Most Immigrants from Malaysia in Texas
| City | Malaysia | vs State | vs National | |
| 1. | Houston | 782 | 8,227(9.51%)#1 | 82,574(0.95%)#8 |
| 2. | Austin | 655 | 8,227(7.96%)#2 | 82,574(0.79%)#11 |
| 3. | Garland | 489 | 8,227(5.94%)#3 | 82,574(0.59%)#19 |
| 4. | Fort Worth | 325 | 8,227(3.95%)#4 | 82,574(0.39%)#29 |
| 5. | Sugar Land | 313 | 8,227(3.80%)#5 | 82,574(0.38%)#30 |
| 6. | Plano | 287 | 8,227(3.49%)#6 | 82,574(0.35%)#31 |
| 7. | The Woodlands | 216 | 8,227(2.63%)#7 | 82,574(0.26%)#49 |
| 8. | San Antonio | 208 | 8,227(2.53%)#8 | 82,574(0.25%)#51 |
| 9. | Arlington | 197 | 8,227(2.39%)#9 | 82,574(0.24%)#56 |
| 10. | Stafford | 194 | 8,227(2.36%)#10 | 82,574(0.23%)#58 |
| 11. | Dallas | 190 | 8,227(2.31%)#11 | 82,574(0.23%)#59 |
| 12. | Lewisville | 159 | 8,227(1.93%)#12 | 82,574(0.19%)#75 |
| 13. | Richardson | 152 | 8,227(1.85%)#13 | 82,574(0.18%)#77 |
| 14. | Sienna | 151 | 8,227(1.84%)#14 | 82,574(0.18%)#80 |
| 15. | El Paso | 145 | 8,227(1.76%)#15 | 82,574(0.18%)#84 |
| 16. | Frisco | 125 | 8,227(1.52%)#16 | 82,574(0.15%)#105 |
| 17. | Beaumont | 114 | 8,227(1.39%)#17 | 82,574(0.14%)#115 |
| 18. | Mckinney | 87 | 8,227(1.06%)#18 | 82,574(0.11%)#156 |
| 19. | Grand Prairie | 82 | 8,227(1.00%)#19 | 82,574(0.10%)#164 |
| 20. | College Station | 77 | 8,227(0.94%)#20 | 82,574(0.09%)#179 |
| 21. | Corpus Christi | 76 | 8,227(0.92%)#21 | 82,574(0.09%)#181 |
| 22. | Southlake | 66 | 8,227(0.80%)#22 | 82,574(0.08%)#213 |
| 23. | Mansfield | 63 | 8,227(0.77%)#23 | 82,574(0.08%)#230 |
| 24. | Irving | 61 | 8,227(0.74%)#24 | 82,574(0.07%)#235 |
| 25. | Denton | 61 | 8,227(0.74%)#25 | 82,574(0.07%)#236 |
| 26. | Round Rock | 61 | 8,227(0.74%)#26 | 82,574(0.07%)#237 |
| 27. | Hutto | 56 | 8,227(0.68%)#27 | 82,574(0.07%)#264 |
| 28. | Bryan | 53 | 8,227(0.64%)#28 | 82,574(0.06%)#275 |
| 29. | Galveston | 52 | 8,227(0.63%)#29 | 82,574(0.06%)#284 |
| 30. | Wichita Falls | 46 | 8,227(0.56%)#30 | 82,574(0.06%)#316 |
| 31. | Sachse | 44 | 8,227(0.53%)#31 | 82,574(0.05%)#326 |
| 32. | Pearland | 41 | 8,227(0.50%)#32 | 82,574(0.05%)#341 |
| 33. | North Richland Hills | 40 | 8,227(0.49%)#33 | 82,574(0.05%)#350 |
| 34. | Leander | 40 | 8,227(0.49%)#34 | 82,574(0.05%)#353 |
| 35. | West University Place | 39 | 8,227(0.47%)#35 | 82,574(0.05%)#366 |
| 36. | Belterra | 37 | 8,227(0.45%)#36 | 82,574(0.04%)#384 |
| 37. | Groves | 35 | 8,227(0.43%)#37 | 82,574(0.04%)#405 |
| 38. | Carrollton | 34 | 8,227(0.41%)#38 | 82,574(0.04%)#409 |
| 39. | Grapevine | 34 | 8,227(0.41%)#39 | 82,574(0.04%)#412 |
| 40. | Bellaire | 34 | 8,227(0.41%)#40 | 82,574(0.04%)#420 |
| 41. | Dumas | 34 | 8,227(0.41%)#41 | 82,574(0.04%)#421 |
| 42. | Flower Mound | 32 | 8,227(0.39%)#42 | 82,574(0.04%)#438 |
| 43. | Missouri City | 32 | 8,227(0.39%)#43 | 82,574(0.04%)#439 |
| 44. | Odessa | 28 | 8,227(0.34%)#44 | 82,574(0.03%)#478 |
| 45. | Rosenberg | 27 | 8,227(0.33%)#45 | 82,574(0.03%)#496 |
| 46. | Prosper | 25 | 8,227(0.30%)#46 | 82,574(0.03%)#518 |
| 47. | Duncanville | 24 | 8,227(0.29%)#47 | 82,574(0.03%)#533 |
| 48. | Mcallen | 23 | 8,227(0.28%)#48 | 82,574(0.03%)#546 |
| 49. | Edgecliff Village | 23 | 8,227(0.28%)#49 | 82,574(0.03%)#563 |
| 50. | Sherman | 21 | 8,227(0.26%)#50 | 82,574(0.03%)#578 |
| 51. | Desoto | 20 | 8,227(0.24%)#51 | 82,574(0.02%)#594 |
| 52. | The Colony | 20 | 8,227(0.24%)#52 | 82,574(0.02%)#597 |
| 53. | Longview | 18 | 8,227(0.22%)#53 | 82,574(0.02%)#636 |
| 54. | Canyon | 18 | 8,227(0.22%)#54 | 82,574(0.02%)#646 |
| 55. | Canyon Lake | 15 | 8,227(0.18%)#55 | 82,574(0.02%)#735 |
| 56. | Waco | 14 | 8,227(0.17%)#56 | 82,574(0.02%)#752 |
| 57. | Princeton | 14 | 8,227(0.17%)#57 | 82,574(0.02%)#778 |
| 58. | Pecan Plantation | 14 | 8,227(0.17%)#58 | 82,574(0.02%)#786 |
| 59. | Weatherford | 13 | 8,227(0.16%)#59 | 82,574(0.02%)#805 |
| 60. | Borger | 13 | 8,227(0.16%)#60 | 82,574(0.02%)#819 |
| 61. | Lubbock | 12 | 8,227(0.15%)#61 | 82,574(0.01%)#828 |
| 62. | Amarillo | 12 | 8,227(0.15%)#62 | 82,574(0.01%)#829 |
| 63. | Murphy | 12 | 8,227(0.15%)#63 | 82,574(0.01%)#855 |
| 64. | Ovilla | 12 | 8,227(0.15%)#64 | 82,574(0.01%)#876 |
| 65. | Barton Creek | 12 | 8,227(0.15%)#65 | 82,574(0.01%)#877 |
| 66. | Krum | 11 | 8,227(0.13%)#66 | 82,574(0.01%)#918 |
| 67. | Coppell | 10 | 8,227(0.12%)#67 | 82,574(0.01%)#934 |
| 68. | Bartonville | 10 | 8,227(0.12%)#68 | 82,574(0.01%)#963 |
| 69. | Friendswood | 8 | 8,227(0.10%)#69 | 82,574(0.01%)#1,022 |
| 70. | Watauga | 8 | 8,227(0.10%)#70 | 82,574(0.01%)#1,031 |
| 71. | San Marcos | 7 | 8,227(0.09%)#71 | 82,574(0.01%)#1,064 |
| 72. | Kyle | 7 | 8,227(0.09%)#72 | 82,574(0.01%)#1,067 |
| 73. | Texarkana | 7 | 8,227(0.09%)#73 | 82,574(0.01%)#1,070 |
| 74. | Cleburne | 7 | 8,227(0.09%)#74 | 82,574(0.01%)#1,071 |
| 75. | Addison | 7 | 8,227(0.09%)#75 | 82,574(0.01%)#1,077 |
| 76. | Euless | 6 | 8,227(0.07%)#76 | 82,574(0.01%)#1,102 |
| 77. | Stephenville | 6 | 8,227(0.07%)#77 | 82,574(0.01%)#1,112 |
| 78. | Highland Park | 6 | 8,227(0.07%)#78 | 82,574(0.01%)#1,119 |
| 79. | Emerald Bay | 6 | 8,227(0.07%)#79 | 82,574(0.01%)#1,136 |
| 80. | Brownsville | 5 | 8,227(0.06%)#80 | 82,574(0.01%)#1,141 |
| 81. | League City | 5 | 8,227(0.06%)#81 | 82,574(0.01%)#1,145 |
| 82. | Little Elm | 4 | 8,227(0.05%)#82 | 82,574(0.00%)#1,195 |
| 83. | Meadows Place | 3 | 8,227(0.04%)#83 | 82,574(0.00%)#1,230 |
| 84. | Avery | 2 | 8,227(0.02%)#84 | 82,574(0.00%)#1,277 |
| 85. | Fairchilds | 2 | 8,227(0.02%)#85 | 82,574(0.00%)#1,278 |
| 86. | Timbercreek Canyon | 1 | 8,227(0.01%)#86 | 82,574(0.00%)#1,293 |
Common Questions
What are the Top 10 Cities with the Most Immigrants from Malaysia in Texas?
Top 10 Cities with the Most Immigrants from Malaysia in Texas are:
#1
782
#2
655
#3
489
#4
325
#5
313
#6
287
#7
216
#8
208
#9
197
#10
194
What city has the Most Immigrants from Malaysia in Texas?
Houston has the Most Immigrants from Malaysia in Texas with 782.
What is the Total Immigrants from Malaysia in the State of Texas?
Total Immigrants from Malaysia in Texas is 8,227.
What is the Total Immigrants from Malaysia in the United States?
Total Immigrants from Malaysia in the United States is 82,574.