Zip Codes with the Highest Percentage of Population with a Degree in Visual and Performing Arts in Georgetown, TX
RELATED REPORTS & OPTIONS
Visual and Performing Arts
Georgetown
Compare Zip Codes
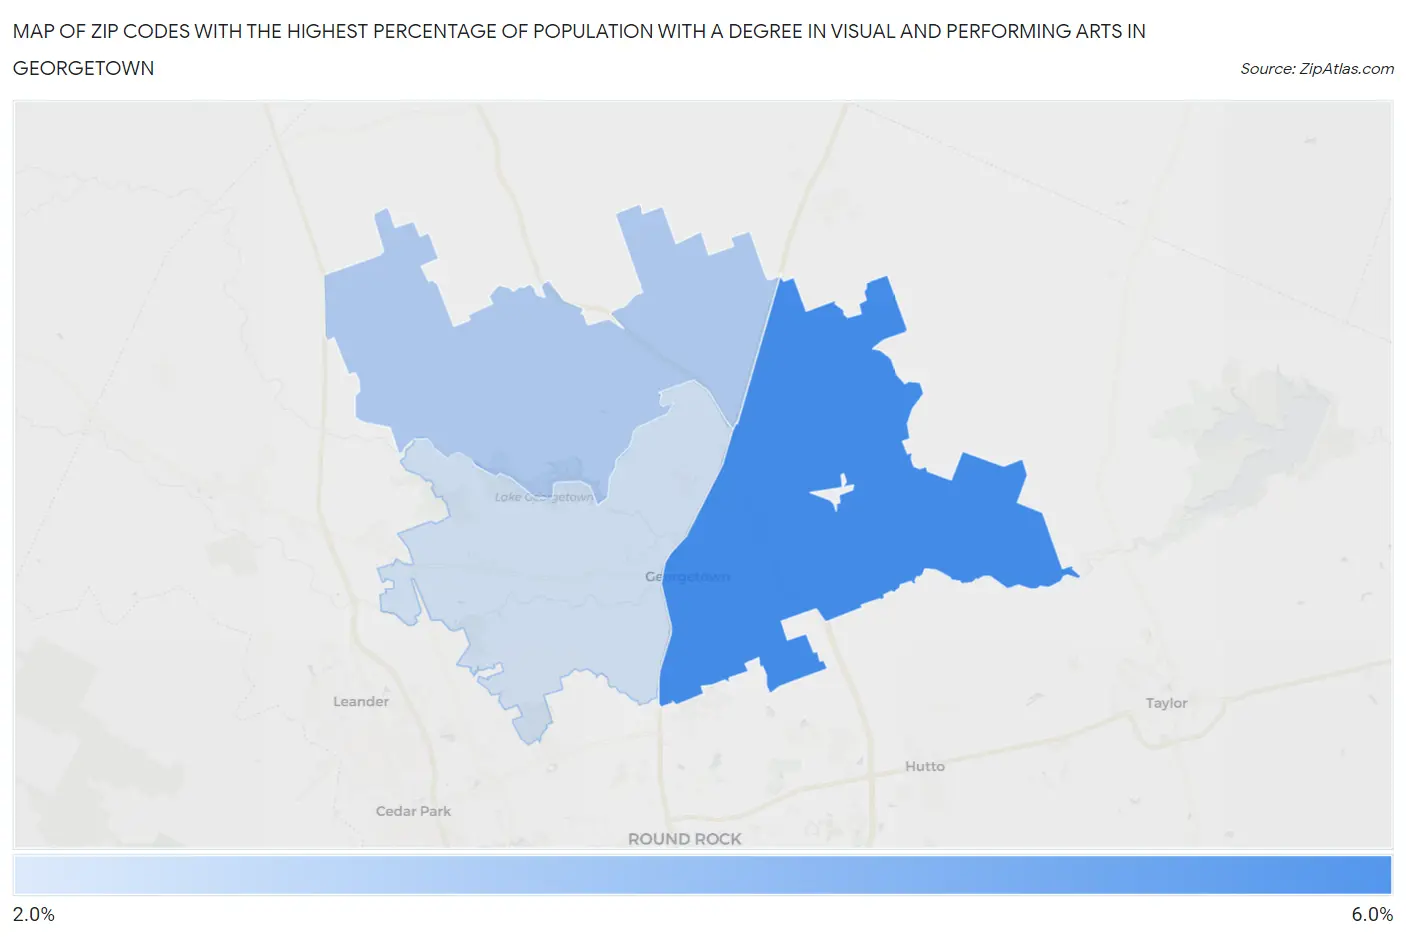
Map of Zip Codes with the Highest Percentage of Population with a Degree in Visual and Performing Arts in Georgetown
0.0%
6.0%
Zip Codes with the Highest Percentage of Population with a Degree in Visual and Performing Arts in Georgetown, TX
| Zip Code | % Graduates | vs State | vs National | |
| 1. | 78626 | 5.1% | 3.2%(+1.92)#270 | 4.3%(+0.874)#6,376 |
| 2. | 78633 | 3.1% | 3.2%(-0.121)#581 | 4.3%(-1.16)#12,374 |
| 3. | 78628 | 2.4% | 3.2%(-0.783)#737 | 4.3%(-1.83)#14,894 |
1
Common Questions
What are the Top Zip Codes with the Highest Percentage of Population with a Degree in Visual and Performing Arts in Georgetown, TX?
Top Zip Codes with the Highest Percentage of Population with a Degree in Visual and Performing Arts in Georgetown, TX are:
What zip code has the Highest Percentage of Population with a Degree in Visual and Performing Arts in Georgetown, TX?
78626 has the Highest Percentage of Population with a Degree in Visual and Performing Arts in Georgetown, TX with 5.1%.
What is the Percentage of Population with a Degree in Visual and Performing Arts in Georgetown, TX?
Percentage of Population with a Degree in Visual and Performing Arts in Georgetown is 4.0%.
What is the Percentage of Population with a Degree in Visual and Performing Arts in Texas?
Percentage of Population with a Degree in Visual and Performing Arts in Texas is 3.2%.
What is the Percentage of Population with a Degree in Visual and Performing Arts in the United States?
Percentage of Population with a Degree in Visual and Performing Arts in the United States is 4.3%.