Palmview South, TX
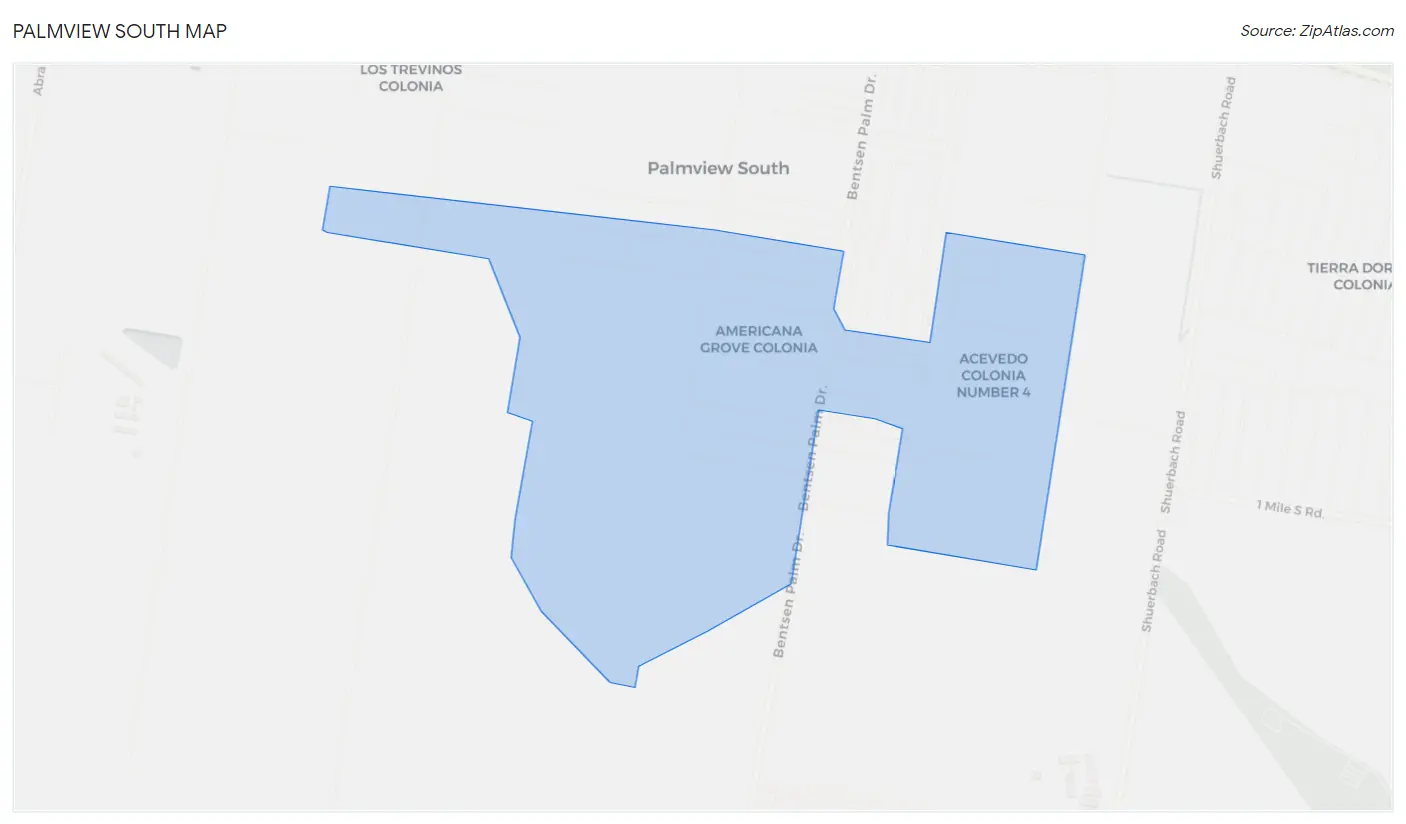
Palmview South Map
Palmview South Overview
2,141
TOTAL POPULATION
1,138
MALE POPULATION
1,003
FEMALE POPULATION
113.46
MALES / 100 FEMALES
88.14
FEMALES / 100 MALES
34.9
MEDIAN AGE
4.7
AVG FAMILY SIZE
3.9
AVG HOUSEHOLD SIZE
$17,662
PER CAPITA INCOME
$75,550
AVG FAMILY INCOME
0.53
INEQUALITY / GINI INDEX
717
LABOR FORCE [ PEOPLE ]
46.6%
PERCENT IN LABOR FORCE
17.9%
UNEMPLOYMENT RATE
Race in Palmview South
The most populous races in Palmview South are Hispanic or Latino (2,077 | 97.0%), White / Caucasian (1,137 | 53.1%), and Two or more Races (989 | 46.2%).
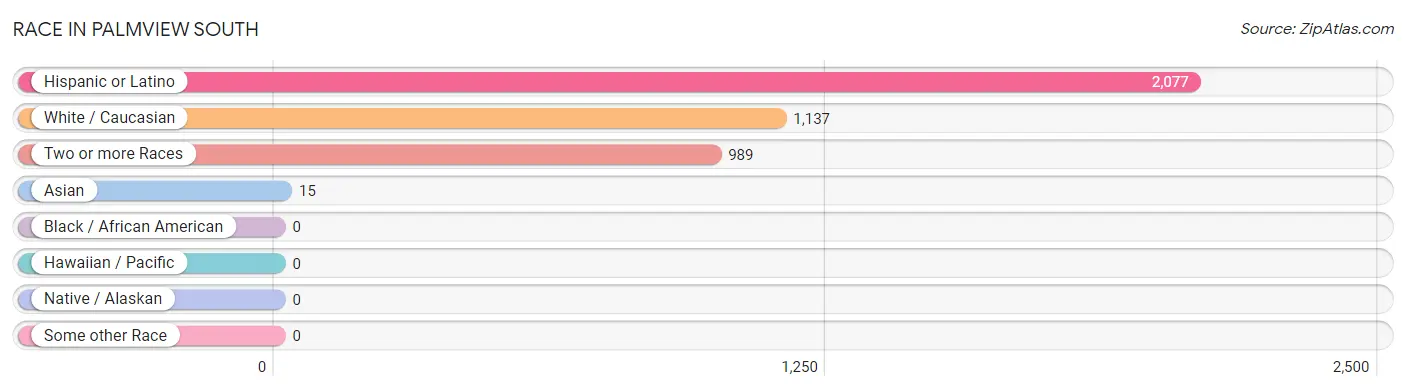
| Race | # Population | % Population |
| Asian | 15 | 0.7% |
| Black / African American | 0 | 0.0% |
| Hawaiian / Pacific | 0 | 0.0% |
| Hispanic or Latino | 2,077 | 97.0% |
| Native / Alaskan | 0 | 0.0% |
| White / Caucasian | 1,137 | 53.1% |
| Two or more Races | 989 | 46.2% |
| Some other Race | 0 | 0.0% |
| Total | 2,141 | 100.0% |
Ancestry in Palmview South
The most populous ancestries reported in Palmview South are Mexican (1,988 | 92.8%), American (57 | 2.7%), German (46 | 2.1%), Polish (32 | 1.5%), and Scottish (18 | 0.8%), together accounting for 100.0% of all Palmview South residents.
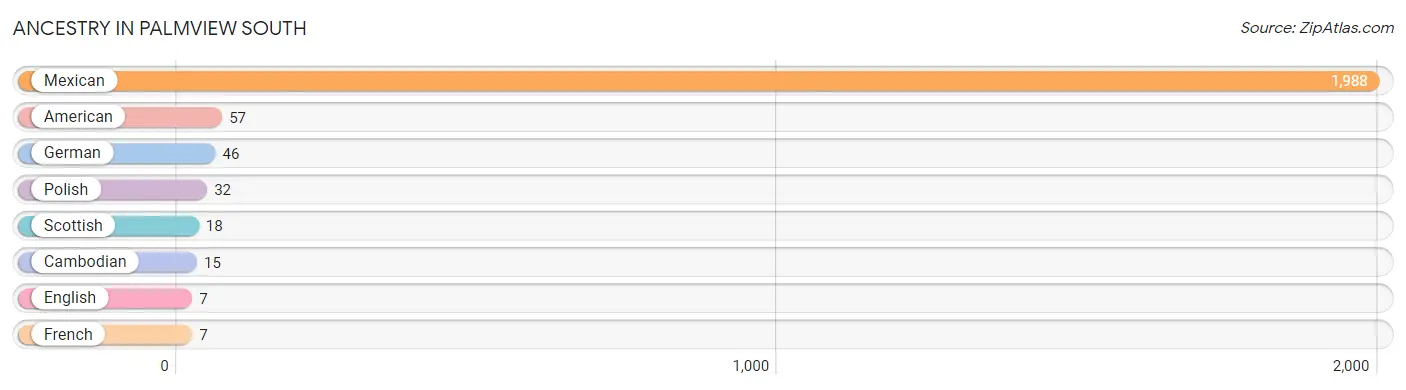
| Ancestry | # Population | % Population |
| American | 57 | 2.7% |
| Cambodian | 15 | 0.7% |
| English | 7 | 0.3% |
| French | 7 | 0.3% |
| German | 46 | 2.1% |
| Mexican | 1,988 | 92.8% |
| Polish | 32 | 1.5% |
| Scottish | 18 | 0.8% | View All 8 Rows |
Immigrants in Palmview South
The most numerous immigrant groups reported in Palmview South came from Central America (577 | 27.0%), Latin America (577 | 27.0%), and Mexico (577 | 27.0%), together accounting for 80.8% of all Palmview South residents.
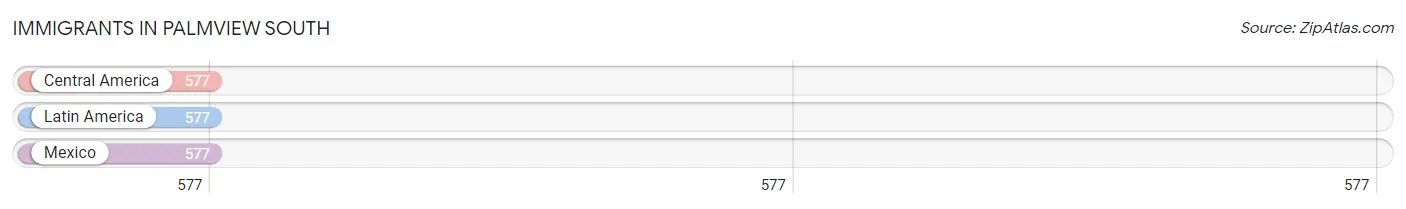
| Immigration Origin | # Population | % Population |
| Central America | 577 | 27.0% |
| Latin America | 577 | 27.0% |
| Mexico | 577 | 27.0% | View All 3 Rows |
Sex and Age in Palmview South
Sex and Age in Palmview South
The most populous age groups in Palmview South are 45 to 49 Years (159 | 14.0%) for men and 70 to 74 Years (141 | 14.1%) for women.
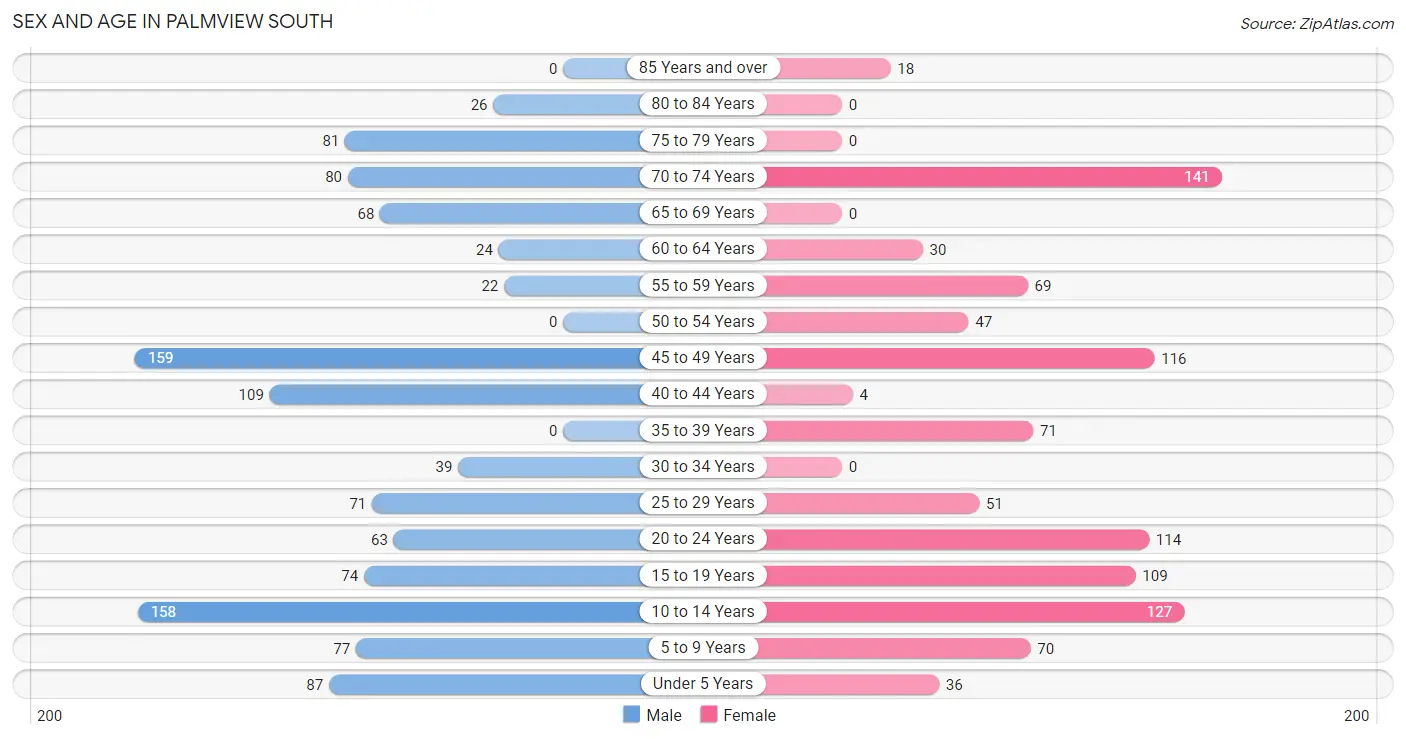
| Age Bracket | Male | Female |
| Under 5 Years | 87 (7.6%) | 36 (3.6%) |
| 5 to 9 Years | 77 (6.8%) | 70 (7.0%) |
| 10 to 14 Years | 158 (13.9%) | 127 (12.7%) |
| 15 to 19 Years | 74 (6.5%) | 109 (10.9%) |
| 20 to 24 Years | 63 (5.5%) | 114 (11.4%) |
| 25 to 29 Years | 71 (6.2%) | 51 (5.1%) |
| 30 to 34 Years | 39 (3.4%) | 0 (0.0%) |
| 35 to 39 Years | 0 (0.0%) | 71 (7.1%) |
| 40 to 44 Years | 109 (9.6%) | 4 (0.4%) |
| 45 to 49 Years | 159 (14.0%) | 116 (11.6%) |
| 50 to 54 Years | 0 (0.0%) | 47 (4.7%) |
| 55 to 59 Years | 22 (1.9%) | 69 (6.9%) |
| 60 to 64 Years | 24 (2.1%) | 30 (3.0%) |
| 65 to 69 Years | 68 (6.0%) | 0 (0.0%) |
| 70 to 74 Years | 80 (7.0%) | 141 (14.1%) |
| 75 to 79 Years | 81 (7.1%) | 0 (0.0%) |
| 80 to 84 Years | 26 (2.3%) | 0 (0.0%) |
| 85 Years and over | 0 (0.0%) | 18 (1.8%) |
| Total | 1,138 (100.0%) | 1,003 (100.0%) |
Families and Households in Palmview South
Median Family Size in Palmview South
The median family size in Palmview South is 4.74 persons per family, with married-couple families (304 | 71.7%) accounting for the largest median family size of 4.98 persons per family. On the other hand, single male/father families (26 | 6.1%) represent the smallest median family size with 2.88 persons per family.
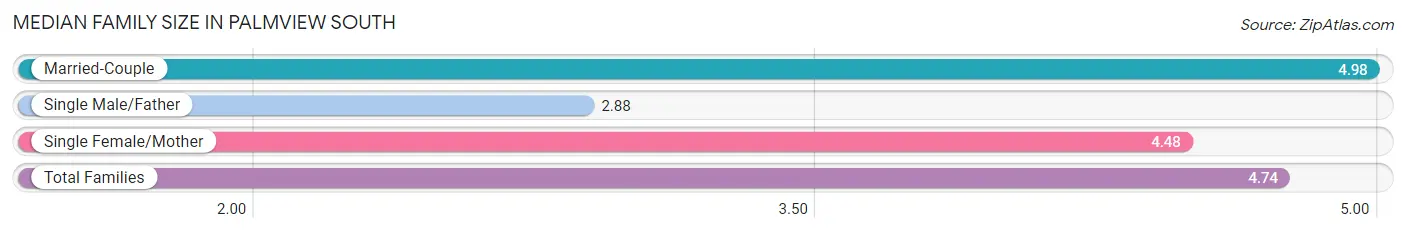
| Family Type | # Families | Family Size |
| Married-Couple | 304 (71.7%) | 4.98 |
| Single Male/Father | 26 (6.1%) | 2.88 |
| Single Female/Mother | 94 (22.2%) | 4.48 |
| Total Families | 424 (100.0%) | 4.74 |
Median Household Size in Palmview South
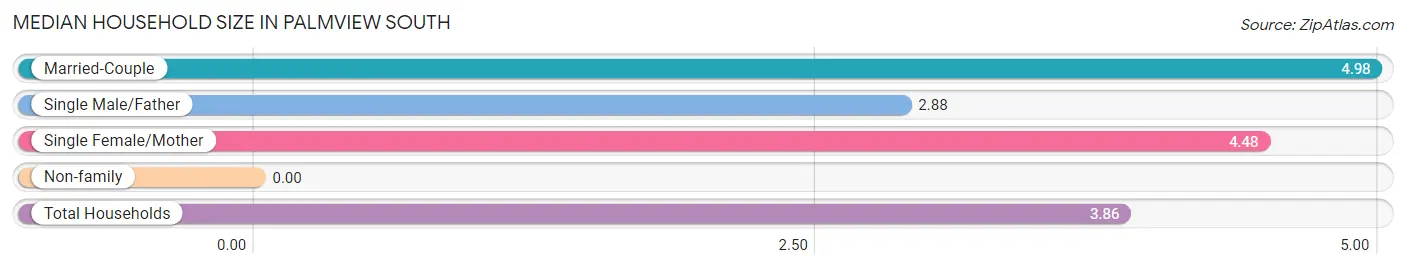
| Household Type | # Households | Household Size |
| Married-Couple | 304 (54.8%) | 4.98 |
| Single Male/Father | 26 (4.7%) | 2.88 |
| Single Female/Mother | 94 (16.9%) | 4.48 |
| Non-family | 131 (23.6%) | - |
| Total Households | 555 (100.0%) | 3.86 |
Household Size by Marriage Status in Palmview South
Out of a total of 555 households in Palmview South, 424 (76.4%) are family households, while 131 (23.6%) are nonfamily households. The most numerous type of family households are 4-person households, comprising 158, and the most common type of nonfamily households are 1-person households, comprising 131.
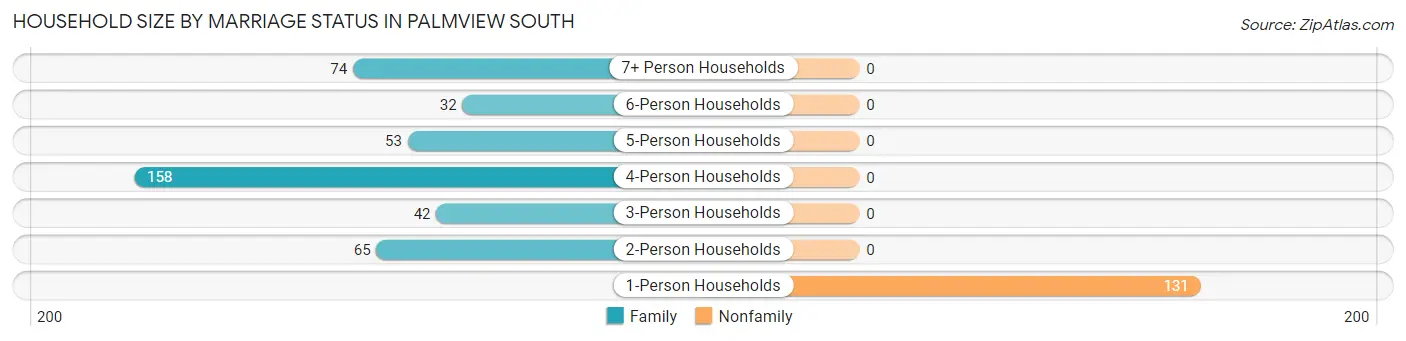
| Household Size | Family Households | Nonfamily Households |
| 1-Person Households | - | 131 (23.6%) |
| 2-Person Households | 65 (11.7%) | 0 (0.0%) |
| 3-Person Households | 42 (7.6%) | 0 (0.0%) |
| 4-Person Households | 158 (28.5%) | 0 (0.0%) |
| 5-Person Households | 53 (9.6%) | 0 (0.0%) |
| 6-Person Households | 32 (5.8%) | 0 (0.0%) |
| 7+ Person Households | 74 (13.3%) | 0 (0.0%) |
| Total | 424 (76.4%) | 131 (23.6%) |
Female Fertility in Palmview South
Fertility by Age in Palmview South
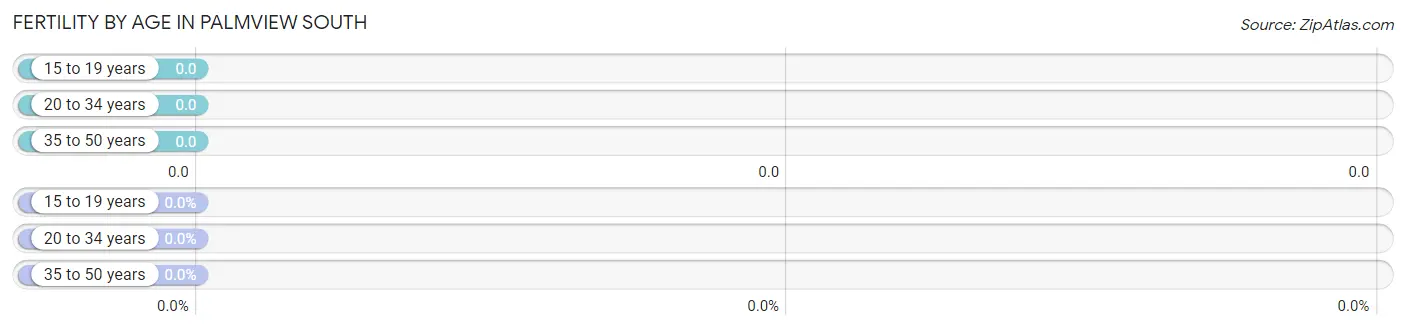
| Age Bracket | Women with Births | Births / 1,000 Women |
| 15 to 19 years | 0 (0.0%) | 0.0 |
| 20 to 34 years | 0 (0.0%) | 0.0 |
| 35 to 50 years | 0 (0.0%) | 0.0 |
| Total | 0 (0.0%) | 0.0 |
Fertility by Age by Marriage Status in Palmview South
| Age Bracket | Married | Unmarried |
| 15 to 19 years | 0 (0.0%) | 0 (0.0%) |
| 20 to 34 years | 0 (0.0%) | 0 (0.0%) |
| 35 to 50 years | 0 (0.0%) | 0 (0.0%) |
| Total | 0 (0.0%) | 0 (0.0%) |
Fertility by Education in Palmview South
| Educational Attainment | Women with Births | Births / 1,000 Women |
| Less than High School | 0 (0.0%) | 0.0 |
| High School Diploma | 0 (0.0%) | 0.0 |
| College or Associate's Degree | 0 (0.0%) | 0.0 |
| Bachelor's Degree | 0 (0.0%) | 0.0 |
| Graduate Degree | 0 (0.0%) | 0.0 |
| Total | 0 (0.0%) | 0.0 |
Fertility by Education by Marriage Status in Palmview South
| Educational Attainment | Married | Unmarried |
| Less than High School | 0 (0.0%) | 0 (0.0%) |
| High School Diploma | 0 (0.0%) | 0 (0.0%) |
| College or Associate's Degree | 0 (0.0%) | 0 (0.0%) |
| Bachelor's Degree | 0 (0.0%) | 0 (0.0%) |
| Graduate Degree | 0 (0.0%) | 0 (0.0%) |
| Total | 0 (0.0%) | 0 (0.0%) |
Income in Palmview South
Income Overview in Palmview South
| Characteristic | Number | Measure |
| Per Capita Income | 2,141 | $17,662 |
| Median Family Income | 424 | $75,550 |
| Mean Family Income | 424 | $79,928 |
| Median Household Income | 555 | $0 |
| Mean Household Income | 555 | $66,313 |
| Income Deficit | 424 | $0 |
| Wage / Income Gap (%) | 2,141 | 0.00% |
| Wage / Income Gap ($) | 2,141 | 100.00¢ per $1 |
| Gini / Inequality Index | 2,141 | 0.53 |
Earnings by Sex in Palmview South
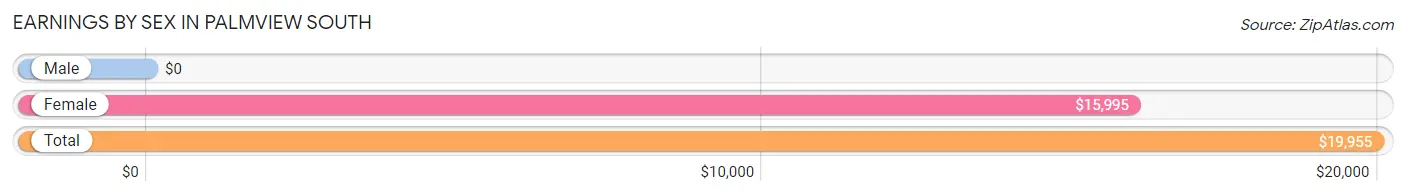
| Sex | Number | Average Earnings |
| Male | 368 (53.9%) | $0 |
| Female | 315 (46.1%) | $15,995 |
| Total | 683 (100.0%) | $19,955 |
Earnings by Sex by Income Bracket in Palmview South
The most common earnings brackets in Palmview South are $15,000 to $17,499 for men (63 | 17.1%) and $2,500 to $4,999 for women (61 | 19.4%).
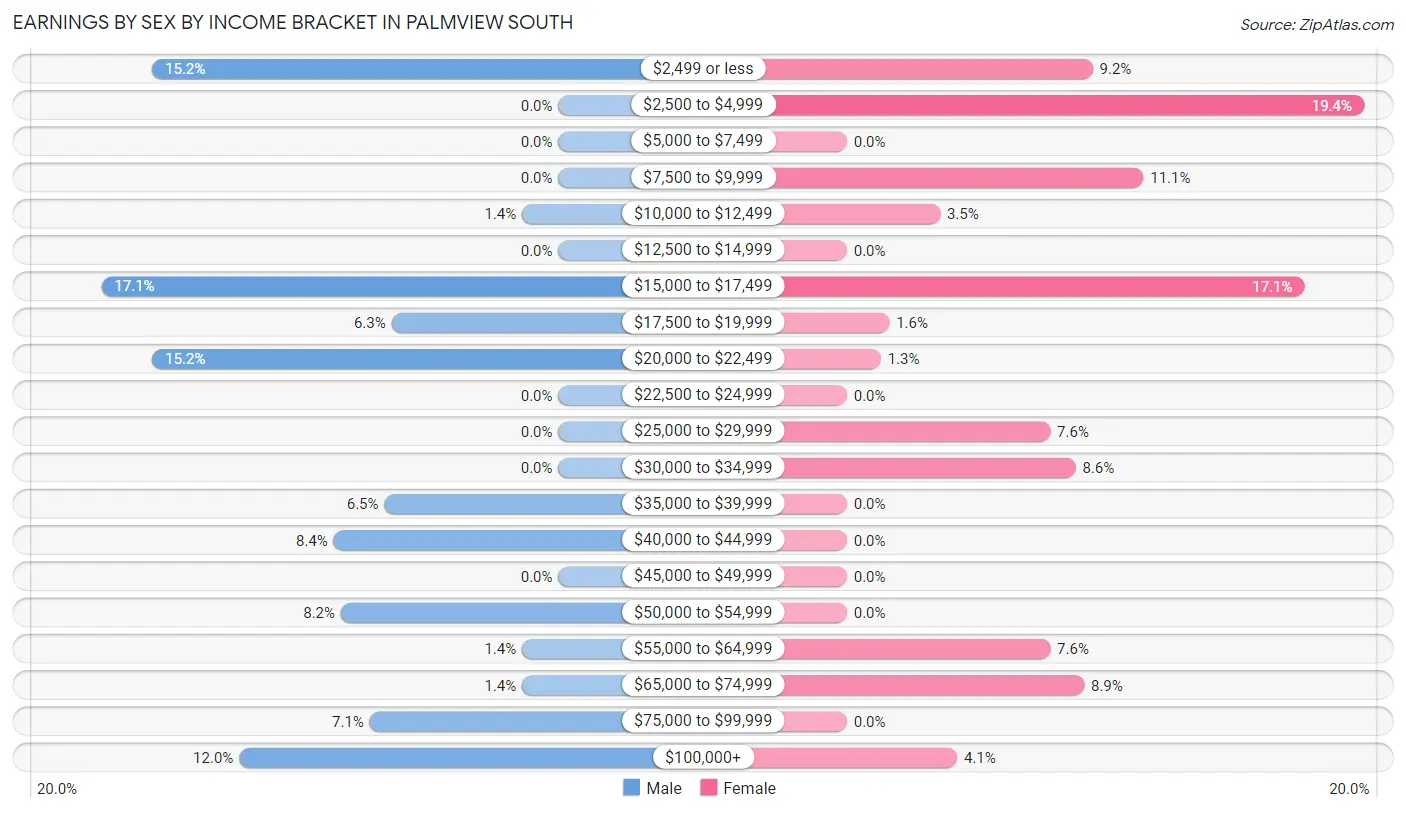
| Income | Male | Female |
| $2,499 or less | 56 (15.2%) | 29 (9.2%) |
| $2,500 to $4,999 | 0 (0.0%) | 61 (19.4%) |
| $5,000 to $7,499 | 0 (0.0%) | 0 (0.0%) |
| $7,500 to $9,999 | 0 (0.0%) | 35 (11.1%) |
| $10,000 to $12,499 | 5 (1.4%) | 11 (3.5%) |
| $12,500 to $14,999 | 0 (0.0%) | 0 (0.0%) |
| $15,000 to $17,499 | 63 (17.1%) | 54 (17.1%) |
| $17,500 to $19,999 | 23 (6.2%) | 5 (1.6%) |
| $20,000 to $22,499 | 56 (15.2%) | 4 (1.3%) |
| $22,500 to $24,999 | 0 (0.0%) | 0 (0.0%) |
| $25,000 to $29,999 | 0 (0.0%) | 24 (7.6%) |
| $30,000 to $34,999 | 0 (0.0%) | 27 (8.6%) |
| $35,000 to $39,999 | 24 (6.5%) | 0 (0.0%) |
| $40,000 to $44,999 | 31 (8.4%) | 0 (0.0%) |
| $45,000 to $49,999 | 0 (0.0%) | 0 (0.0%) |
| $50,000 to $54,999 | 30 (8.2%) | 0 (0.0%) |
| $55,000 to $64,999 | 5 (1.4%) | 24 (7.6%) |
| $65,000 to $74,999 | 5 (1.4%) | 28 (8.9%) |
| $75,000 to $99,999 | 26 (7.1%) | 0 (0.0%) |
| $100,000+ | 44 (12.0%) | 13 (4.1%) |
| Total | 368 (100.0%) | 315 (100.0%) |
Earnings by Sex by Educational Attainment in Palmview South
Average earnings in Palmview South are $38,438 for men and $28,125 for women, a difference of 26.8%. Men with an educational attainment of bachelor's degree enjoy the highest average annual earnings of $42,863, while those with bachelor's degree education earn the least with $42,863. Women with an educational attainment of less than high school earn the most with the average annual earnings of $15,579, while those with less than high school education have the smallest earnings of $15,579.
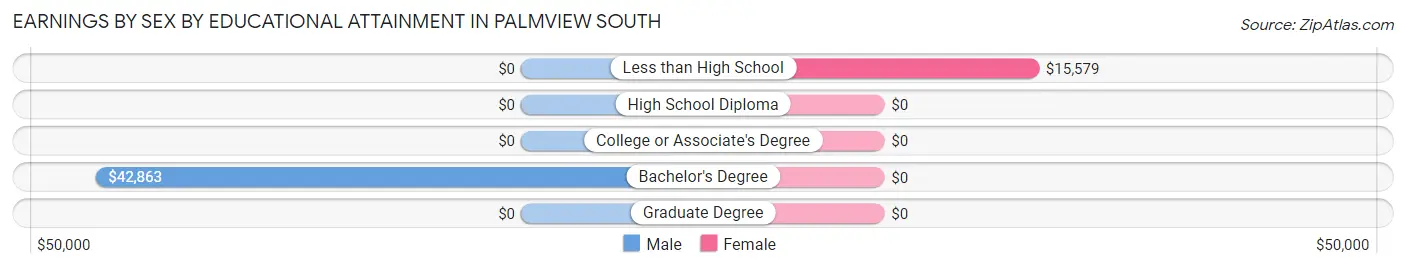
| Educational Attainment | Male Income | Female Income |
| Less than High School | - | - |
| High School Diploma | - | - |
| College or Associate's Degree | - | - |
| Bachelor's Degree | $42,863 | $0 |
| Graduate Degree | - | - |
| Total | $38,438 | $28,125 |
Family Income in Palmview South
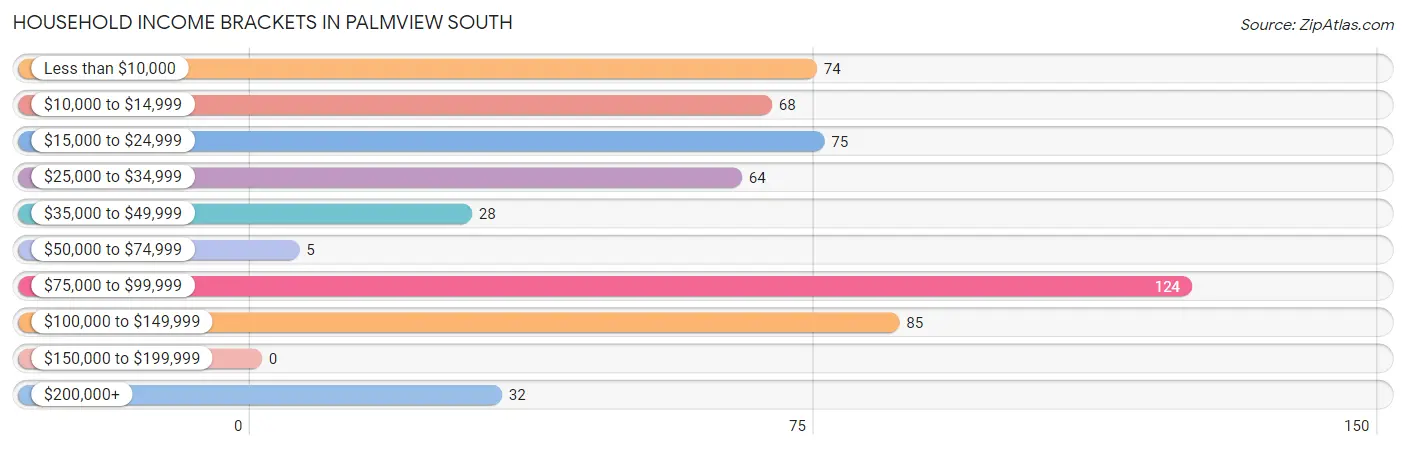
Family Income Brackets in Palmview South
According to the Palmview South family income data, there are 106 families falling into the $75,000 to $99,999 income range, which is the most common income bracket and makes up 25.0% of all families.
| Income Bracket | # Families | % Families |
| Less than $10,000 | 49 | 11.6% |
| $10,000 to $14,999 | 11 | 2.6% |
| $15,000 to $24,999 | 44 | 10.4% |
| $25,000 to $34,999 | 64 | 15.1% |
| $35,000 to $49,999 | 28 | 6.6% |
| $50,000 to $74,999 | 5 | 1.2% |
| $75,000 to $99,999 | 106 | 25.0% |
| $100,000 to $149,999 | 85 | 20.0% |
| $150,000 to $199,999 | 0 | 0.0% |
| $200,000+ | 32 | 7.5% |
Family Income by Famaliy Size in Palmview South
3-person families (42 | 9.9%) account for the highest median family income in Palmview South with $7,019 per family, while 3-person families (42 | 9.9%) have the highest median income of $2,340 per family member.
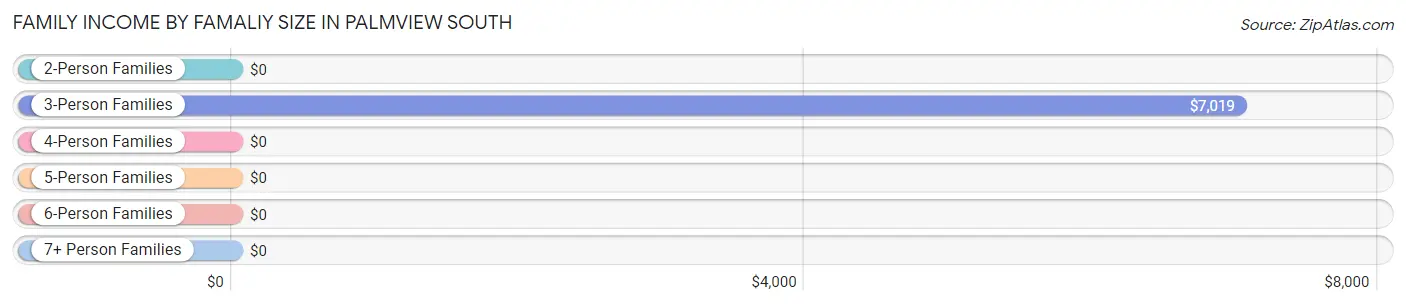
| Income Bracket | # Families | Median Income |
| 2-Person Families | 65 (15.3%) | $0 |
| 3-Person Families | 42 (9.9%) | $7,019 |
| 4-Person Families | 158 (37.3%) | $0 |
| 5-Person Families | 53 (12.5%) | $0 |
| 6-Person Families | 32 (7.5%) | $0 |
| 7+ Person Families | 74 (17.4%) | $0 |
| Total | 424 (100.0%) | $75,550 |
Family Income by Number of Earners in Palmview South
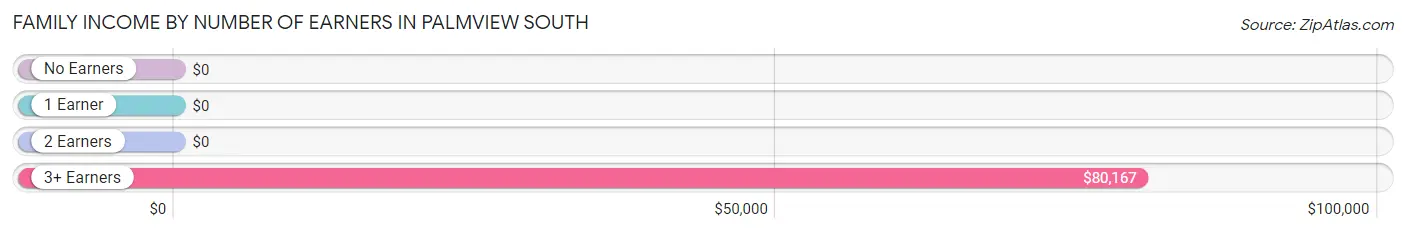
| Number of Earners | # Families | Median Income |
| No Earners | 58 (13.7%) | $0 |
| 1 Earner | 176 (41.5%) | $0 |
| 2 Earners | 124 (29.2%) | $0 |
| 3+ Earners | 66 (15.6%) | $80,167 |
| Total | 424 (100.0%) | $75,550 |
Household Income in Palmview South
Household Income Brackets in Palmview South
With 124 households falling in the category, the $75,000 to $99,999 income range is the most frequent in Palmview South, accounting for 22.3% of all households.
| Income Bracket | # Households | % Households |
| Less than $10,000 | 74 | 13.3% |
| $10,000 to $14,999 | 68 | 12.3% |
| $15,000 to $24,999 | 75 | 13.5% |
| $25,000 to $34,999 | 64 | 11.5% |
| $35,000 to $49,999 | 28 | 5.0% |
| $50,000 to $74,999 | 5 | 0.9% |
| $75,000 to $99,999 | 124 | 22.3% |
| $100,000 to $149,999 | 85 | 15.3% |
| $150,000 to $199,999 | 0 | 0.0% |
| $200,000+ | 32 | 5.8% |
Household Income by Householder Age in Palmview South
| Income Bracket | # Households | Median Income |
| 15 to 24 Years | 0 (0.0%) | $0 |
| 25 to 44 Years | 124 (22.3%) | $0 |
| 45 to 64 Years | 260 (46.9%) | $0 |
| 65+ Years | 171 (30.8%) | $0 |
| Total | 555 (100.0%) | $0 |
Poverty in Palmview South
Income Below Poverty by Sex and Age in Palmview South
With 44.0% poverty level for males and 44.8% for females among the residents of Palmview South, under 5 year old males and 55 to 64 year old females are the most vulnerable to poverty, with 87 males (100.0%) and 90 females (90.9%) in their respective age groups living below the poverty level.
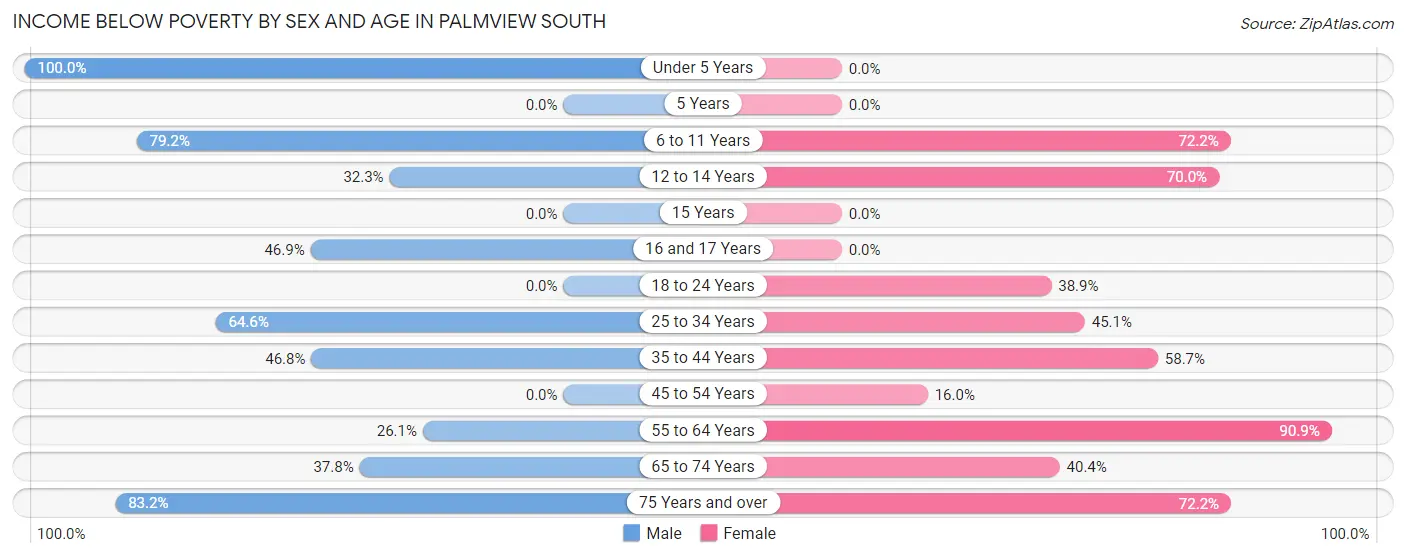
| Age Bracket | Male | Female |
| Under 5 Years | 87 (100.0%) | 0 (0.0%) |
| 5 Years | 0 (0.0%) | 0 (0.0%) |
| 6 to 11 Years | 61 (79.2%) | 70 (72.2%) |
| 12 to 14 Years | 51 (32.3%) | 70 (70.0%) |
| 15 Years | 0 (0.0%) | 0 (0.0%) |
| 16 and 17 Years | 23 (46.9%) | 0 (0.0%) |
| 18 to 24 Years | 0 (0.0%) | 56 (38.9%) |
| 25 to 34 Years | 71 (64.5%) | 23 (45.1%) |
| 35 to 44 Years | 51 (46.8%) | 44 (58.7%) |
| 45 to 54 Years | 0 (0.0%) | 26 (16.0%) |
| 55 to 64 Years | 12 (26.1%) | 90 (90.9%) |
| 65 to 74 Years | 56 (37.8%) | 57 (40.4%) |
| 75 Years and over | 89 (83.2%) | 13 (72.2%) |
| Total | 501 (44.0%) | 449 (44.8%) |
Income Above Poverty by Sex and Age in Palmview South
According to the poverty statistics in Palmview South, males aged 15 years and females aged under 5 years are the age groups that are most secure financially, with 100.0% of males and 100.0% of females in these age groups living above the poverty line.
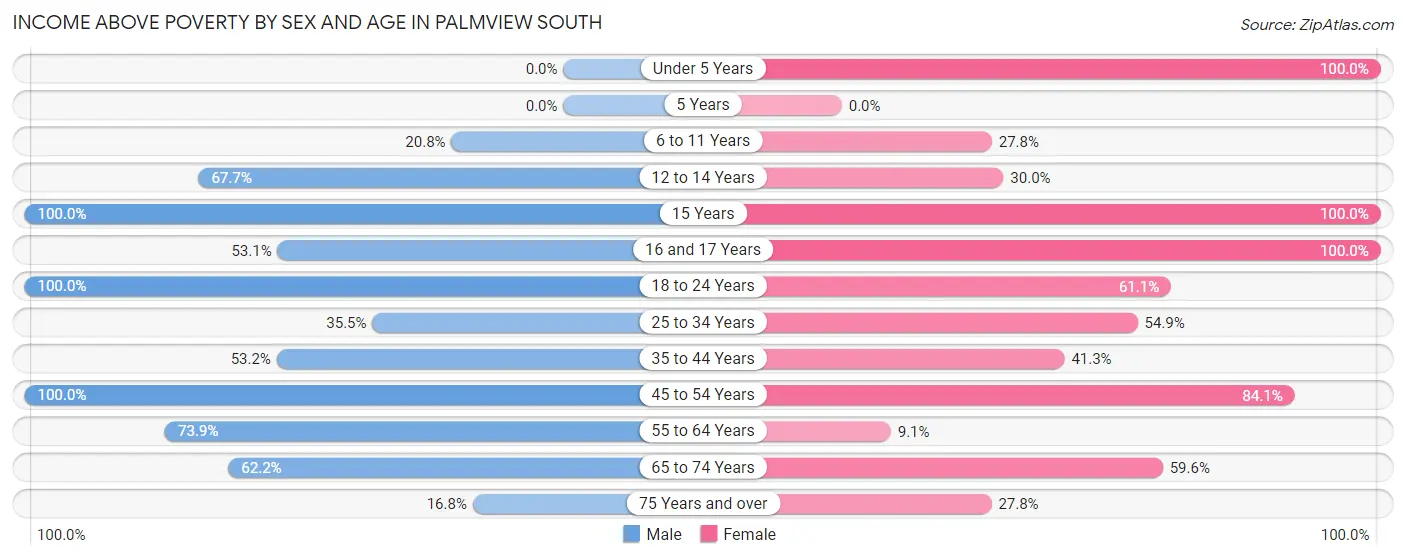
| Age Bracket | Male | Female |
| Under 5 Years | 0 (0.0%) | 36 (100.0%) |
| 5 Years | 0 (0.0%) | 0 (0.0%) |
| 6 to 11 Years | 16 (20.8%) | 27 (27.8%) |
| 12 to 14 Years | 107 (67.7%) | 30 (30.0%) |
| 15 Years | 25 (100.0%) | 23 (100.0%) |
| 16 and 17 Years | 26 (53.1%) | 56 (100.0%) |
| 18 to 24 Years | 63 (100.0%) | 88 (61.1%) |
| 25 to 34 Years | 39 (35.4%) | 28 (54.9%) |
| 35 to 44 Years | 58 (53.2%) | 31 (41.3%) |
| 45 to 54 Years | 159 (100.0%) | 137 (84.1%) |
| 55 to 64 Years | 34 (73.9%) | 9 (9.1%) |
| 65 to 74 Years | 92 (62.2%) | 84 (59.6%) |
| 75 Years and over | 18 (16.8%) | 5 (27.8%) |
| Total | 637 (56.0%) | 554 (55.2%) |
Income Below Poverty Among Married-Couple Families in Palmview South
The poverty statistics for married-couple families in Palmview South show that 18.1% or 55 of the total 304 families live below the poverty line. Families with 3 or 4 children have the highest poverty rate of 44.9%, comprising of 44 families. On the other hand, families with 1 or 2 children have the lowest poverty rate of 0.0%, which includes 0 families.
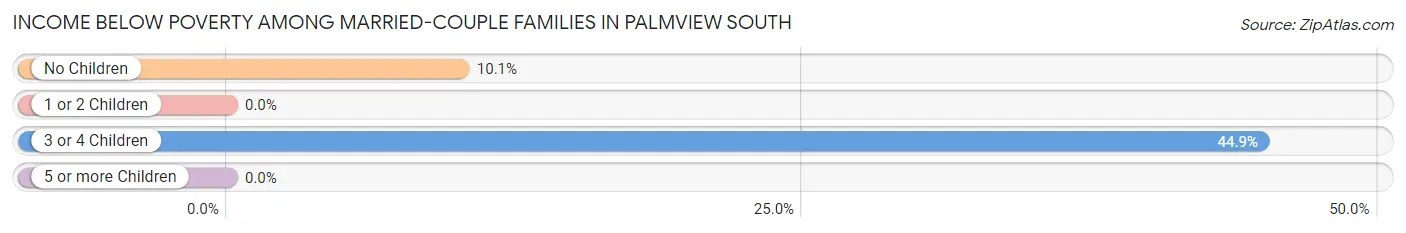
| Children | Above Poverty | Below Poverty |
| No Children | 98 (89.9%) | 11 (10.1%) |
| 1 or 2 Children | 97 (100.0%) | 0 (0.0%) |
| 3 or 4 Children | 54 (55.1%) | 44 (44.9%) |
| 5 or more Children | 0 (0.0%) | 0 (0.0%) |
| Total | 249 (81.9%) | 55 (18.1%) |
Income Below Poverty Among Single-Parent Households in Palmview South
According to the poverty data in Palmview South, 100.0% or 26 single-father households and 81.9% or 77 single-mother households are living below the poverty line. Among single-father households, those with 1 or 2 children have the highest poverty rate, with 26 households (100.0%) experiencing poverty. Likewise, among single-mother households, those with 3 or 4 children have the highest poverty rate, with 23 households (100.0%) falling below the poverty line.
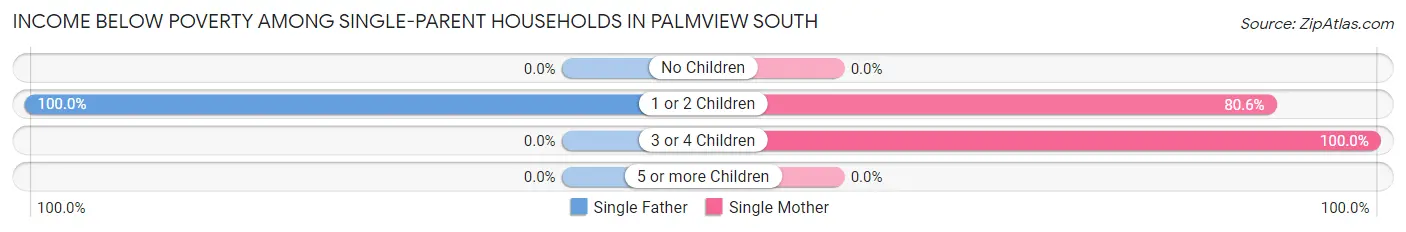
| Children | Single Father | Single Mother |
| No Children | 0 (0.0%) | 0 (0.0%) |
| 1 or 2 Children | 26 (100.0%) | 54 (80.6%) |
| 3 or 4 Children | 0 (0.0%) | 23 (100.0%) |
| 5 or more Children | 0 (0.0%) | 0 (0.0%) |
| Total | 26 (100.0%) | 77 (81.9%) |
Income Below Poverty Among Married-Couple vs Single-Parent Households in Palmview South
The poverty data for Palmview South shows that 55 of the married-couple family households (18.1%) and 103 of the single-parent households (85.8%) are living below the poverty level. Within the married-couple family households, those with 3 or 4 children have the highest poverty rate, with 44 households (44.9%) falling below the poverty line. Among the single-parent households, those with 3 or 4 children have the highest poverty rate, with 23 household (100.0%) living below poverty.
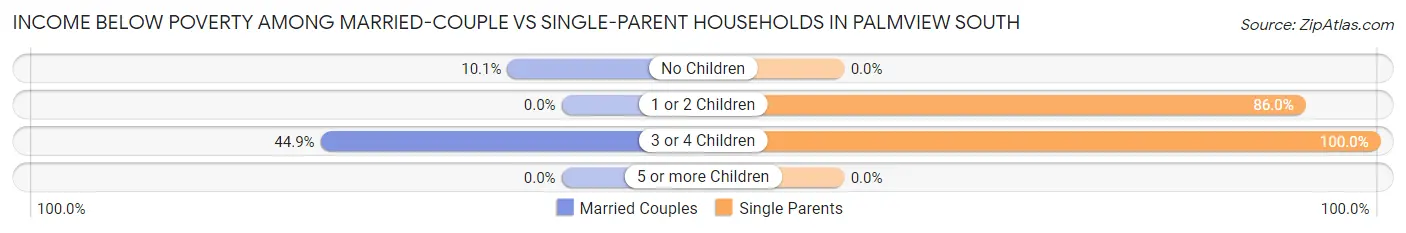
| Children | Married-Couple Families | Single-Parent Households |
| No Children | 11 (10.1%) | 0 (0.0%) |
| 1 or 2 Children | 0 (0.0%) | 80 (86.0%) |
| 3 or 4 Children | 44 (44.9%) | 23 (100.0%) |
| 5 or more Children | 0 (0.0%) | 0 (0.0%) |
| Total | 55 (18.1%) | 103 (85.8%) |
Employment Characteristics in Palmview South
Employment by Class of Employer in Palmview South
Among the 538 employed individuals in Palmview South, private company employees (455 | 84.6%), self-employed (not incorporated) (46 | 8.6%), and state government employees (33 | 6.1%) make up the most common classes of employment.
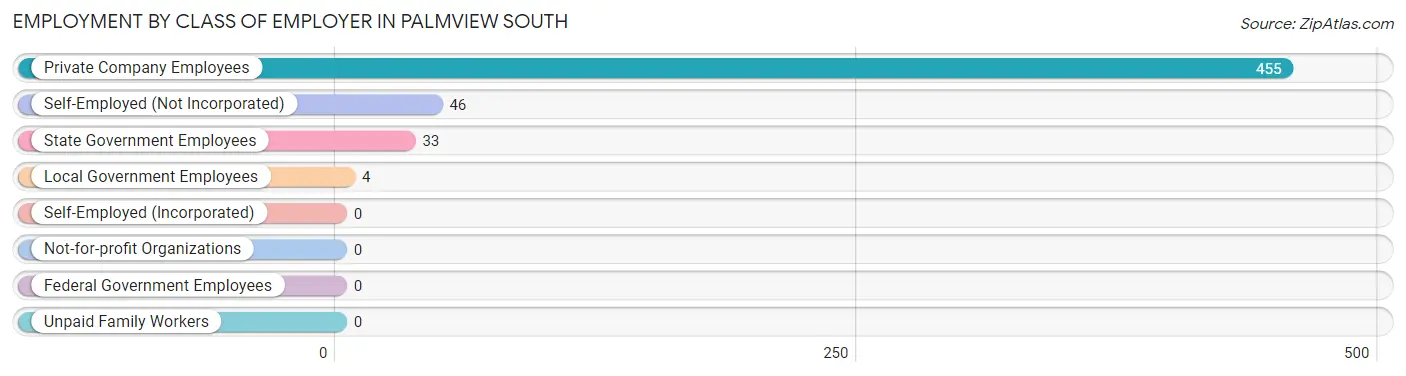
| Employer Class | # Employees | % Employees |
| Private Company Employees | 455 | 84.6% |
| Self-Employed (Incorporated) | 0 | 0.0% |
| Self-Employed (Not Incorporated) | 46 | 8.6% |
| Not-for-profit Organizations | 0 | 0.0% |
| Local Government Employees | 4 | 0.7% |
| State Government Employees | 33 | 6.1% |
| Federal Government Employees | 0 | 0.0% |
| Unpaid Family Workers | 0 | 0.0% |
| Total | 538 | 100.0% |
Employment Status by Age in Palmview South
According to the labor force statistics for Palmview South, out of the total population over 16 years of age (1,538), 46.6% or 717 individuals are in the labor force, with 17.9% or 128 of them unemployed. The age group with the highest labor force participation rate is 25 to 29 years, with 100.0% or 122 individuals in the labor force. Within the labor force, the 25 to 29 years age range has the highest percentage of unemployed individuals, with 58.2% or 71 of them being unemployed.
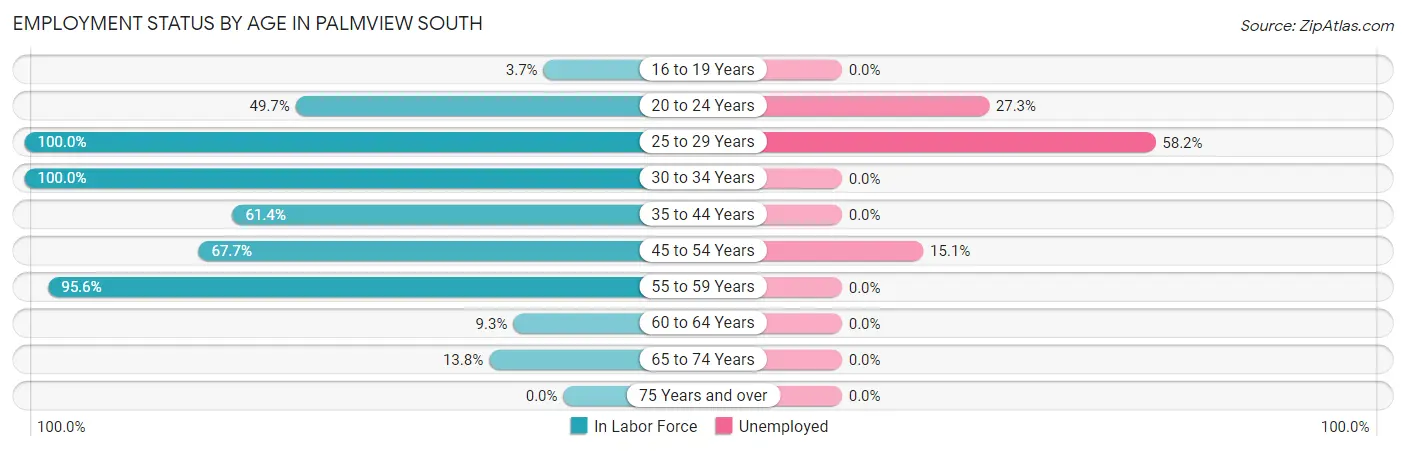
| Age Bracket | In Labor Force | Unemployed |
| 16 to 19 Years | 5 (3.7%) | 0 (0.0%) |
| 20 to 24 Years | 88 (49.7%) | 24 (27.3%) |
| 25 to 29 Years | 122 (100.0%) | 71 (58.2%) |
| 30 to 34 Years | 39 (100.0%) | 0 (0.0%) |
| 35 to 44 Years | 113 (61.4%) | 0 (0.0%) |
| 45 to 54 Years | 218 (67.7%) | 33 (15.1%) |
| 55 to 59 Years | 87 (95.6%) | 0 (0.0%) |
| 60 to 64 Years | 5 (9.3%) | 0 (0.0%) |
| 65 to 74 Years | 40 (13.8%) | 0 (0.0%) |
| 75 Years and over | 0 (0.0%) | 0 (0.0%) |
| Total | 717 (46.6%) | 128 (17.9%) |
Employment Status by Educational Attainment in Palmview South
According to labor force statistics for Palmview South, 71.9% of individuals (584) out of the total population between 25 and 64 years of age (812) are in the labor force, with 17.8% or 104 of them being unemployed. The group with the highest labor force participation rate are those with the educational attainment of bachelor's degree or higher, with 100.0% or 118 individuals in the labor force. Within the labor force, individuals with less than high school education have the highest percentage of unemployment, with 42.0% or 71 of them being unemployed.
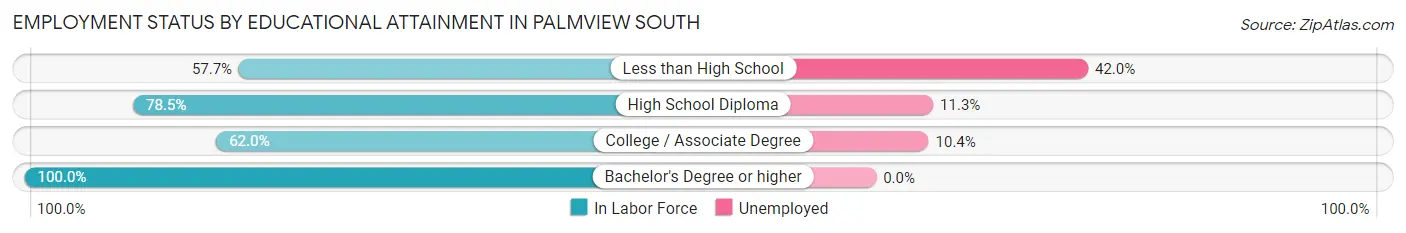
| Educational Attainment | In Labor Force | Unemployed |
| Less than High School | 169 (57.7%) | 123 (42.0%) |
| High School Diploma | 230 (78.5%) | 33 (11.3%) |
| College / Associate Degree | 67 (62.0%) | 11 (10.4%) |
| Bachelor's Degree or higher | 118 (100.0%) | 0 (0.0%) |
| Total | 584 (71.9%) | 145 (17.8%) |
Employment Occupations by Sex in Palmview South
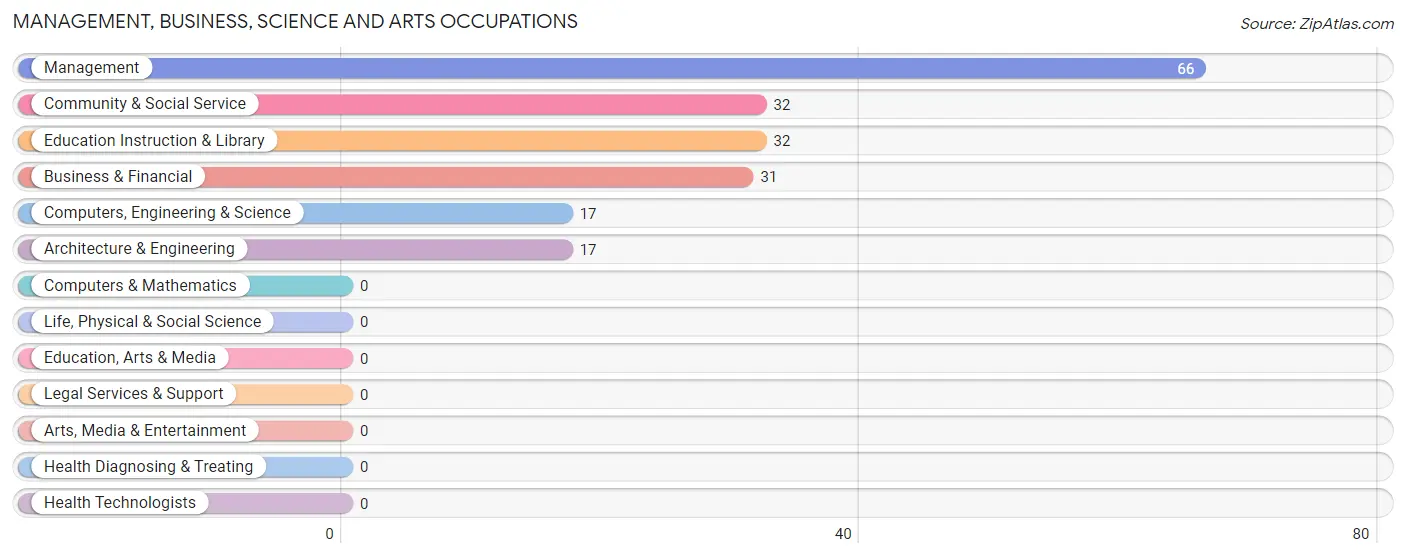
Management, Business, Science and Arts Occupations
The most common Management, Business, Science and Arts occupations in Palmview South are Management (66 | 11.2%), Community & Social Service (32 | 5.4%), Education Instruction & Library (32 | 5.4%), Business & Financial (31 | 5.3%), and Computers, Engineering & Science (17 | 2.9%).
Management, Business, Science and Arts Occupations by Sex
Within the Management, Business, Science and Arts occupations in Palmview South, the most male-oriented occupations are Business & Financial (100.0%), Computers, Engineering & Science (100.0%), and Architecture & Engineering (100.0%), while the most female-oriented occupations are Community & Social Service (100.0%), Education Instruction & Library (100.0%), and Management (40.9%).
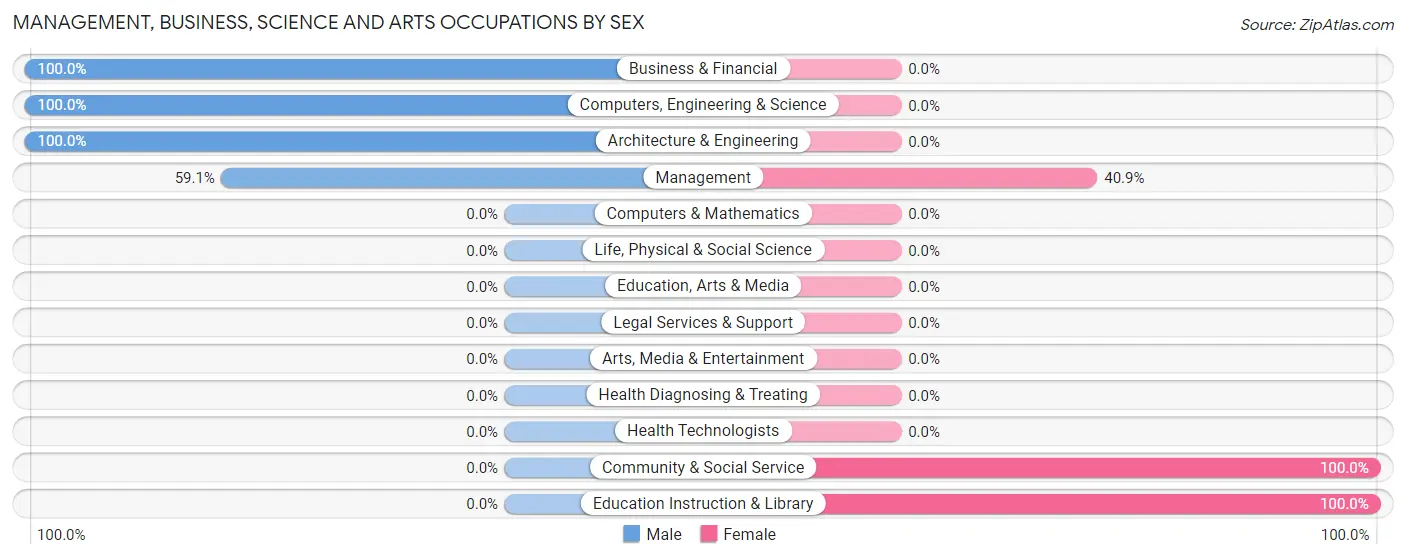
| Occupation | Male | Female |
| Management | 39 (59.1%) | 27 (40.9%) |
| Business & Financial | 31 (100.0%) | 0 (0.0%) |
| Computers, Engineering & Science | 17 (100.0%) | 0 (0.0%) |
| Computers & Mathematics | 0 (0.0%) | 0 (0.0%) |
| Architecture & Engineering | 17 (100.0%) | 0 (0.0%) |
| Life, Physical & Social Science | 0 (0.0%) | 0 (0.0%) |
| Community & Social Service | 0 (0.0%) | 32 (100.0%) |
| Education, Arts & Media | 0 (0.0%) | 0 (0.0%) |
| Legal Services & Support | 0 (0.0%) | 0 (0.0%) |
| Education Instruction & Library | 0 (0.0%) | 32 (100.0%) |
| Arts, Media & Entertainment | 0 (0.0%) | 0 (0.0%) |
| Health Diagnosing & Treating | 0 (0.0%) | 0 (0.0%) |
| Health Technologists | 0 (0.0%) | 0 (0.0%) |
| Total (Category) | 87 (59.6%) | 59 (40.4%) |
| Total (Overall) | 337 (57.2%) | 252 (42.8%) |
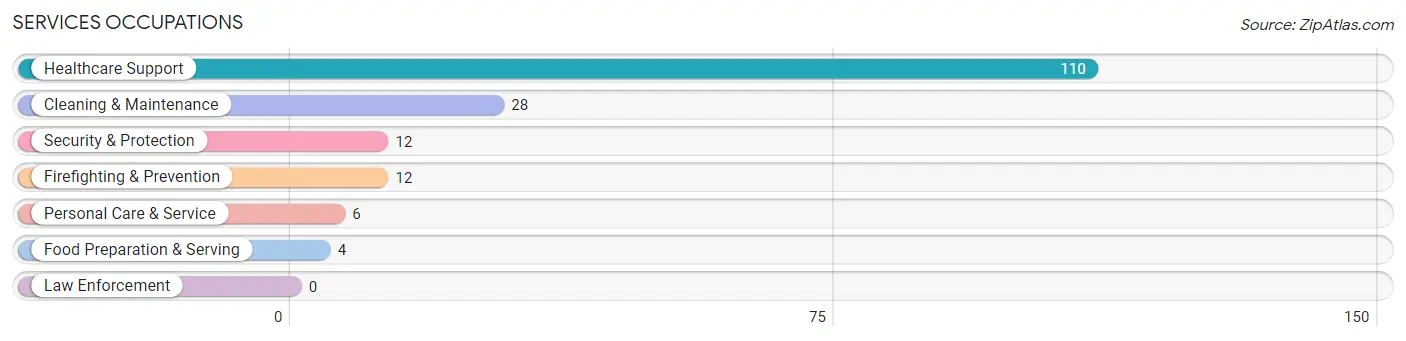
Services Occupations
The most common Services occupations in Palmview South are Healthcare Support (110 | 18.7%), Cleaning & Maintenance (28 | 4.8%), Security & Protection (12 | 2.0%), Firefighting & Prevention (12 | 2.0%), and Personal Care & Service (6 | 1.0%).
Services Occupations by Sex
Within the Services occupations in Palmview South, the most male-oriented occupations are Security & Protection (100.0%), Firefighting & Prevention (100.0%), and Healthcare Support (15.4%), while the most female-oriented occupations are Food Preparation & Serving (100.0%), Cleaning & Maintenance (100.0%), and Personal Care & Service (100.0%).
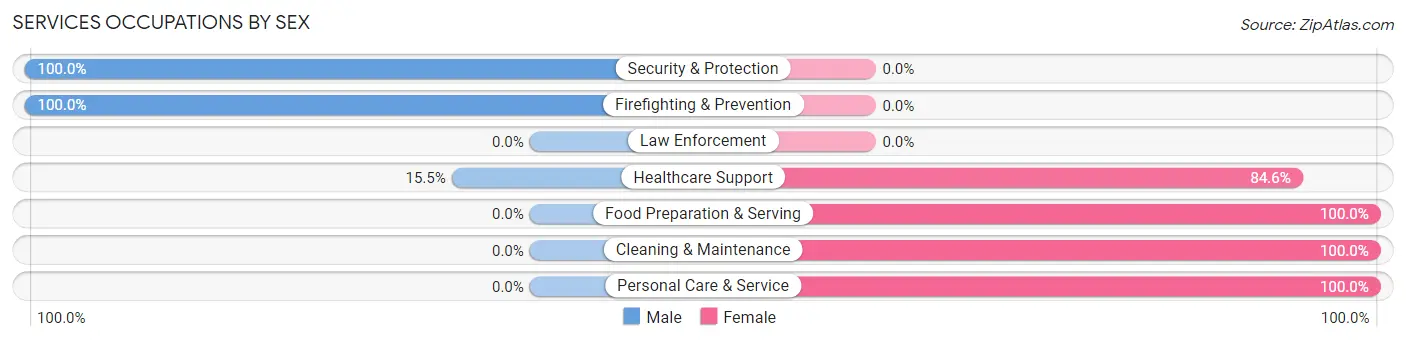
| Occupation | Male | Female |
| Healthcare Support | 17 (15.4%) | 93 (84.6%) |
| Security & Protection | 12 (100.0%) | 0 (0.0%) |
| Firefighting & Prevention | 12 (100.0%) | 0 (0.0%) |
| Law Enforcement | 0 (0.0%) | 0 (0.0%) |
| Food Preparation & Serving | 0 (0.0%) | 4 (100.0%) |
| Cleaning & Maintenance | 0 (0.0%) | 28 (100.0%) |
| Personal Care & Service | 0 (0.0%) | 6 (100.0%) |
| Total (Category) | 29 (18.1%) | 131 (81.9%) |
| Total (Overall) | 337 (57.2%) | 252 (42.8%) |
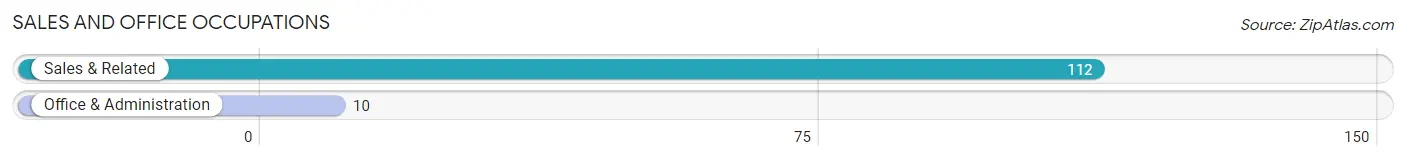
Sales and Office Occupations
The most common Sales and Office occupations in Palmview South are Sales & Related (112 | 19.0%), and Office & Administration (10 | 1.7%).
Sales and Office Occupations by Sex
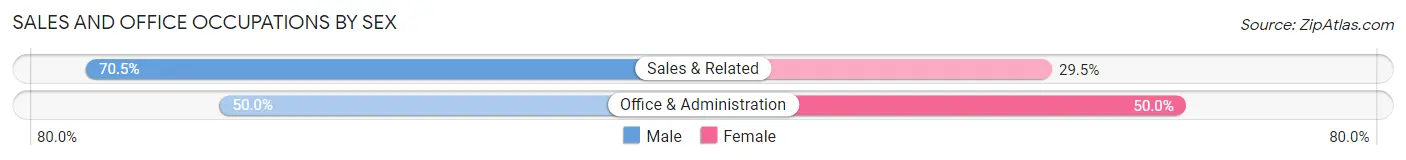
| Occupation | Male | Female |
| Sales & Related | 79 (70.5%) | 33 (29.5%) |
| Office & Administration | 5 (50.0%) | 5 (50.0%) |
| Total (Category) | 84 (68.9%) | 38 (31.1%) |
| Total (Overall) | 337 (57.2%) | 252 (42.8%) |
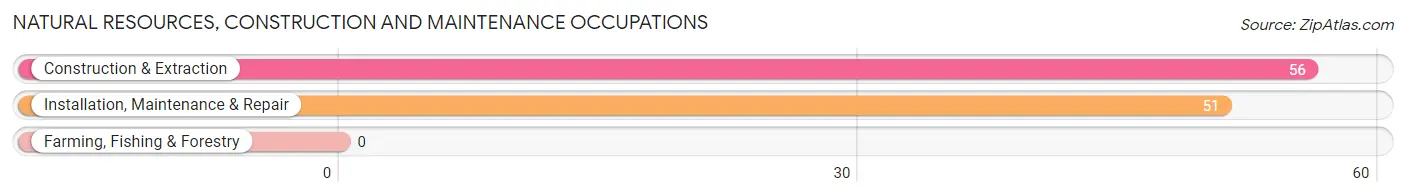
Natural Resources, Construction and Maintenance Occupations
The most common Natural Resources, Construction and Maintenance occupations in Palmview South are Construction & Extraction (56 | 9.5%), and Installation, Maintenance & Repair (51 | 8.7%).
Natural Resources, Construction and Maintenance Occupations by Sex
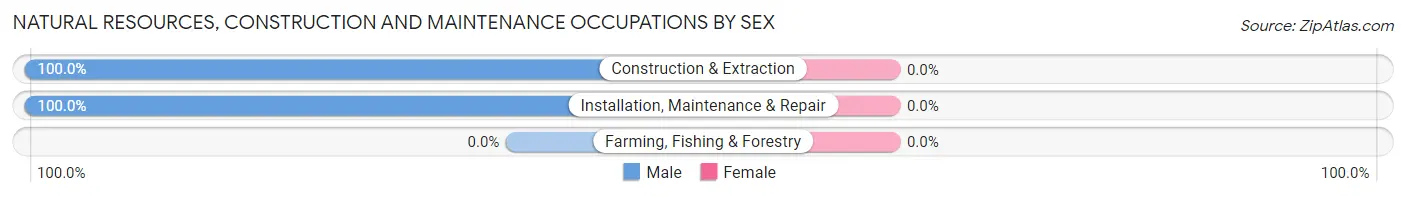
| Occupation | Male | Female |
| Farming, Fishing & Forestry | 0 (0.0%) | 0 (0.0%) |
| Construction & Extraction | 56 (100.0%) | 0 (0.0%) |
| Installation, Maintenance & Repair | 51 (100.0%) | 0 (0.0%) |
| Total (Category) | 107 (100.0%) | 0 (0.0%) |
| Total (Overall) | 337 (57.2%) | 252 (42.8%) |
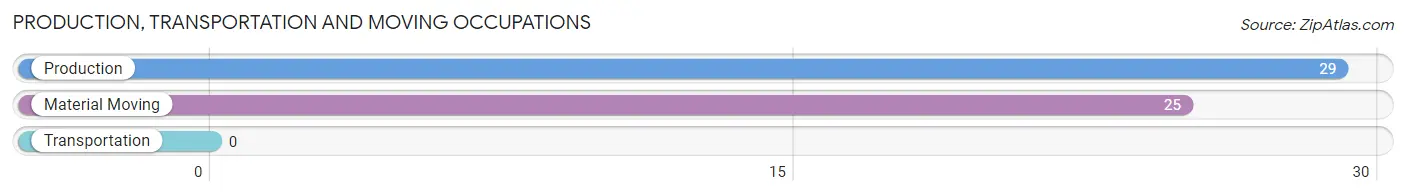
Production, Transportation and Moving Occupations
The most common Production, Transportation and Moving occupations in Palmview South are Production (29 | 4.9%), and Material Moving (25 | 4.2%).
Production, Transportation and Moving Occupations by Sex
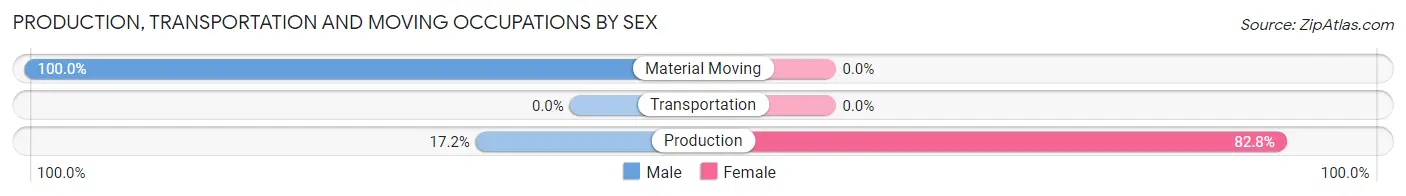
| Occupation | Male | Female |
| Production | 5 (17.2%) | 24 (82.8%) |
| Transportation | 0 (0.0%) | 0 (0.0%) |
| Material Moving | 25 (100.0%) | 0 (0.0%) |
| Total (Category) | 30 (55.6%) | 24 (44.4%) |
| Total (Overall) | 337 (57.2%) | 252 (42.8%) |
Employment Industries by Sex in Palmview South
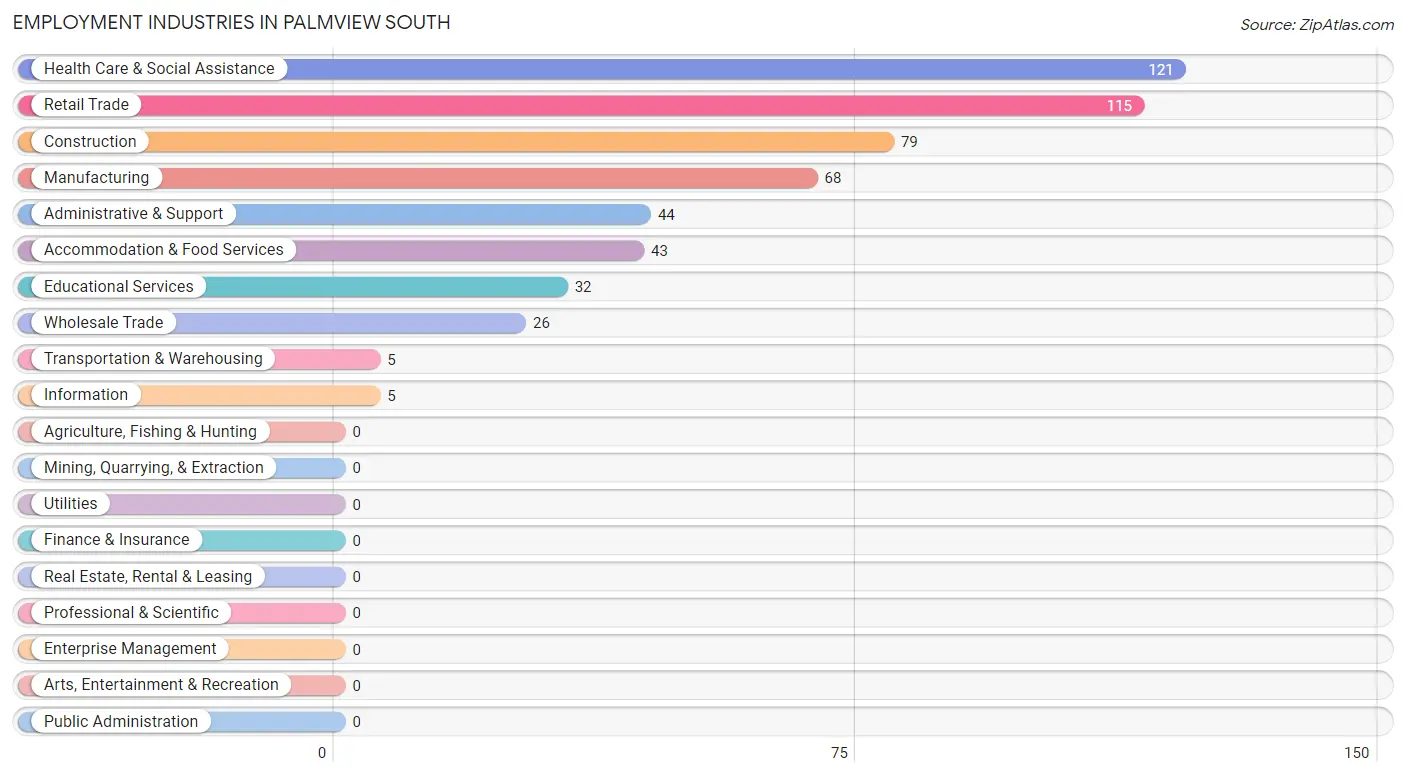
Employment Industries in Palmview South
The major employment industries in Palmview South include Health Care & Social Assistance (121 | 20.5%), Retail Trade (115 | 19.5%), Construction (79 | 13.4%), Manufacturing (68 | 11.5%), and Administrative & Support (44 | 7.5%).
Employment Industries by Sex in Palmview South
The Palmview South industries that see more men than women are Manufacturing (100.0%), Wholesale Trade (100.0%), and Transportation & Warehousing (100.0%), whereas the industries that tend to have a higher number of women are Information (100.0%), Educational Services (100.0%), and Health Care & Social Assistance (86.0%).
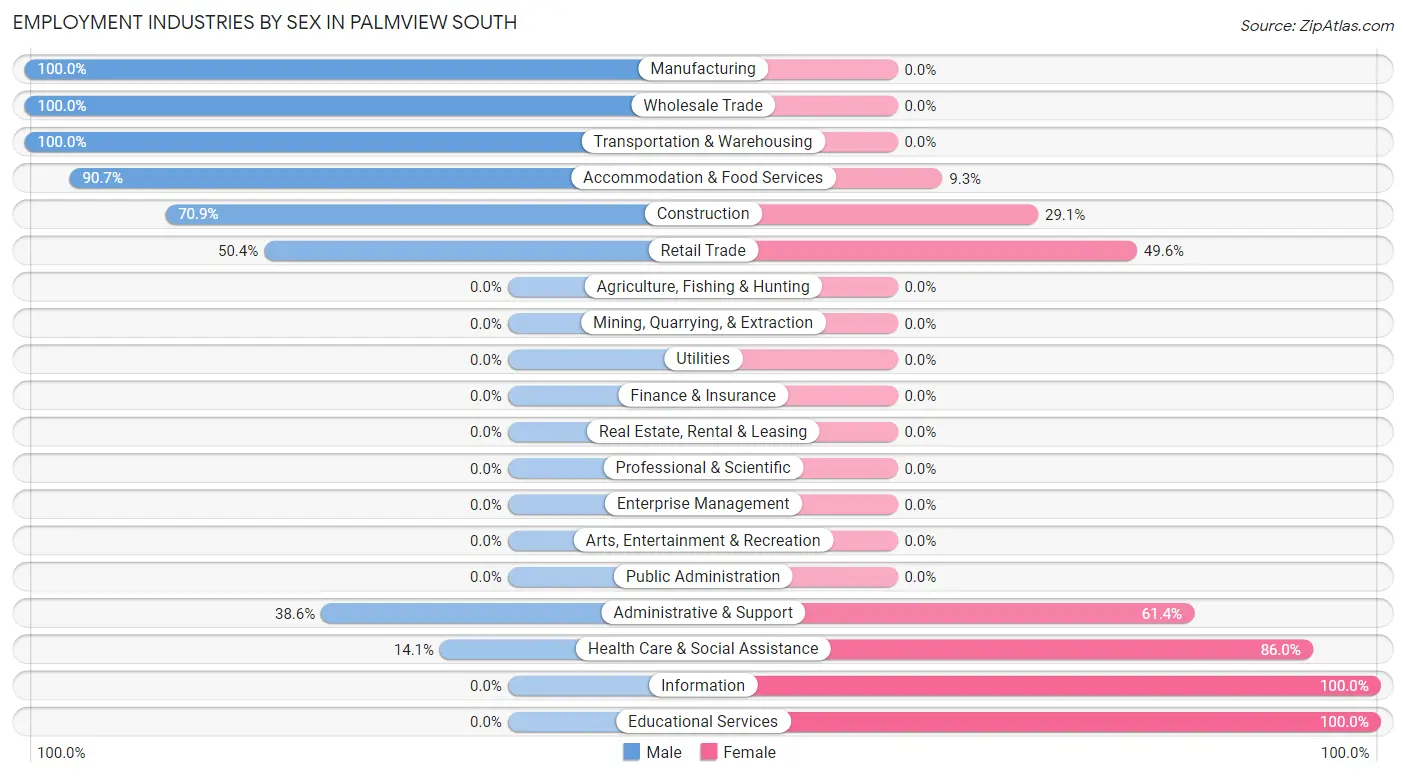
| Industry | Male | Female |
| Agriculture, Fishing & Hunting | 0 (0.0%) | 0 (0.0%) |
| Mining, Quarrying, & Extraction | 0 (0.0%) | 0 (0.0%) |
| Construction | 56 (70.9%) | 23 (29.1%) |
| Manufacturing | 68 (100.0%) | 0 (0.0%) |
| Wholesale Trade | 26 (100.0%) | 0 (0.0%) |
| Retail Trade | 58 (50.4%) | 57 (49.6%) |
| Transportation & Warehousing | 5 (100.0%) | 0 (0.0%) |
| Utilities | 0 (0.0%) | 0 (0.0%) |
| Information | 0 (0.0%) | 5 (100.0%) |
| Finance & Insurance | 0 (0.0%) | 0 (0.0%) |
| Real Estate, Rental & Leasing | 0 (0.0%) | 0 (0.0%) |
| Professional & Scientific | 0 (0.0%) | 0 (0.0%) |
| Enterprise Management | 0 (0.0%) | 0 (0.0%) |
| Administrative & Support | 17 (38.6%) | 27 (61.4%) |
| Educational Services | 0 (0.0%) | 32 (100.0%) |
| Health Care & Social Assistance | 17 (14.1%) | 104 (86.0%) |
| Arts, Entertainment & Recreation | 0 (0.0%) | 0 (0.0%) |
| Accommodation & Food Services | 39 (90.7%) | 4 (9.3%) |
| Public Administration | 0 (0.0%) | 0 (0.0%) |
| Total | 337 (57.2%) | 252 (42.8%) |
Education in Palmview South
School Enrollment in Palmview South
The most common levels of schooling among the 657 students in Palmview South are middle school (285 | 43.4%), elementary school (147 | 22.4%), and high school (142 | 21.6%).
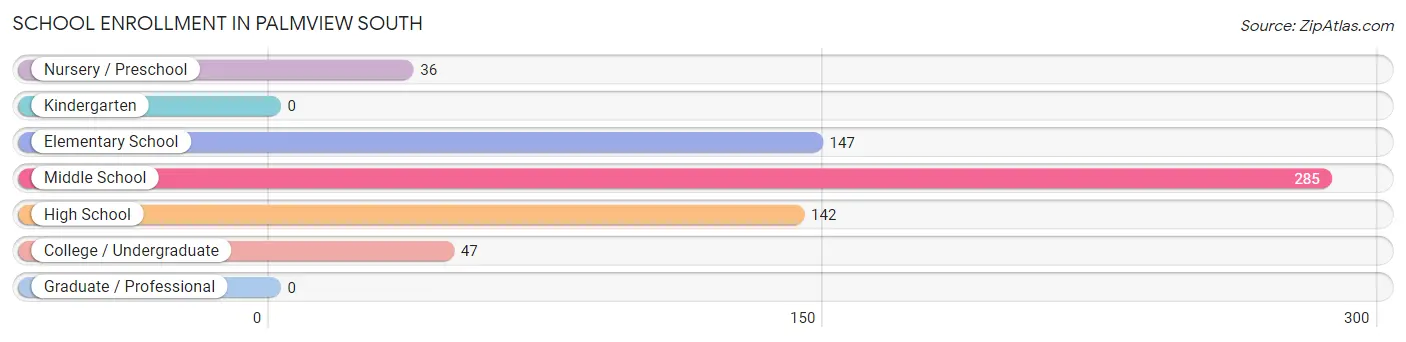
| School Level | # Students | % Students |
| Nursery / Preschool | 36 | 5.5% |
| Kindergarten | 0 | 0.0% |
| Elementary School | 147 | 22.4% |
| Middle School | 285 | 43.4% |
| High School | 142 | 21.6% |
| College / Undergraduate | 47 | 7.1% |
| Graduate / Professional | 0 | 0.0% |
| Total | 657 | 100.0% |
School Enrollment by Age by Funding Source in Palmview South
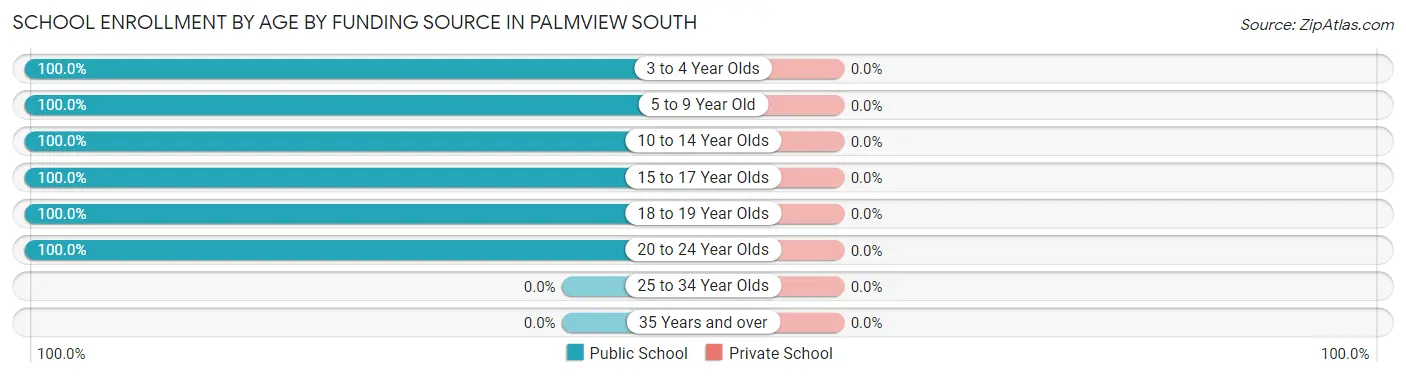
| Age Bracket | Public School | Private School |
| 3 to 4 Year Olds | 36 (100.0%) | 0 (0.0%) |
| 5 to 9 Year Old | 147 (100.0%) | 0 (0.0%) |
| 10 to 14 Year Olds | 285 (100.0%) | 0 (0.0%) |
| 15 to 17 Year Olds | 153 (100.0%) | 0 (0.0%) |
| 18 to 19 Year Olds | 30 (100.0%) | 0 (0.0%) |
| 20 to 24 Year Olds | 6 (100.0%) | 0 (0.0%) |
| 25 to 34 Year Olds | 0 (0.0%) | 0 (0.0%) |
| 35 Years and over | 0 (0.0%) | 0 (0.0%) |
| Total | 657 (100.0%) | 0 (0.0%) |
Educational Attainment by Field of Study in Palmview South
Engineering (43 | 29.4%), visual & performing arts (39 | 26.7%), business (32 | 21.9%), and education (32 | 21.9%) are the most common fields of study among 146 individuals in Palmview South who have obtained a bachelor's degree or higher.
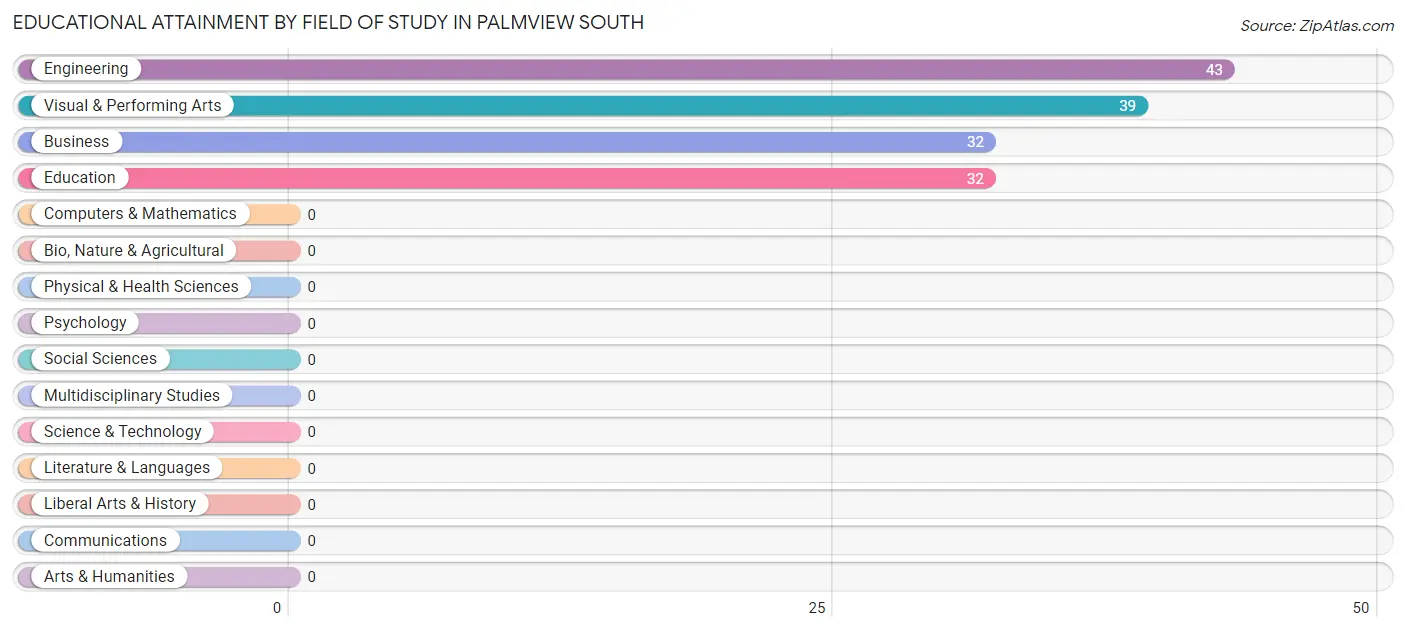
| Field of Study | # Graduates | % Graduates |
| Computers & Mathematics | 0 | 0.0% |
| Bio, Nature & Agricultural | 0 | 0.0% |
| Physical & Health Sciences | 0 | 0.0% |
| Psychology | 0 | 0.0% |
| Social Sciences | 0 | 0.0% |
| Engineering | 43 | 29.4% |
| Multidisciplinary Studies | 0 | 0.0% |
| Science & Technology | 0 | 0.0% |
| Business | 32 | 21.9% |
| Education | 32 | 21.9% |
| Literature & Languages | 0 | 0.0% |
| Liberal Arts & History | 0 | 0.0% |
| Visual & Performing Arts | 39 | 26.7% |
| Communications | 0 | 0.0% |
| Arts & Humanities | 0 | 0.0% |
| Total | 146 | 100.0% |
Transportation & Commute in Palmview South
Vehicle Availability by Sex in Palmview South
The most prevalent vehicle ownership categories in Palmview South are males with 2 vehicles (153, accounting for 53.5%) and females with 2 vehicles (67, making up 60.7%).
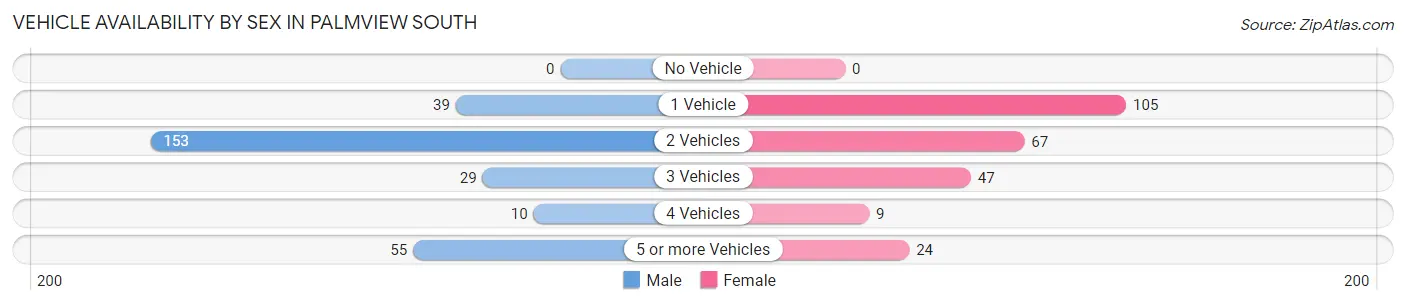
| Vehicles Available | Male | Female |
| No Vehicle | 0 (0.0%) | 0 (0.0%) |
| 1 Vehicle | 39 (13.6%) | 105 (41.7%) |
| 2 Vehicles | 153 (53.5%) | 67 (26.6%) |
| 3 Vehicles | 29 (10.1%) | 47 (18.6%) |
| 4 Vehicles | 10 (3.5%) | 9 (3.6%) |
| 5 or more Vehicles | 55 (19.2%) | 24 (9.5%) |
| Total | 286 (100.0%) | 252 (100.0%) |
Commute Time in Palmview South
The most frequently occuring commute durations in Palmview South are 15 to 19 minutes (123 commuters, 25.6%), 10 to 14 minutes (105 commuters, 21.9%), and 40 to 44 minutes (82 commuters, 17.1%).
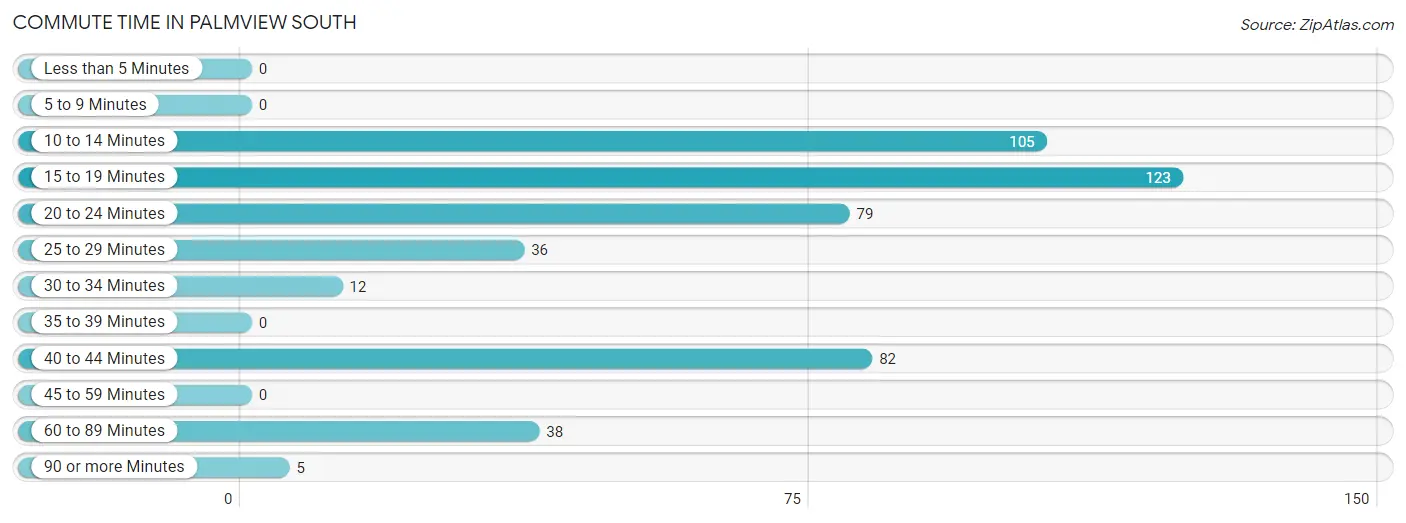
| Commute Time | # Commuters | % Commuters |
| Less than 5 Minutes | 0 | 0.0% |
| 5 to 9 Minutes | 0 | 0.0% |
| 10 to 14 Minutes | 105 | 21.9% |
| 15 to 19 Minutes | 123 | 25.6% |
| 20 to 24 Minutes | 79 | 16.5% |
| 25 to 29 Minutes | 36 | 7.5% |
| 30 to 34 Minutes | 12 | 2.5% |
| 35 to 39 Minutes | 0 | 0.0% |
| 40 to 44 Minutes | 82 | 17.1% |
| 45 to 59 Minutes | 0 | 0.0% |
| 60 to 89 Minutes | 38 | 7.9% |
| 90 or more Minutes | 5 | 1.0% |
Commute Time by Sex in Palmview South
The most common commute times in Palmview South are 15 to 19 minutes (80 commuters, 31.2%) for males and 10 to 14 minutes (88 commuters, 39.3%) for females.
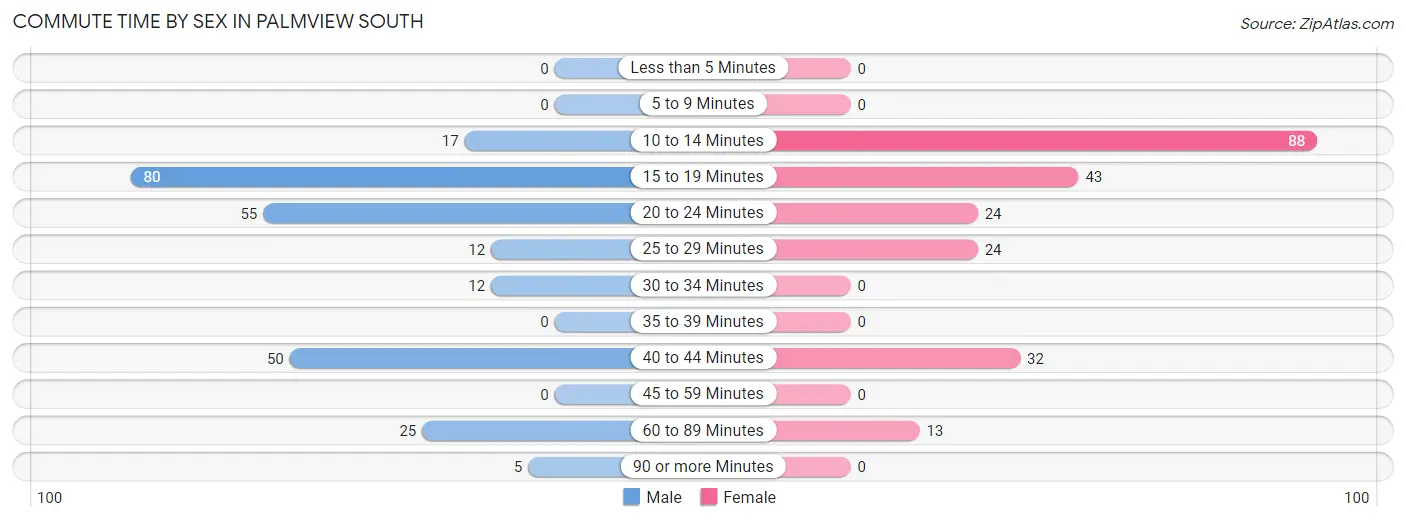
| Commute Time | Male | Female |
| Less than 5 Minutes | 0 (0.0%) | 0 (0.0%) |
| 5 to 9 Minutes | 0 (0.0%) | 0 (0.0%) |
| 10 to 14 Minutes | 17 (6.6%) | 88 (39.3%) |
| 15 to 19 Minutes | 80 (31.2%) | 43 (19.2%) |
| 20 to 24 Minutes | 55 (21.5%) | 24 (10.7%) |
| 25 to 29 Minutes | 12 (4.7%) | 24 (10.7%) |
| 30 to 34 Minutes | 12 (4.7%) | 0 (0.0%) |
| 35 to 39 Minutes | 0 (0.0%) | 0 (0.0%) |
| 40 to 44 Minutes | 50 (19.5%) | 32 (14.3%) |
| 45 to 59 Minutes | 0 (0.0%) | 0 (0.0%) |
| 60 to 89 Minutes | 25 (9.8%) | 13 (5.8%) |
| 90 or more Minutes | 5 (1.9%) | 0 (0.0%) |
Time of Departure to Work by Sex in Palmview South
The most frequent times of departure to work in Palmview South are 7:30 AM to 7:59 AM (57, 22.3%) for males and 7:30 AM to 7:59 AM (56, 25.0%) for females.
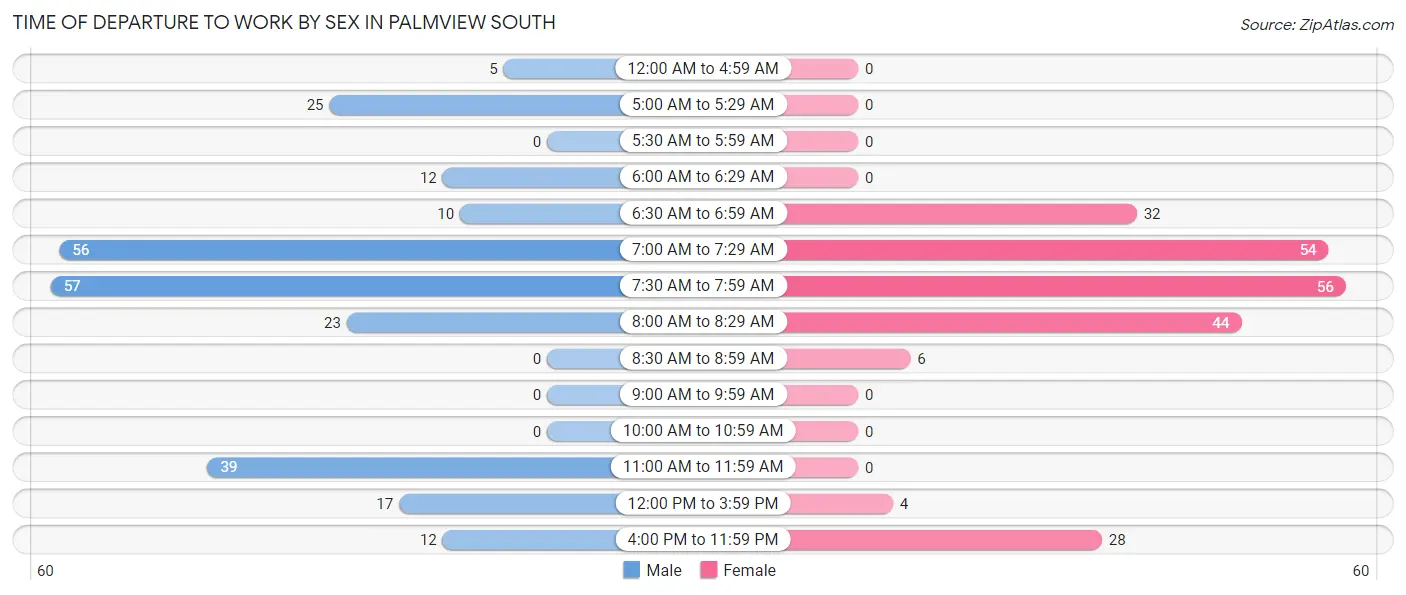
| Time of Departure | Male | Female |
| 12:00 AM to 4:59 AM | 5 (1.9%) | 0 (0.0%) |
| 5:00 AM to 5:29 AM | 25 (9.8%) | 0 (0.0%) |
| 5:30 AM to 5:59 AM | 0 (0.0%) | 0 (0.0%) |
| 6:00 AM to 6:29 AM | 12 (4.7%) | 0 (0.0%) |
| 6:30 AM to 6:59 AM | 10 (3.9%) | 32 (14.3%) |
| 7:00 AM to 7:29 AM | 56 (21.9%) | 54 (24.1%) |
| 7:30 AM to 7:59 AM | 57 (22.3%) | 56 (25.0%) |
| 8:00 AM to 8:29 AM | 23 (9.0%) | 44 (19.6%) |
| 8:30 AM to 8:59 AM | 0 (0.0%) | 6 (2.7%) |
| 9:00 AM to 9:59 AM | 0 (0.0%) | 0 (0.0%) |
| 10:00 AM to 10:59 AM | 0 (0.0%) | 0 (0.0%) |
| 11:00 AM to 11:59 AM | 39 (15.2%) | 0 (0.0%) |
| 12:00 PM to 3:59 PM | 17 (6.6%) | 4 (1.8%) |
| 4:00 PM to 11:59 PM | 12 (4.7%) | 28 (12.5%) |
| Total | 256 (100.0%) | 224 (100.0%) |
Housing Occupancy in Palmview South
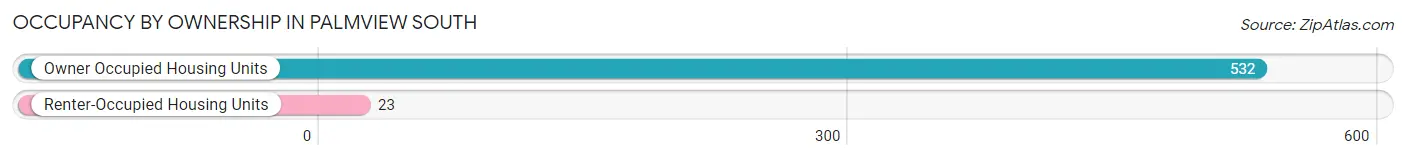
Occupancy by Ownership in Palmview South
Of the total 555 dwellings in Palmview South, owner-occupied units account for 532 (95.9%), while renter-occupied units make up 23 (4.1%).
| Occupancy | # Housing Units | % Housing Units |
| Owner Occupied Housing Units | 532 | 95.9% |
| Renter-Occupied Housing Units | 23 | 4.1% |
| Total Occupied Housing Units | 555 | 100.0% |
Occupancy by Household Size in Palmview South
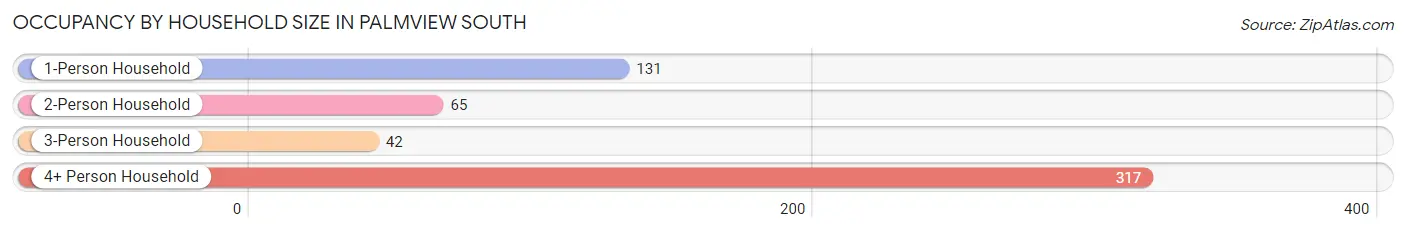
| Household Size | # Housing Units | % Housing Units |
| 1-Person Household | 131 | 23.6% |
| 2-Person Household | 65 | 11.7% |
| 3-Person Household | 42 | 7.6% |
| 4+ Person Household | 317 | 57.1% |
| Total Housing Units | 555 | 100.0% |
Occupancy by Ownership by Household Size in Palmview South
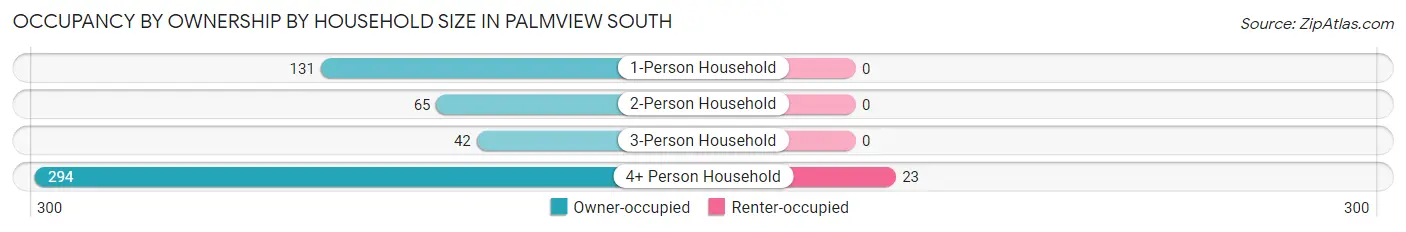
| Household Size | Owner-occupied | Renter-occupied |
| 1-Person Household | 131 (100.0%) | 0 (0.0%) |
| 2-Person Household | 65 (100.0%) | 0 (0.0%) |
| 3-Person Household | 42 (100.0%) | 0 (0.0%) |
| 4+ Person Household | 294 (92.7%) | 23 (7.3%) |
| Total Housing Units | 532 (95.9%) | 23 (4.1%) |
Occupancy by Educational Attainment in Palmview South
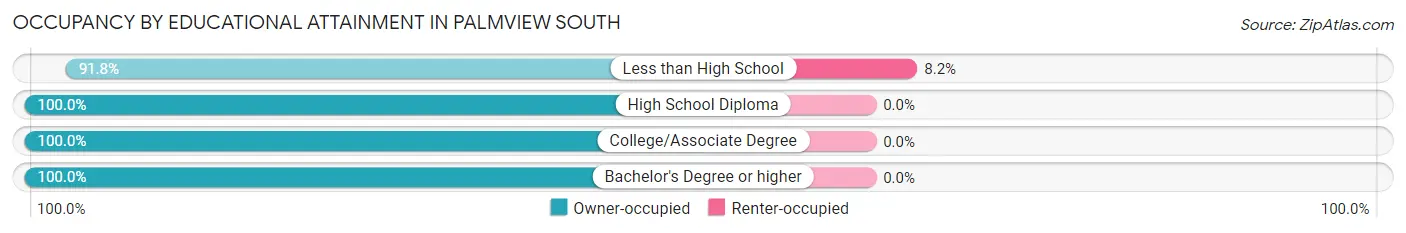
| Household Size | Owner-occupied | Renter-occupied |
| Less than High School | 259 (91.8%) | 23 (8.2%) |
| High School Diploma | 133 (100.0%) | 0 (0.0%) |
| College/Associate Degree | 68 (100.0%) | 0 (0.0%) |
| Bachelor's Degree or higher | 72 (100.0%) | 0 (0.0%) |
Occupancy by Age of Householder in Palmview South
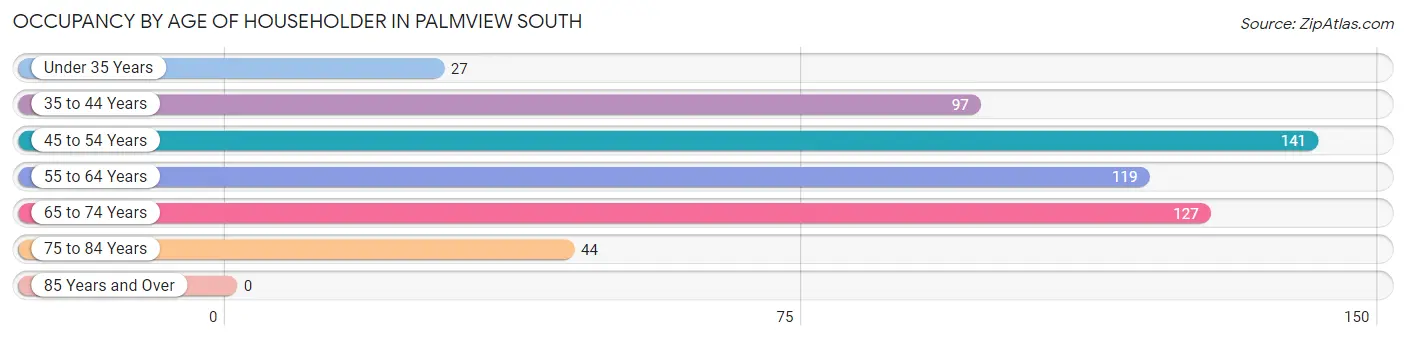
| Age Bracket | # Households | % Households |
| Under 35 Years | 27 | 4.9% |
| 35 to 44 Years | 97 | 17.5% |
| 45 to 54 Years | 141 | 25.4% |
| 55 to 64 Years | 119 | 21.4% |
| 65 to 74 Years | 127 | 22.9% |
| 75 to 84 Years | 44 | 7.9% |
| 85 Years and Over | 0 | 0.0% |
| Total | 555 | 100.0% |
Housing Finances in Palmview South
Median Income by Occupancy in Palmview South
| Occupancy Type | # Households | Median Income |
| Owner-Occupied | 532 (95.9%) | $0 |
| Renter-Occupied | 23 (4.1%) | $0 |
| Average | 555 (100.0%) | $0 |
Occupancy by Householder Income Bracket in Palmview South
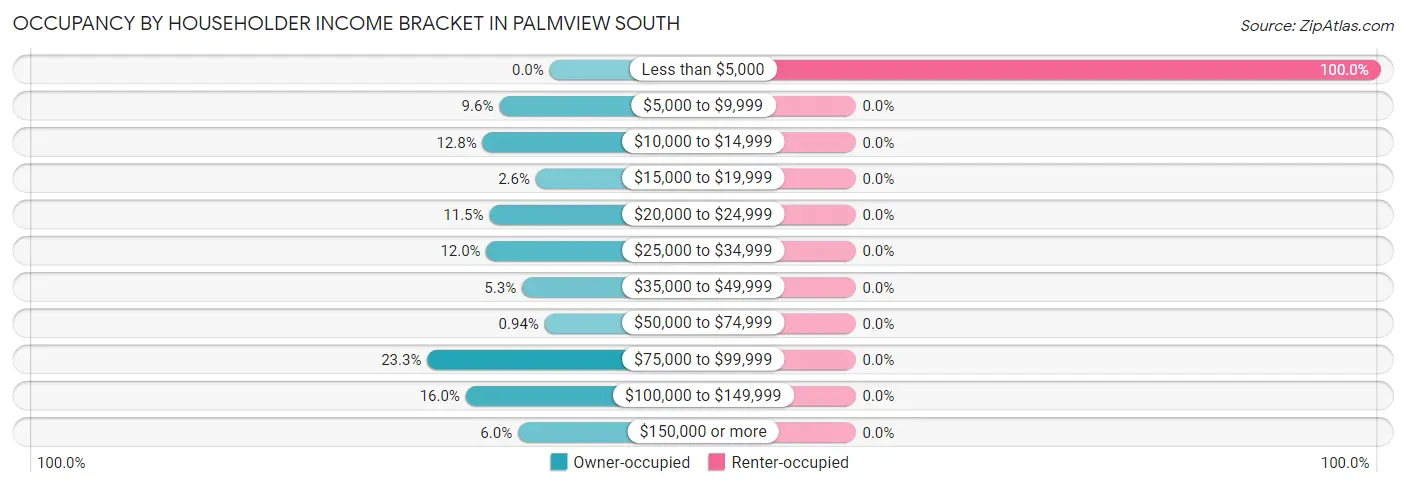
| Income Bracket | Owner-occupied | Renter-occupied |
| Less than $5,000 | 0 (0.0%) | 23 (100.0%) |
| $5,000 to $9,999 | 51 (9.6%) | 0 (0.0%) |
| $10,000 to $14,999 | 68 (12.8%) | 0 (0.0%) |
| $15,000 to $19,999 | 14 (2.6%) | 0 (0.0%) |
| $20,000 to $24,999 | 61 (11.5%) | 0 (0.0%) |
| $25,000 to $34,999 | 64 (12.0%) | 0 (0.0%) |
| $35,000 to $49,999 | 28 (5.3%) | 0 (0.0%) |
| $50,000 to $74,999 | 5 (0.9%) | 0 (0.0%) |
| $75,000 to $99,999 | 124 (23.3%) | 0 (0.0%) |
| $100,000 to $149,999 | 85 (16.0%) | 0 (0.0%) |
| $150,000 or more | 32 (6.0%) | 0 (0.0%) |
| Total | 532 (100.0%) | 23 (100.0%) |
Monthly Housing Cost Tiers in Palmview South
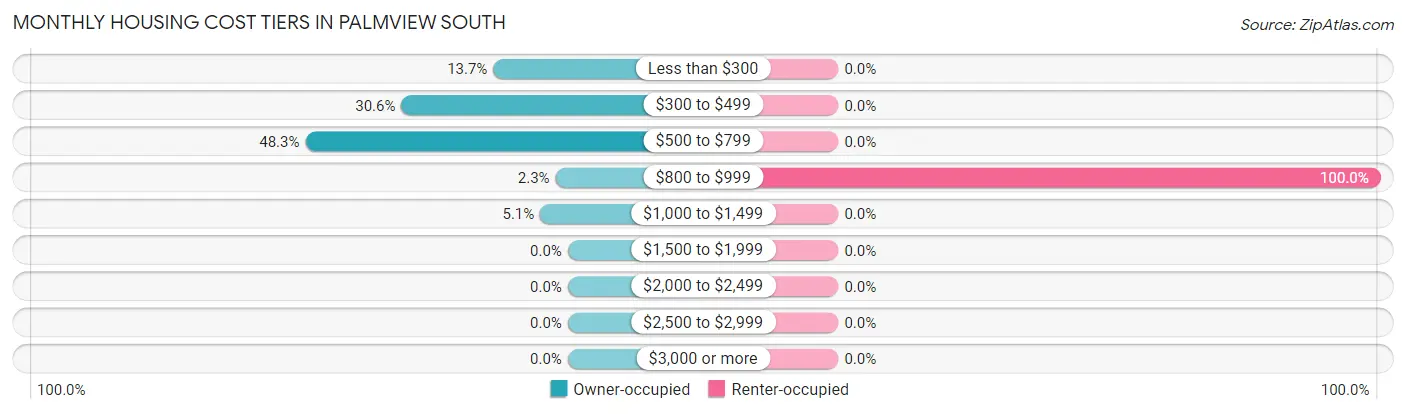
| Monthly Cost | Owner-occupied | Renter-occupied |
| Less than $300 | 73 (13.7%) | 0 (0.0%) |
| $300 to $499 | 163 (30.6%) | 0 (0.0%) |
| $500 to $799 | 257 (48.3%) | 0 (0.0%) |
| $800 to $999 | 12 (2.3%) | 23 (100.0%) |
| $1,000 to $1,499 | 27 (5.1%) | 0 (0.0%) |
| $1,500 to $1,999 | 0 (0.0%) | 0 (0.0%) |
| $2,000 to $2,499 | 0 (0.0%) | 0 (0.0%) |
| $2,500 to $2,999 | 0 (0.0%) | 0 (0.0%) |
| $3,000 or more | 0 (0.0%) | 0 (0.0%) |
| Total | 532 (100.0%) | 23 (100.0%) |
Physical Housing Characteristics in Palmview South
Housing Structures in Palmview South
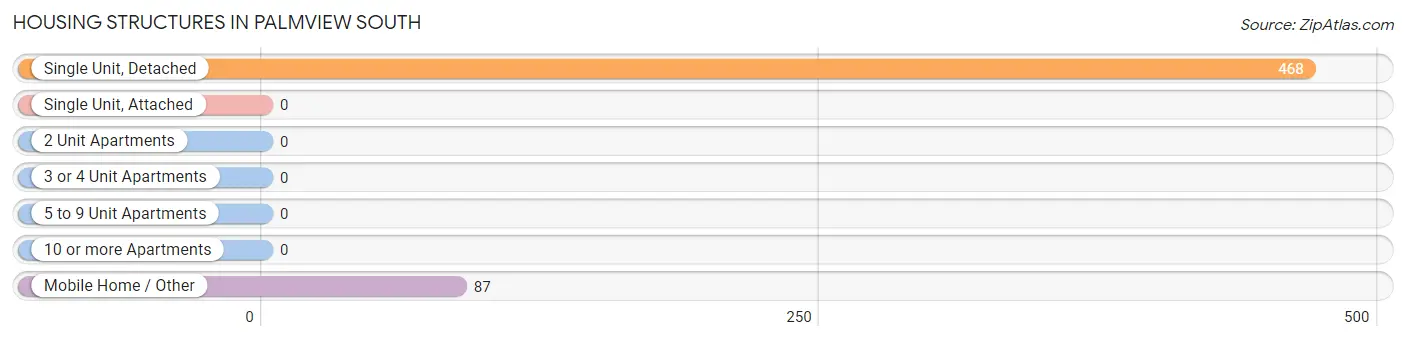
| Structure Type | # Housing Units | % Housing Units |
| Single Unit, Detached | 468 | 84.3% |
| Single Unit, Attached | 0 | 0.0% |
| 2 Unit Apartments | 0 | 0.0% |
| 3 or 4 Unit Apartments | 0 | 0.0% |
| 5 to 9 Unit Apartments | 0 | 0.0% |
| 10 or more Apartments | 0 | 0.0% |
| Mobile Home / Other | 87 | 15.7% |
| Total | 555 | 100.0% |
Housing Structures by Occupancy in Palmview South
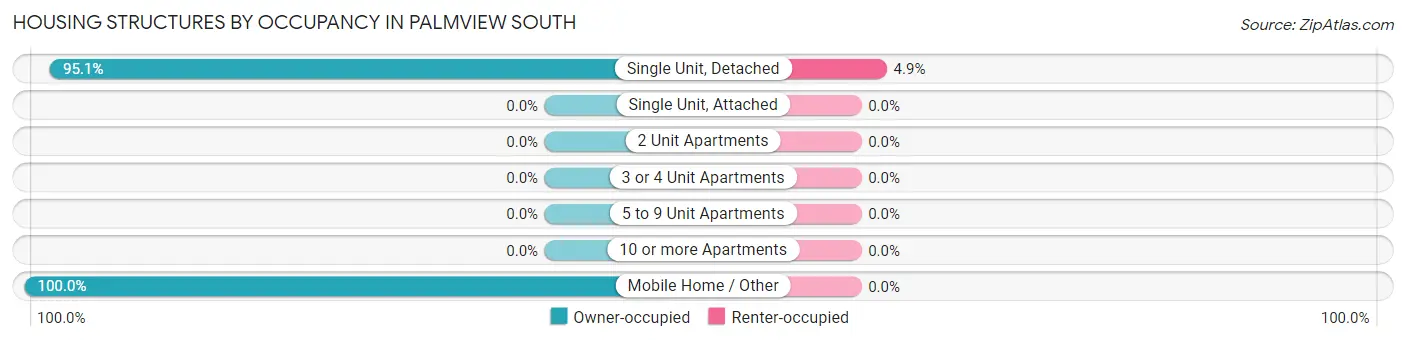
| Structure Type | Owner-occupied | Renter-occupied |
| Single Unit, Detached | 445 (95.1%) | 23 (4.9%) |
| Single Unit, Attached | 0 (0.0%) | 0 (0.0%) |
| 2 Unit Apartments | 0 (0.0%) | 0 (0.0%) |
| 3 or 4 Unit Apartments | 0 (0.0%) | 0 (0.0%) |
| 5 to 9 Unit Apartments | 0 (0.0%) | 0 (0.0%) |
| 10 or more Apartments | 0 (0.0%) | 0 (0.0%) |
| Mobile Home / Other | 87 (100.0%) | 0 (0.0%) |
| Total | 532 (95.9%) | 23 (4.1%) |
Housing Structures by Number of Rooms in Palmview South
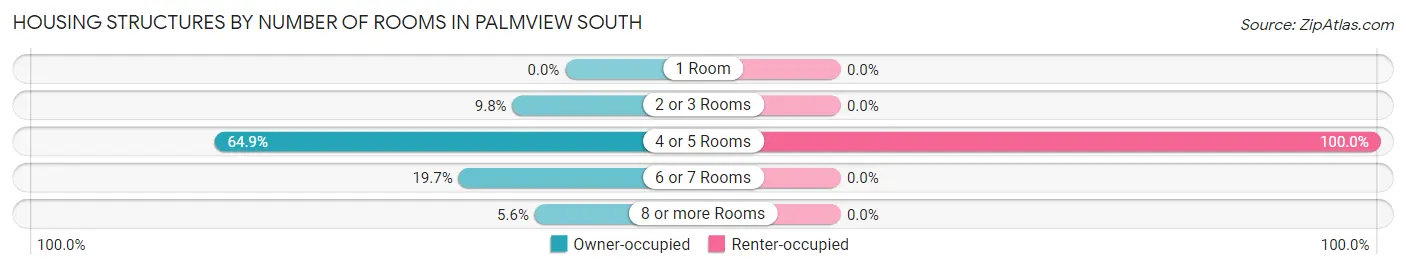
| Number of Rooms | Owner-occupied | Renter-occupied |
| 1 Room | 0 (0.0%) | 0 (0.0%) |
| 2 or 3 Rooms | 52 (9.8%) | 0 (0.0%) |
| 4 or 5 Rooms | 345 (64.8%) | 23 (100.0%) |
| 6 or 7 Rooms | 105 (19.7%) | 0 (0.0%) |
| 8 or more Rooms | 30 (5.6%) | 0 (0.0%) |
| Total | 532 (100.0%) | 23 (100.0%) |
Housing Structure by Heating Type in Palmview South
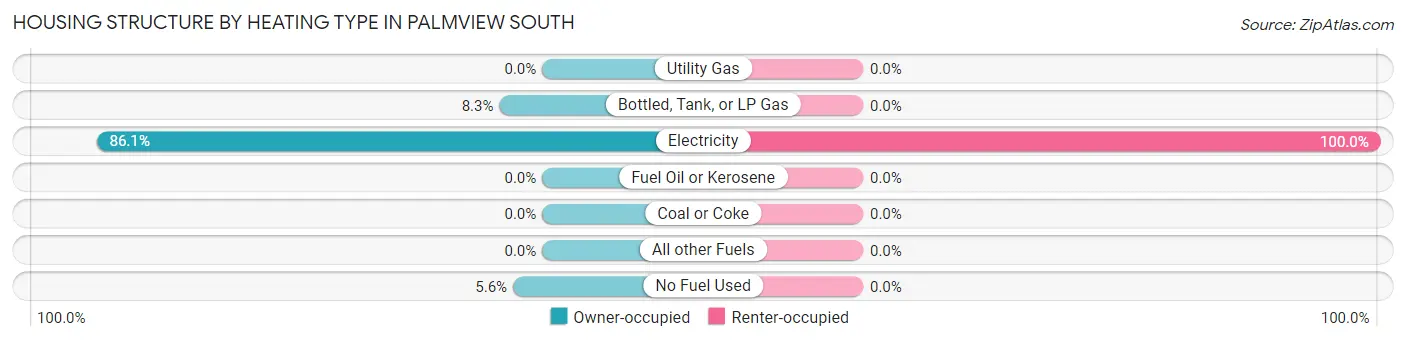
| Heating Type | Owner-occupied | Renter-occupied |
| Utility Gas | 0 (0.0%) | 0 (0.0%) |
| Bottled, Tank, or LP Gas | 44 (8.3%) | 0 (0.0%) |
| Electricity | 458 (86.1%) | 23 (100.0%) |
| Fuel Oil or Kerosene | 0 (0.0%) | 0 (0.0%) |
| Coal or Coke | 0 (0.0%) | 0 (0.0%) |
| All other Fuels | 0 (0.0%) | 0 (0.0%) |
| No Fuel Used | 30 (5.6%) | 0 (0.0%) |
| Total | 532 (100.0%) | 23 (100.0%) |
Household Vehicle Usage in Palmview South
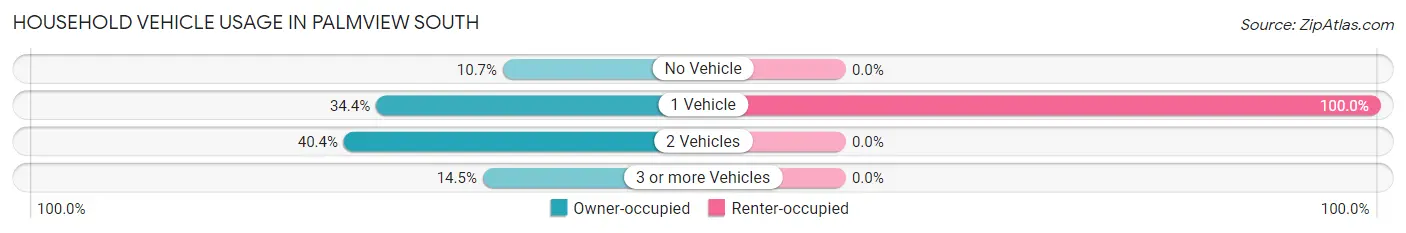
| Vehicles per Household | Owner-occupied | Renter-occupied |
| No Vehicle | 57 (10.7%) | 0 (0.0%) |
| 1 Vehicle | 183 (34.4%) | 23 (100.0%) |
| 2 Vehicles | 215 (40.4%) | 0 (0.0%) |
| 3 or more Vehicles | 77 (14.5%) | 0 (0.0%) |
| Total | 532 (100.0%) | 23 (100.0%) |
Real Estate & Mortgages in Palmview South
Real Estate and Mortgage Overview in Palmview South
| Characteristic | Without Mortgage | With Mortgage |
| Housing Units | 429 | 103 |
| Median Property Value | $80,100 | $0 |
| Median Household Income | - | - |
| Monthly Housing Costs | $472 | $0 |
| Real Estate Taxes | $1,341 | $0 |
Property Value by Mortgage Status in Palmview South
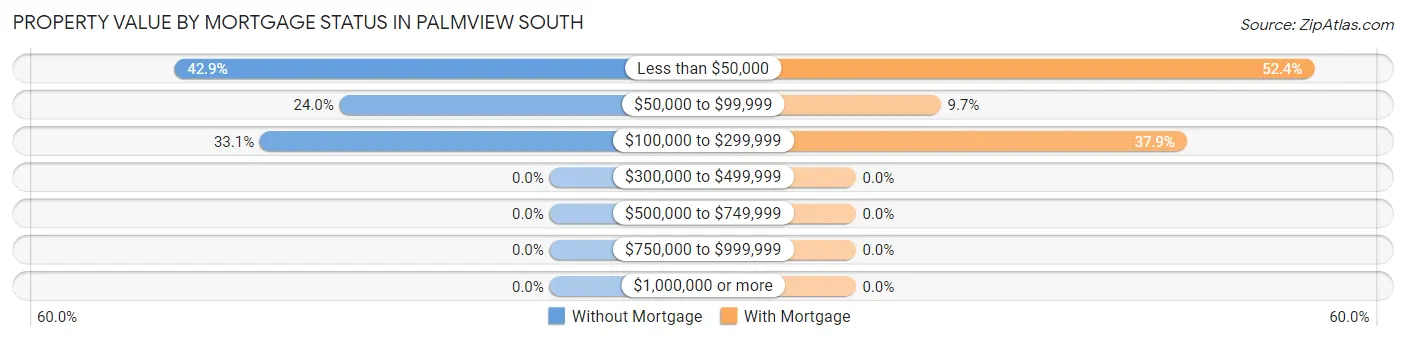
| Property Value | Without Mortgage | With Mortgage |
| Less than $50,000 | 184 (42.9%) | 54 (52.4%) |
| $50,000 to $99,999 | 103 (24.0%) | 10 (9.7%) |
| $100,000 to $299,999 | 142 (33.1%) | 39 (37.9%) |
| $300,000 to $499,999 | 0 (0.0%) | 0 (0.0%) |
| $500,000 to $749,999 | 0 (0.0%) | 0 (0.0%) |
| $750,000 to $999,999 | 0 (0.0%) | 0 (0.0%) |
| $1,000,000 or more | 0 (0.0%) | 0 (0.0%) |
| Total | 429 (100.0%) | 103 (100.0%) |
Household Income by Mortgage Status in Palmview South
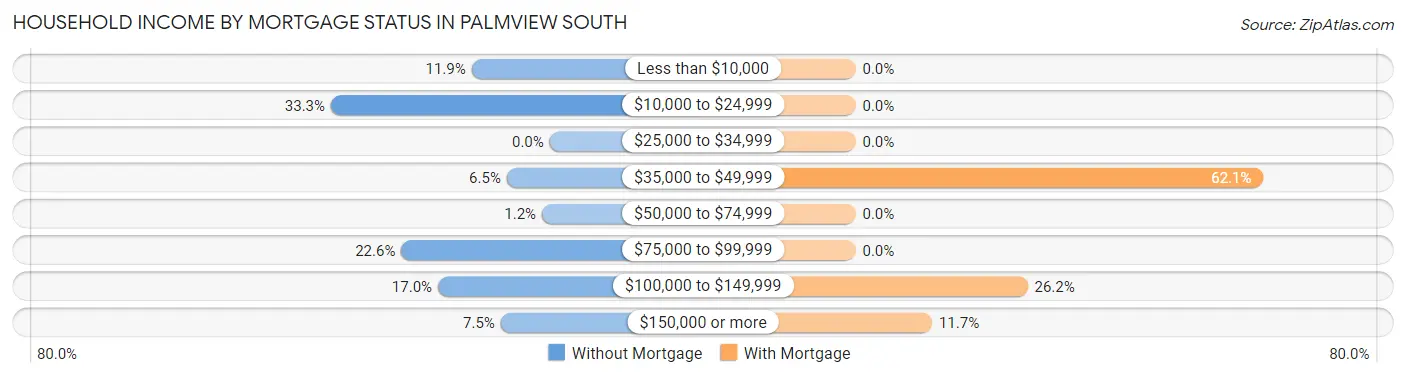
| Household Income | Without Mortgage | With Mortgage |
| Less than $10,000 | 51 (11.9%) | 0 (0.0%) |
| $10,000 to $24,999 | 143 (33.3%) | 0 (0.0%) |
| $25,000 to $34,999 | 0 (0.0%) | 0 (0.0%) |
| $35,000 to $49,999 | 28 (6.5%) | 64 (62.1%) |
| $50,000 to $74,999 | 5 (1.2%) | 0 (0.0%) |
| $75,000 to $99,999 | 97 (22.6%) | 0 (0.0%) |
| $100,000 to $149,999 | 73 (17.0%) | 27 (26.2%) |
| $150,000 or more | 32 (7.5%) | 12 (11.7%) |
| Total | 429 (100.0%) | 103 (100.0%) |
Property Value to Household Income Ratio in Palmview South
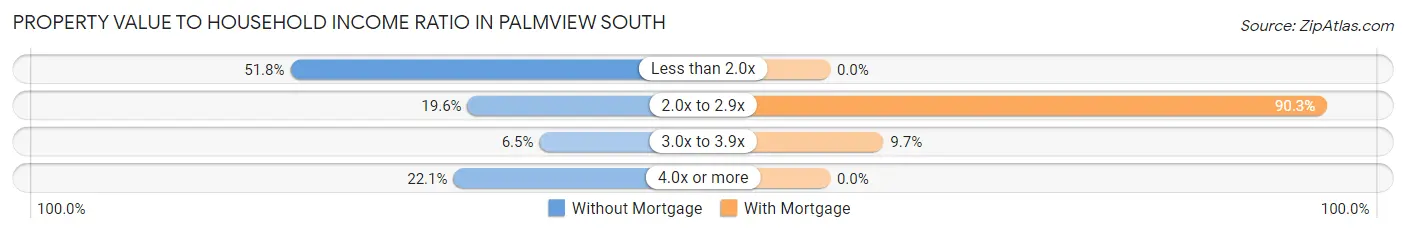
| Value-to-Income Ratio | Without Mortgage | With Mortgage |
| Less than 2.0x | 222 (51.7%) | 0 (0.0%) |
| 2.0x to 2.9x | 84 (19.6%) | 93 (90.3%) |
| 3.0x to 3.9x | 28 (6.5%) | 10 (9.7%) |
| 4.0x or more | 95 (22.1%) | 0 (0.0%) |
| Total | 429 (100.0%) | 103 (100.0%) |
Real Estate Taxes by Mortgage Status in Palmview South
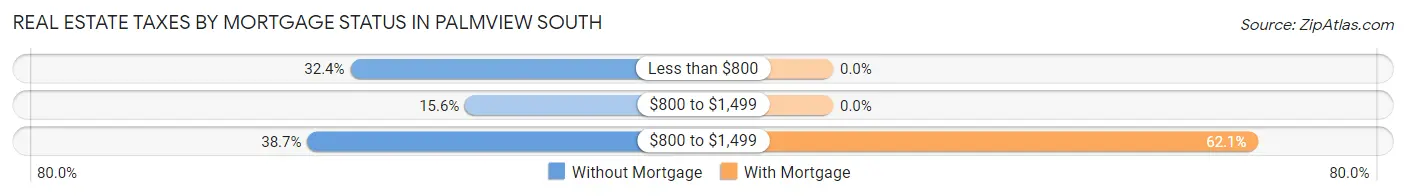
| Property Taxes | Without Mortgage | With Mortgage |
| Less than $800 | 139 (32.4%) | 0 (0.0%) |
| $800 to $1,499 | 67 (15.6%) | 0 (0.0%) |
| $800 to $1,499 | 166 (38.7%) | 64 (62.1%) |
| Total | 429 (100.0%) | 103 (100.0%) |
Health & Disability in Palmview South
Health Insurance Coverage by Age in Palmview South
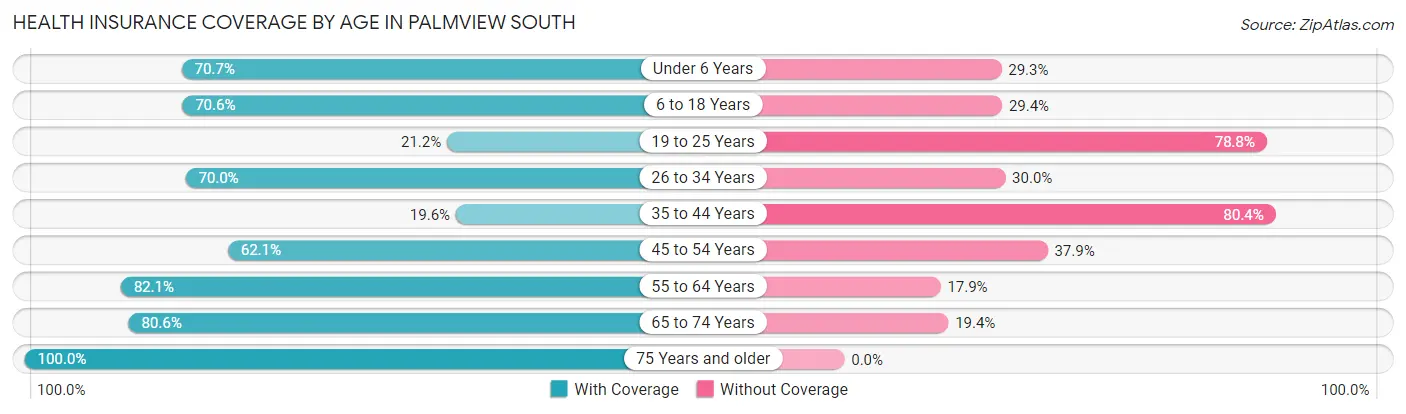
| Age Bracket | With Coverage | Without Coverage |
| Under 6 Years | 87 (70.7%) | 36 (29.3%) |
| 6 to 18 Years | 413 (70.6%) | 172 (29.4%) |
| 19 to 25 Years | 59 (21.2%) | 219 (78.8%) |
| 26 to 34 Years | 63 (70.0%) | 27 (30.0%) |
| 35 to 44 Years | 36 (19.6%) | 148 (80.4%) |
| 45 to 54 Years | 200 (62.1%) | 122 (37.9%) |
| 55 to 64 Years | 119 (82.1%) | 26 (17.9%) |
| 65 to 74 Years | 233 (80.6%) | 56 (19.4%) |
| 75 Years and older | 125 (100.0%) | 0 (0.0%) |
| Total | 1,335 (62.4%) | 806 (37.7%) |
Health Insurance Coverage by Citizenship Status in Palmview South
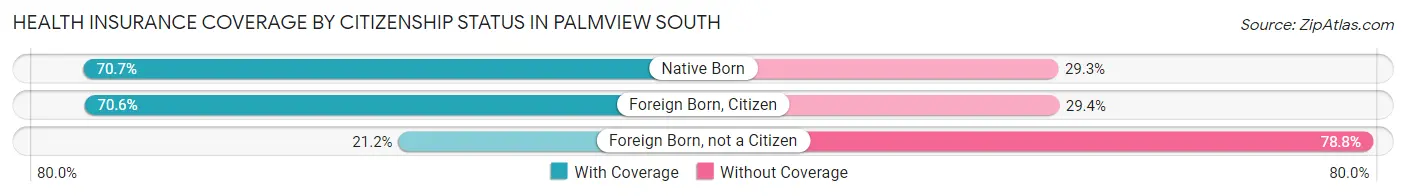
| Citizenship Status | With Coverage | Without Coverage |
| Native Born | 87 (70.7%) | 36 (29.3%) |
| Foreign Born, Citizen | 413 (70.6%) | 172 (29.4%) |
| Foreign Born, not a Citizen | 59 (21.2%) | 219 (78.8%) |
Health Insurance Coverage by Household Income in Palmview South
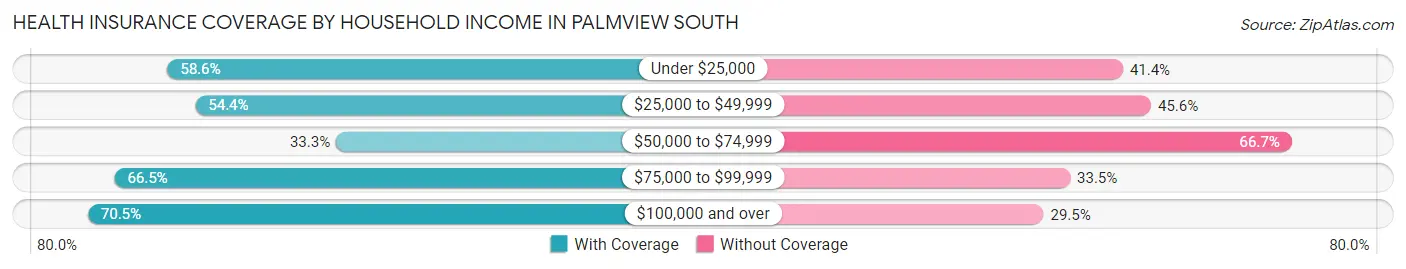
| Household Income | With Coverage | Without Coverage |
| Under $25,000 | 429 (58.6%) | 303 (41.4%) |
| $25,000 to $49,999 | 210 (54.4%) | 176 (45.6%) |
| $50,000 to $74,999 | 5 (33.3%) | 10 (66.7%) |
| $75,000 to $99,999 | 330 (66.5%) | 166 (33.5%) |
| $100,000 and over | 361 (70.5%) | 151 (29.5%) |
Public vs Private Health Insurance Coverage by Age in Palmview South
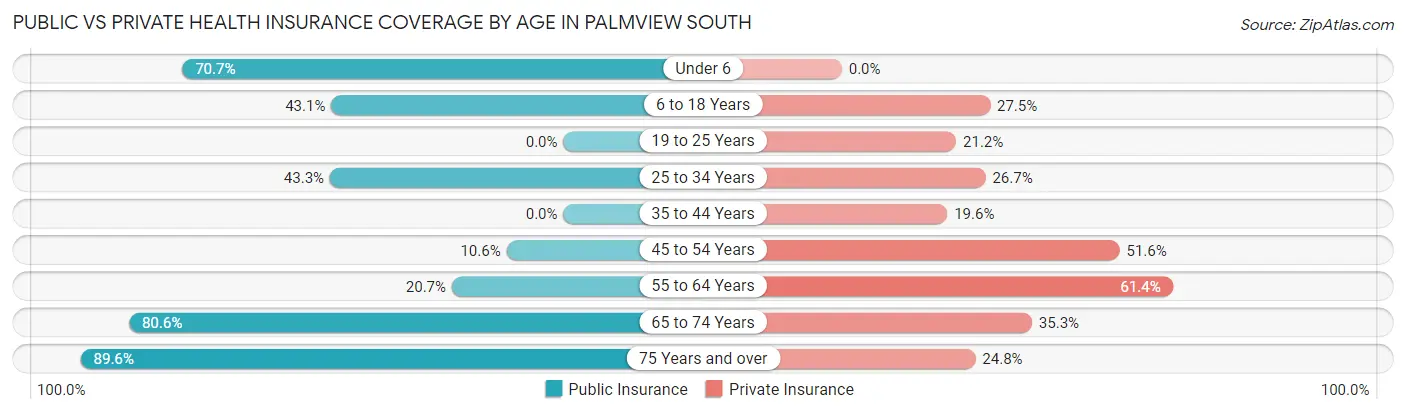
| Age Bracket | Public Insurance | Private Insurance |
| Under 6 | 87 (70.7%) | 0 (0.0%) |
| 6 to 18 Years | 252 (43.1%) | 161 (27.5%) |
| 19 to 25 Years | 0 (0.0%) | 59 (21.2%) |
| 25 to 34 Years | 39 (43.3%) | 24 (26.7%) |
| 35 to 44 Years | 0 (0.0%) | 36 (19.6%) |
| 45 to 54 Years | 34 (10.6%) | 166 (51.5%) |
| 55 to 64 Years | 30 (20.7%) | 89 (61.4%) |
| 65 to 74 Years | 233 (80.6%) | 102 (35.3%) |
| 75 Years and over | 112 (89.6%) | 31 (24.8%) |
| Total | 787 (36.8%) | 668 (31.2%) |
Disability Status by Sex by Age in Palmview South
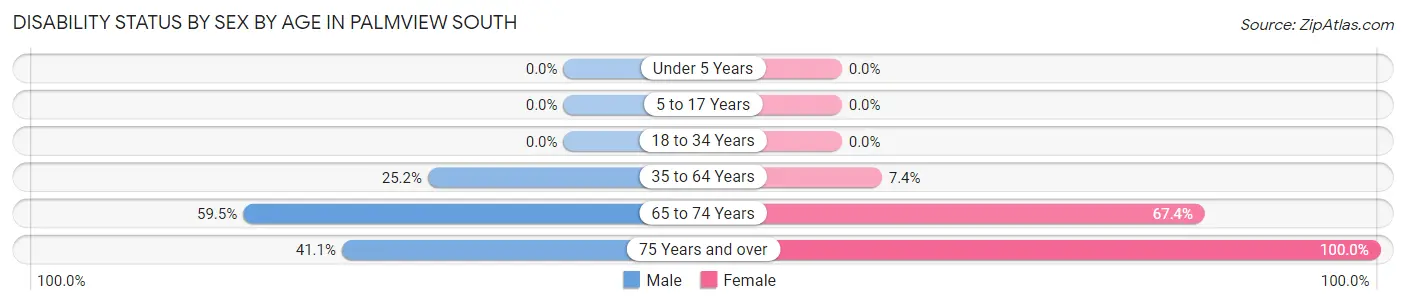
| Age Bracket | Male | Female |
| Under 5 Years | 0 (0.0%) | 0 (0.0%) |
| 5 to 17 Years | 0 (0.0%) | 0 (0.0%) |
| 18 to 34 Years | 0 (0.0%) | 0 (0.0%) |
| 35 to 64 Years | 79 (25.2%) | 25 (7.4%) |
| 65 to 74 Years | 88 (59.5%) | 95 (67.4%) |
| 75 Years and over | 44 (41.1%) | 18 (100.0%) |
Disability Class by Sex by Age in Palmview South
Disability Class: Hearing Difficulty
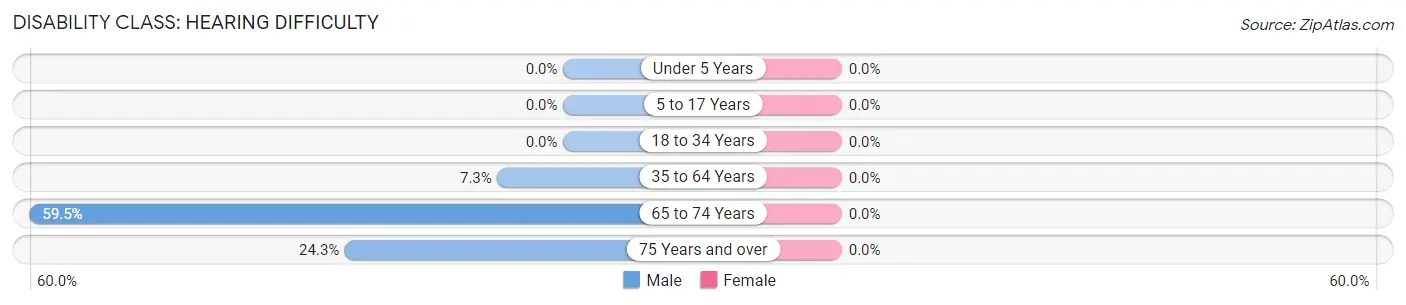
| Age Bracket | Male | Female |
| Under 5 Years | 0 (0.0%) | 0 (0.0%) |
| 5 to 17 Years | 0 (0.0%) | 0 (0.0%) |
| 18 to 34 Years | 0 (0.0%) | 0 (0.0%) |
| 35 to 64 Years | 23 (7.3%) | 0 (0.0%) |
| 65 to 74 Years | 88 (59.5%) | 0 (0.0%) |
| 75 Years and over | 26 (24.3%) | 0 (0.0%) |
Disability Class: Vision Difficulty
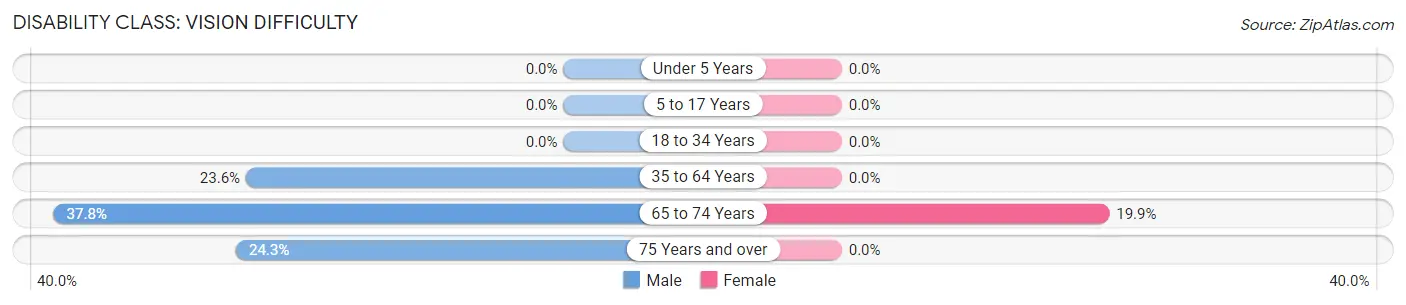
| Age Bracket | Male | Female |
| Under 5 Years | 0 (0.0%) | 0 (0.0%) |
| 5 to 17 Years | 0 (0.0%) | 0 (0.0%) |
| 18 to 34 Years | 0 (0.0%) | 0 (0.0%) |
| 35 to 64 Years | 74 (23.6%) | 0 (0.0%) |
| 65 to 74 Years | 56 (37.8%) | 28 (19.9%) |
| 75 Years and over | 26 (24.3%) | 0 (0.0%) |
Disability Class: Cognitive Difficulty
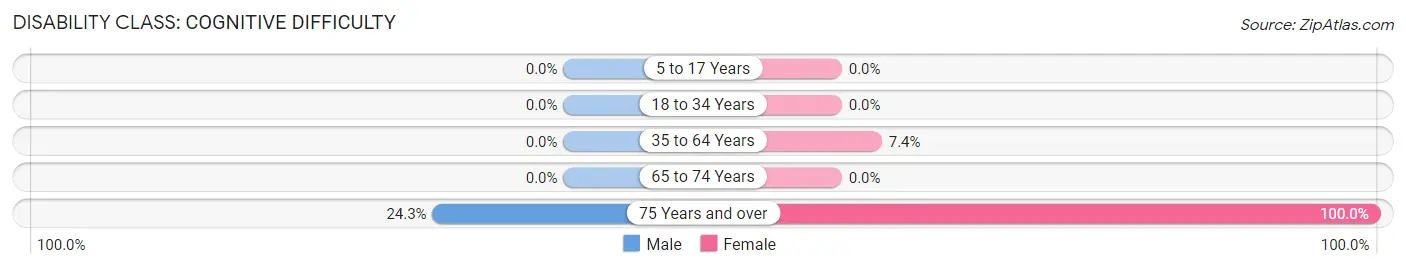
| Age Bracket | Male | Female |
| 5 to 17 Years | 0 (0.0%) | 0 (0.0%) |
| 18 to 34 Years | 0 (0.0%) | 0 (0.0%) |
| 35 to 64 Years | 0 (0.0%) | 25 (7.4%) |
| 65 to 74 Years | 0 (0.0%) | 0 (0.0%) |
| 75 Years and over | 26 (24.3%) | 18 (100.0%) |
Disability Class: Ambulatory Difficulty
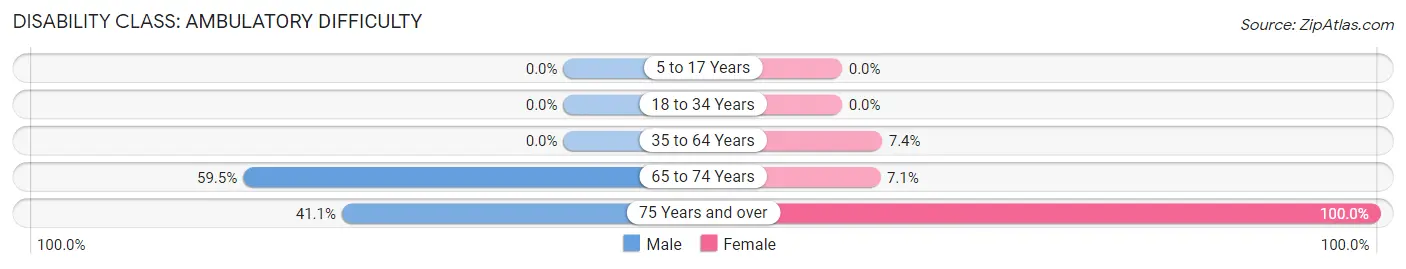
| Age Bracket | Male | Female |
| 5 to 17 Years | 0 (0.0%) | 0 (0.0%) |
| 18 to 34 Years | 0 (0.0%) | 0 (0.0%) |
| 35 to 64 Years | 0 (0.0%) | 25 (7.4%) |
| 65 to 74 Years | 88 (59.5%) | 10 (7.1%) |
| 75 Years and over | 44 (41.1%) | 18 (100.0%) |
Disability Class: Self-Care Difficulty
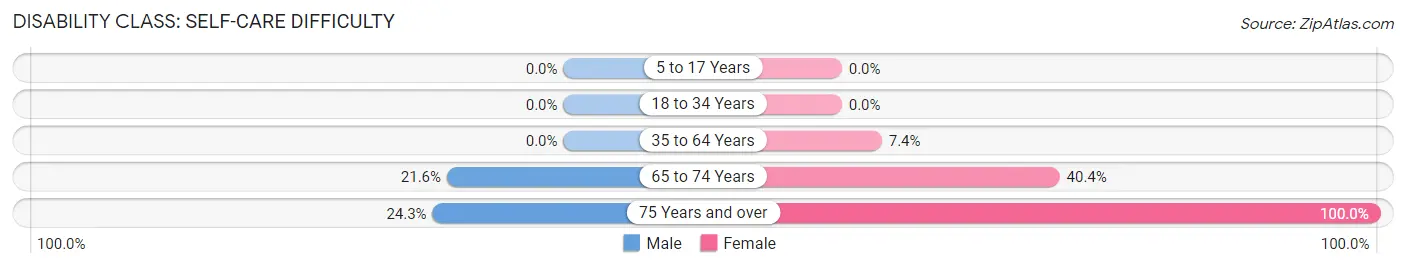
| Age Bracket | Male | Female |
| 5 to 17 Years | 0 (0.0%) | 0 (0.0%) |
| 18 to 34 Years | 0 (0.0%) | 0 (0.0%) |
| 35 to 64 Years | 0 (0.0%) | 25 (7.4%) |
| 65 to 74 Years | 32 (21.6%) | 57 (40.4%) |
| 75 Years and over | 26 (24.3%) | 18 (100.0%) |
Technology Access in Palmview South
Computing Device Access in Palmview South
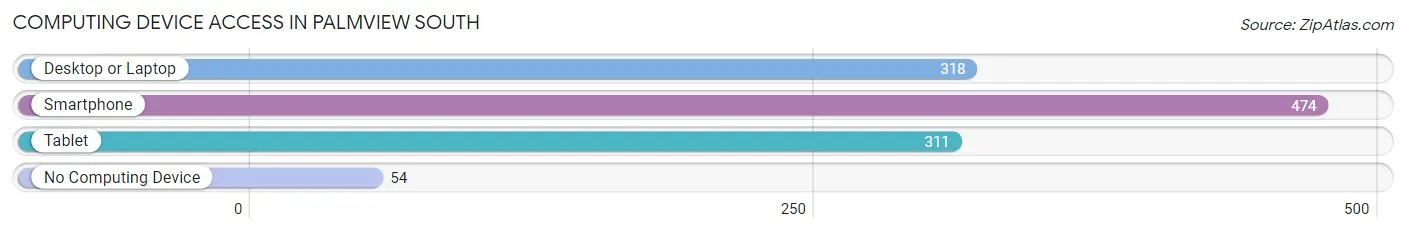
| Device Type | # Households | % Households |
| Desktop or Laptop | 318 | 57.3% |
| Smartphone | 474 | 85.4% |
| Tablet | 311 | 56.0% |
| No Computing Device | 54 | 9.7% |
| Total | 555 | 100.0% |
Internet Access in Palmview South
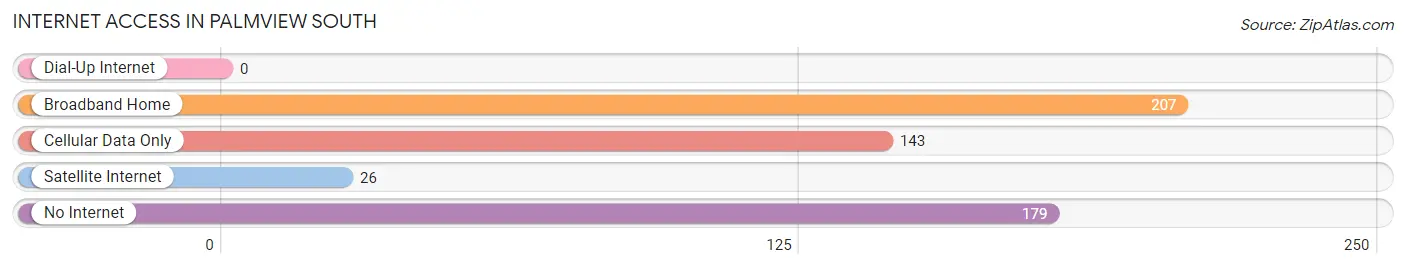
| Internet Type | # Households | % Households |
| Dial-Up Internet | 0 | 0.0% |
| Broadband Home | 207 | 37.3% |
| Cellular Data Only | 143 | 25.8% |
| Satellite Internet | 26 | 4.7% |
| No Internet | 179 | 32.3% |
| Total | 555 | 100.0% |
Palmview South Summary
Palmview South, Texas is a small city located in Hidalgo County, Texas. It is part of the McAllen-Edinburg-Mission Metropolitan Statistical Area. The city was incorporated in 2019 and is the newest city in Hidalgo County. As of the 2020 census, the population of Palmview South was estimated to be 8,845.
Geography
Palmview South is located in the Rio Grande Valley of South Texas, approximately 10 miles south of the city of McAllen. The city is bordered by the cities of Palmview, Mission, and La Joya. The city is situated on the western edge of the Rio Grande Valley, with the Rio Grande River forming the city’s eastern border. The city has a total area of 4.3 square miles, all of which is land.
Climate
Palmview South has a humid subtropical climate, with hot summers and mild winters. The average annual temperature is 73.2°F, with an average high of 92°F in July and an average low of 54°F in January. The average annual precipitation is 22.3 inches, with the wettest month being June, when an average of 5.3 inches of rain falls.
Demographics
As of the 2020 census, the population of Palmview South was estimated to be 8,845. The racial makeup of the city was 79.2% Hispanic or Latino, 16.2% White, 1.7% African American, 0.7% Native American, 0.3% Asian, and 2.1% from other races. The median household income was $37,945, and the median family income was $41,945.
Economy
The economy of Palmview South is largely based on agriculture and tourism. The city is home to several large farms, which produce a variety of crops, including cotton, corn, and sorghum. The city is also home to several tourist attractions, including the National Butterfly Center, the World Birding Center, and the Santa Ana National Wildlife Refuge.
The city is also home to several businesses, including restaurants, retail stores, and auto repair shops. The city is served by the Palmview South Municipal Airport, which provides general aviation services.
Conclusion
Palmview South, Texas is a small city located in Hidalgo County, Texas. It is part of the McAllen-Edinburg-Mission Metropolitan Statistical Area. The city was incorporated in 2019 and is the newest city in Hidalgo County. As of the 2020 census, the population of Palmview South was estimated to be 8,845. The city has a humid subtropical climate, with hot summers and mild winters. The racial makeup of the city was 79.2% Hispanic or Latino, 16.2% White, 1.7% African American, 0.7% Native American, 0.3% Asian, and 2.1% from other races. The median household income was $37,945, and the median family income was $41,945. The economy of Palmview South is largely based on agriculture and tourism. The city is home to several large farms, which produce a variety of crops, as well as several tourist attractions. The city is also home to several businesses, including restaurants, retail stores, and auto repair shops.
Common Questions
What is the Total Population of Palmview South?
Total Population of Palmview South is 2,141.
What is the Total Male Population of Palmview South?
Total Male Population of Palmview South is 1,138.
What is the Total Female Population of Palmview South?
Total Female Population of Palmview South is 1,003.
What is the Ratio of Males per 100 Females in Palmview South?
There are 113.46 Males per 100 Females in Palmview South.
What is the Ratio of Females per 100 Males in Palmview South?
There are 88.14 Females per 100 Males in Palmview South.
What is the Median Population Age in Palmview South?
Median Population Age in Palmview South is 34.9 Years.
What is the Average Family Size in Palmview South
Average Family Size in Palmview South is 4.7 People.
What is the Average Household Size in Palmview South
Average Household Size in Palmview South is 3.9 People.
What is Per Capita Income in Palmview South?
Per Capita income in Palmview South is $17,662.
What is the Median Family Income in Palmview South?
Median Family Income in Palmview South is $75,550.
What is Inequality or Gini Index in Palmview South?
Inequality or Gini Index in Palmview South is 0.53.
How Large is the Labor Force in Palmview South?
There are 717 People in the Labor Forcein in Palmview South.
What is the Percentage of People in the Labor Force in Palmview South?
46.6% of People are in the Labor Force in Palmview South.
What is the Unemployment Rate in Palmview South?
Unemployment Rate in Palmview South is 17.9%.