Cities with the Highest Percentage of Immigrants from South America in Texas
RELATED REPORTS & OPTIONS
South America
Texas
Compare Cities
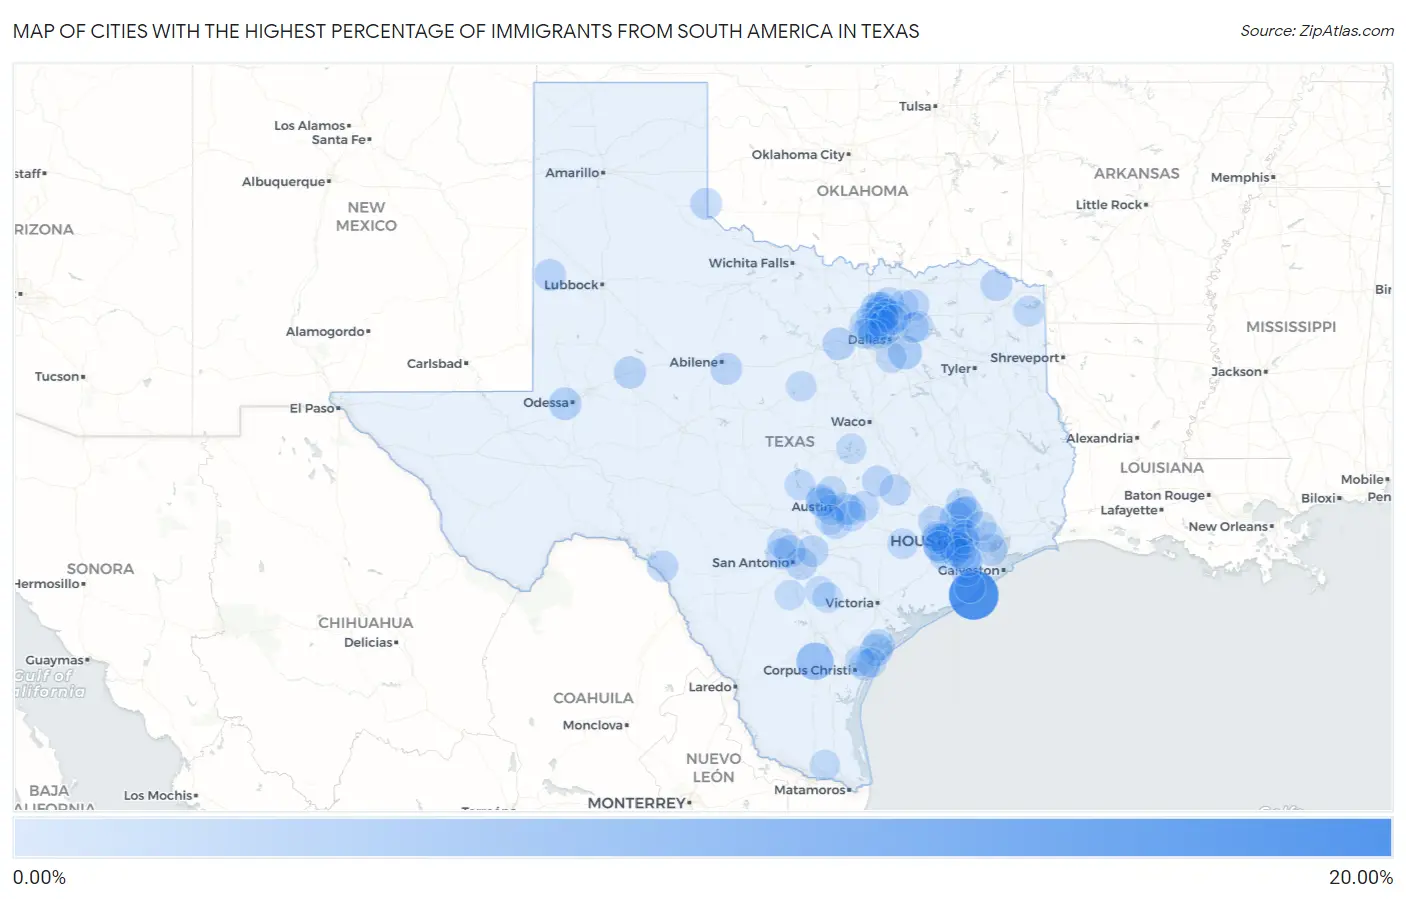
Map of Cities with the Highest Percentage of Immigrants from South America in Texas
0.00%
20.00%
Cities with the Highest Percentage of Immigrants from South America in Texas
| City | South America | vs State | vs National | |
| 1. | Quintana | 19.51% | 0.77%(+18.7)#-1 | 1.10%(+18.4)#0 |
| 2. | Amargosa | 7.69% | 0.77%(+6.92)#645 | 1.10%(+6.59)#2,821 |
| 3. | Center Point | 7.43% | 0.77%(+6.66)#652 | 1.10%(+6.33)#2,859 |
| 4. | Fulshear | 6.95% | 0.77%(+6.18)#785 | 1.10%(+5.85)#3,642 |
| 5. | Cinco Ranch | 6.09% | 0.77%(+5.32)#882 | 1.10%(+4.99)#4,372 |
| 6. | Combine | 4.56% | 0.77%(+3.79)#883 | 1.10%(+3.46)#4,373 |
| 7. | Tomball | 4.09% | 0.77%(+3.32)#884 | 1.10%(+2.99)#4,374 |
| 8. | Cross Roads | 4.08% | 0.77%(+3.31)#1,176 | 1.10%(+2.98)#7,645 |
| 9. | Hackberry | 3.56% | 0.77%(+2.79)#1,177 | 1.10%(+2.47)#7,646 |
| 10. | West Odessa | 3.44% | 0.77%(+2.67)#1,178 | 1.10%(+2.34)#7,647 |
| 11. | Fulton | 3.30% | 0.77%(+2.53)#1,179 | 1.10%(+2.21)#7,648 |
| 12. | The Woodlands | 3.21% | 0.77%(+2.44)#1,180 | 1.10%(+2.11)#7,649 |
| 13. | Annetta North | 3.18% | 0.77%(+2.41)#1,230 | 1.10%(+2.08)#8,484 |
| 14. | Mission Bend | 3.10% | 0.77%(+2.33)#1,231 | 1.10%(+2.00)#8,485 |
| 15. | Shoreacres | 3.09% | 0.77%(+2.32)#1,232 | 1.10%(+1.99)#8,486 |
| 16. | Sand Springs | 3.09% | 0.77%(+2.32)#1,233 | 1.10%(+1.99)#8,487 |
| 17. | Shenandoah | 3.07% | 0.77%(+2.30)#1,234 | 1.10%(+1.98)#8,488 |
| 18. | Addison | 3.01% | 0.77%(+2.24)#1,235 | 1.10%(+1.91)#8,489 |
| 19. | Shavano Park | 2.74% | 0.77%(+1.97)#1,236 | 1.10%(+1.64)#8,490 |
| 20. | Katy | 2.72% | 0.77%(+1.95)#1,237 | 1.10%(+1.62)#8,491 |
| 21. | Potosi | 2.72% | 0.77%(+1.95)#1,242 | 1.10%(+1.62)#8,701 |
| 22. | Morton | 2.67% | 0.77%(+1.90)#1,243 | 1.10%(+1.57)#8,702 |
| 23. | Rosenberg | 2.66% | 0.77%(+1.89)#1,244 | 1.10%(+1.56)#8,703 |
| 24. | China Grove | 2.65% | 0.77%(+1.88)#1,245 | 1.10%(+1.55)#8,704 |
| 25. | Bonney | 2.54% | 0.77%(+1.77)#1,246 | 1.10%(+1.44)#8,705 |
| 26. | Hornsby Bend | 2.52% | 0.77%(+1.75)#1,247 | 1.10%(+1.42)#8,706 |
| 27. | Annona | 2.46% | 0.77%(+1.69)#1,248 | 1.10%(+1.36)#8,707 |
| 28. | Dodson | 2.44% | 0.77%(+1.67)#1,249 | 1.10%(+1.34)#8,708 |
| 29. | Lamar | 2.44% | 0.77%(+1.67)#1,383 | 1.10%(+1.34)#12,081 |
| 30. | Santa Clara | 2.38% | 0.77%(+1.61)#1,384 | 1.10%(+1.29)#12,082 |
| 31. | Point Venture | 2.24% | 0.77%(+1.47)#1,397 | 1.10%(+1.14)#12,478 |
| 32. | Providence Village | 2.20% | 0.77%(+1.43)#1,398 | 1.10%(+1.11)#12,479 |
| 33. | Oak Point | 2.20% | 0.77%(+1.43)#1,399 | 1.10%(+1.10)#12,480 |
| 34. | Laughlin Afb | 2.20% | 0.77%(+1.43)#1,400 | 1.10%(+1.10)#12,481 |
| 35. | Arcola | 2.19% | 0.77%(+1.42)#1,401 | 1.10%(+1.09)#12,482 |
| 36. | Blue Ridge | 2.14% | 0.77%(+1.37)#1,402 | 1.10%(+1.04)#12,483 |
| 37. | Helotes | 2.13% | 0.77%(+1.36)#1,403 | 1.10%(+1.04)#12,484 |
| 38. | Jersey Village | 2.10% | 0.77%(+1.33)#1,404 | 1.10%(+1.00)#12,485 |
| 39. | Willow Grove | 2.06% | 0.77%(+1.29)#1,405 | 1.10%(+0.964)#12,486 |
| 40. | Ingleside On The Bay | 2.06% | 0.77%(+1.29)#1,406 | 1.10%(+0.964)#12,487 |
| 41. | Rockdale | 2.05% | 0.77%(+1.28)#1,407 | 1.10%(+0.948)#12,488 |
| 42. | Paloma Creek South | 2.04% | 0.77%(+1.27)#1,408 | 1.10%(+0.947)#12,489 |
| 43. | Caldwell | 2.01% | 0.77%(+1.24)#1,409 | 1.10%(+0.916)#12,490 |
| 44. | Pine Island | 1.99% | 0.77%(+1.22)#1,410 | 1.10%(+0.889)#12,491 |
| 45. | Bee Cave | 1.95% | 0.77%(+1.18)#1,411 | 1.10%(+0.851)#12,492 |
| 46. | Rockwell Place | 1.94% | 0.77%(+1.17)#1,412 | 1.10%(+0.842)#12,493 |
| 47. | Royse City | 1.87% | 0.77%(+1.10)#1,413 | 1.10%(+0.769)#12,494 |
| 48. | Allen | 1.73% | 0.77%(+0.964)#1,414 | 1.10%(+0.636)#12,495 |
| 49. | Celina | 1.73% | 0.77%(+0.955)#1,415 | 1.10%(+0.627)#12,496 |
| 50. | Douglassville | 1.72% | 0.77%(+0.954)#1,416 | 1.10%(+0.626)#12,497 |
| 51. | Clute | 1.72% | 0.77%(+0.945)#1,417 | 1.10%(+0.617)#12,498 |
| 52. | Houston | 1.70% | 0.77%(+0.932)#1,418 | 1.10%(+0.604)#12,499 |
| 53. | Meadows Place | 1.70% | 0.77%(+0.925)#1,419 | 1.10%(+0.597)#12,500 |
| 54. | Columbus | 1.68% | 0.77%(+0.912)#1,420 | 1.10%(+0.584)#12,501 |
| 55. | Bellaire | 1.67% | 0.77%(+0.896)#1,421 | 1.10%(+0.568)#12,502 |
| 56. | Niederwald | 1.65% | 0.77%(+0.876)#1,422 | 1.10%(+0.548)#12,503 |
| 57. | Sugar Land | 1.63% | 0.77%(+0.864)#1,423 | 1.10%(+0.536)#12,504 |
| 58. | Red Oak | 1.63% | 0.77%(+0.859)#1,424 | 1.10%(+0.531)#12,505 |
| 59. | Conroe | 1.63% | 0.77%(+0.855)#1,425 | 1.10%(+0.527)#12,506 |
| 60. | Grapevine | 1.63% | 0.77%(+0.855)#1,426 | 1.10%(+0.527)#12,507 |
| 61. | Webberville | 1.61% | 0.77%(+0.839)#1,427 | 1.10%(+0.511)#12,508 |
| 62. | Seis Lagos | 1.61% | 0.77%(+0.837)#1,428 | 1.10%(+0.509)#12,509 |
| 63. | Mcdade | 1.61% | 0.77%(+0.837)#1,429 | 1.10%(+0.509)#12,510 |
| 64. | Granite Shoals | 1.57% | 0.77%(+0.799)#1,430 | 1.10%(+0.471)#12,511 |
| 65. | Fate | 1.57% | 0.77%(+0.797)#1,431 | 1.10%(+0.469)#12,512 |
| 66. | Farmers Branch | 1.54% | 0.77%(+0.769)#1,432 | 1.10%(+0.441)#12,513 |
| 67. | Brookshire | 1.50% | 0.77%(+0.734)#1,433 | 1.10%(+0.405)#12,514 |
| 68. | Highlands | 1.47% | 0.77%(+0.697)#1,434 | 1.10%(+0.369)#12,515 |
| 69. | Falls City | 1.44% | 0.77%(+0.674)#1,435 | 1.10%(+0.346)#12,516 |
| 70. | Laguna Seca | 1.44% | 0.77%(+0.674)#1,436 | 1.10%(+0.346)#12,517 |
| 71. | Frisco | 1.43% | 0.77%(+0.661)#1,437 | 1.10%(+0.333)#12,518 |
| 72. | Spring Valley Village | 1.42% | 0.77%(+0.651)#1,438 | 1.10%(+0.323)#12,519 |
| 73. | Karnes City | 1.41% | 0.77%(+0.643)#1,439 | 1.10%(+0.315)#12,520 |
| 74. | Scenic Oaks | 1.40% | 0.77%(+0.631)#1,440 | 1.10%(+0.303)#12,521 |
| 75. | Pattison | 1.38% | 0.77%(+0.606)#1,441 | 1.10%(+0.278)#12,522 |
| 76. | Wyldwood | 1.37% | 0.77%(+0.603)#1,442 | 1.10%(+0.275)#12,523 |
| 77. | Dublin | 1.35% | 0.77%(+0.584)#1,443 | 1.10%(+0.256)#12,524 |
| 78. | Lantana | 1.33% | 0.77%(+0.562)#1,444 | 1.10%(+0.234)#12,525 |
| 79. | Weston Lakes | 1.28% | 0.77%(+0.510)#1,445 | 1.10%(+0.181)#12,526 |
| 80. | Portland | 1.27% | 0.77%(+0.497)#1,446 | 1.10%(+0.168)#12,527 |
| 81. | Lakeway | 1.26% | 0.77%(+0.488)#1,447 | 1.10%(+0.160)#12,528 |
| 82. | Roanoke | 1.25% | 0.77%(+0.484)#1,448 | 1.10%(+0.156)#12,529 |
| 83. | Melissa | 1.25% | 0.77%(+0.483)#1,449 | 1.10%(+0.155)#12,530 |
| 84. | Sunset Valley | 1.25% | 0.77%(+0.475)#1,450 | 1.10%(+0.147)#12,531 |
| 85. | Morgan S Point Resort | 1.24% | 0.77%(+0.474)#1,451 | 1.10%(+0.146)#12,532 |
| 86. | Jourdanton | 1.23% | 0.77%(+0.462)#1,452 | 1.10%(+0.134)#12,533 |
| 87. | Southlake | 1.20% | 0.77%(+0.425)#1,453 | 1.10%(+0.097)#12,534 |
| 88. | Irving | 1.19% | 0.77%(+0.421)#1,454 | 1.10%(+0.093)#12,535 |
| 89. | Lewisville | 1.19% | 0.77%(+0.417)#1,455 | 1.10%(+0.089)#12,536 |
| 90. | The Colony | 1.19% | 0.77%(+0.417)#1,456 | 1.10%(+0.088)#12,537 |
| 91. | Carrollton | 1.17% | 0.77%(+0.405)#1,457 | 1.10%(+0.076)#12,538 |
| 92. | Iowa Colony | 1.17% | 0.77%(+0.398)#1,458 | 1.10%(+0.070)#12,539 |
| 93. | North Richland Hills | 1.17% | 0.77%(+0.395)#1,459 | 1.10%(+0.067)#12,540 |
| 94. | Aransas Pass | 1.16% | 0.77%(+0.388)#1,460 | 1.10%(+0.060)#12,541 |
| 95. | Atascocita | 1.16% | 0.77%(+0.385)#1,461 | 1.10%(+0.057)#12,542 |
| 96. | Cedar Park | 1.14% | 0.77%(+0.369)#1,462 | 1.10%(+0.041)#12,543 |
| 97. | Plano | 1.14% | 0.77%(+0.367)#1,463 | 1.10%(+0.039)#12,544 |
| 98. | Buda | 1.13% | 0.77%(+0.357)#1,464 | 1.10%(+0.029)#12,545 |
| 99. | Euless | 1.13% | 0.77%(+0.356)#1,465 | 1.10%(+0.028)#12,546 |
| 100. | Missouri City | 1.11% | 0.77%(+0.344)#1,466 | 1.10%(+0.016)#12,547 |
Common Questions
What are the Top 10 Cities with the Highest Percentage of Immigrants from South America in Texas?
Top 10 Cities with the Highest Percentage of Immigrants from South America in Texas are:
#1
19.51%
#2
7.69%
#3
6.95%
#4
6.09%
#5
4.56%
#6
4.09%
#7
4.08%
#8
3.56%
#9
3.44%
#10
3.30%
What city has the Highest Percentage of Immigrants from South America in Texas?
Quintana has the Highest Percentage of Immigrants from South America in Texas with 19.51%.
What is the Percentage of Immigrants from South America in the State of Texas?
Percentage of Immigrants from South America in Texas is 0.77%.
What is the Percentage of Immigrants from South America in the United States?
Percentage of Immigrants from South America in the United States is 1.10%.