Cities with the Highest Male Poverty Level in Texas
RELATED REPORTS & OPTIONS
Highest Poverty | Male
Texas
Compare Cities
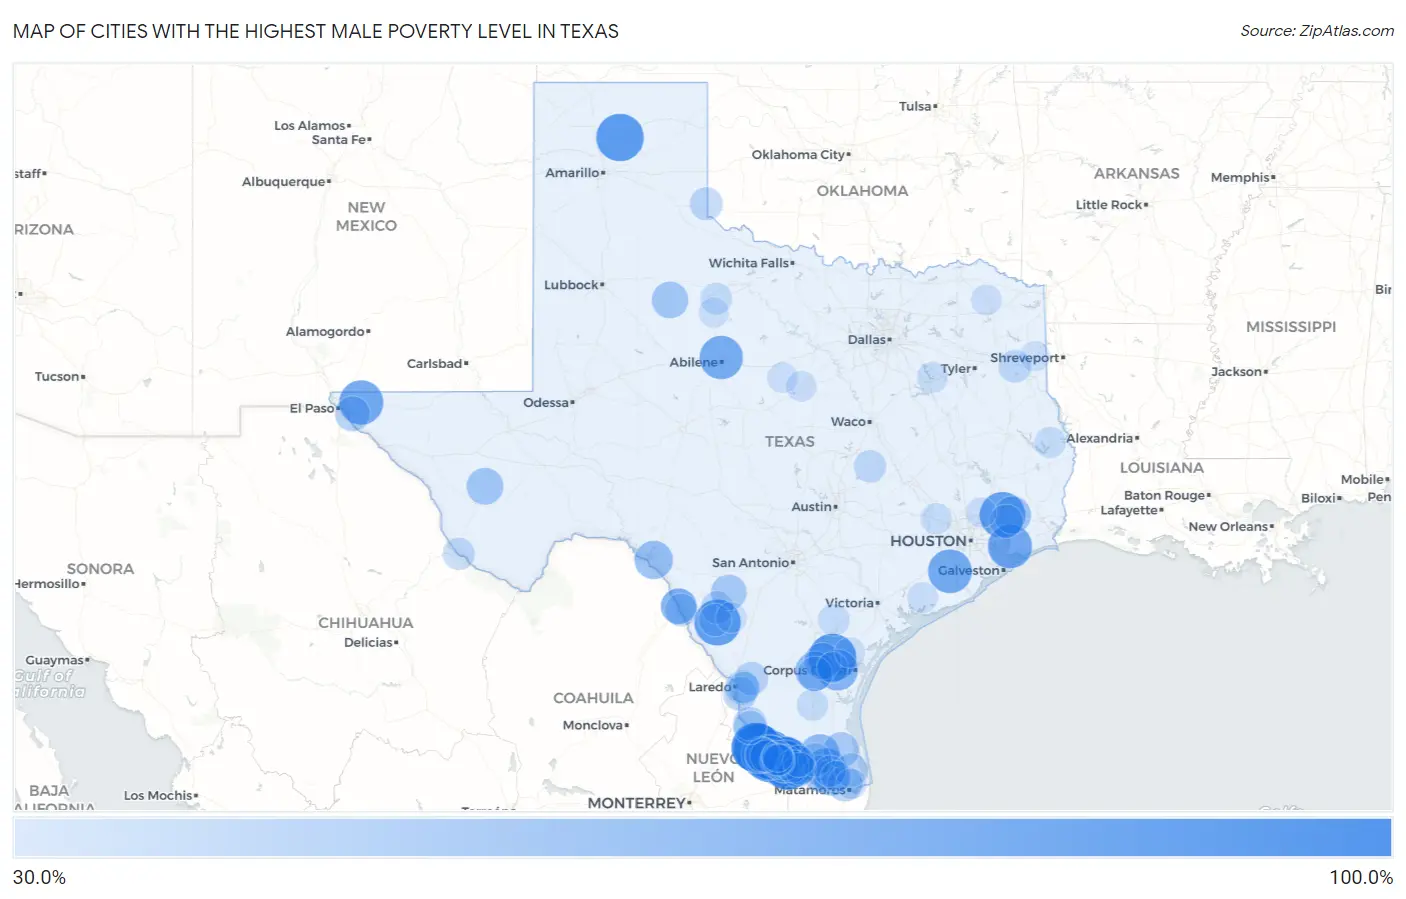
Map of Cities with the Highest Male Poverty Level in Texas
0.0%
100.0%
Cities with the Highest Male Poverty Level in Texas
| City | Male Poverty | vs State | vs National | |
| 1. | Hilltop Cdp Starr County | 100.0% | 12.6%(+87.4)#1 | 11.3%(+88.7)#12 |
| 2. | La Esperanza | 100.0% | 12.6%(+87.4)#2 | 11.3%(+88.7)#13 |
| 3. | North Escobares | 100.0% | 12.6%(+87.4)#3 | 11.3%(+88.7)#16 |
| 4. | El Castillo | 100.0% | 12.6%(+87.4)#4 | 11.3%(+88.7)#27 |
| 5. | El Quiote | 100.0% | 12.6%(+87.4)#5 | 11.3%(+88.7)#33 |
| 6. | Quesada | 100.0% | 12.6%(+87.4)#6 | 11.3%(+88.7)#52 |
| 7. | La Loma De Falcon | 100.0% | 12.6%(+87.4)#7 | 11.3%(+88.7)#61 |
| 8. | Normandy | 100.0% | 12.6%(+87.4)#8 | 11.3%(+88.7)#65 |
| 9. | Los Ebanos Cdp Hidalgo County | 100.0% | 12.6%(+87.4)#9 | 11.3%(+88.7)#67 |
| 10. | Acala | 100.0% | 12.6%(+87.4)#10 | 11.3%(+88.7)#83 |
| 11. | Clay | 100.0% | 12.6%(+87.4)#11 | 11.3%(+88.7)#97 |
| 12. | Chapeno | 100.0% | 12.6%(+87.4)#12 | 11.3%(+88.7)#100 |
| 13. | Sandy Hollow Escondidas | 93.9% | 12.6%(+81.4)#13 | 11.3%(+82.6)#128 |
| 14. | Sanford | 93.2% | 12.6%(+80.7)#14 | 11.3%(+81.9)#131 |
| 15. | Carrizo Hill | 89.3% | 12.6%(+76.7)#15 | 11.3%(+78.0)#148 |
| 16. | Campo Verde | 88.7% | 12.6%(+76.1)#16 | 11.3%(+77.3)#151 |
| 17. | Eugenio Saenz | 88.0% | 12.6%(+75.4)#17 | 11.3%(+76.6)#153 |
| 18. | Dayton Lakes | 87.8% | 12.6%(+75.2)#18 | 11.3%(+76.5)#154 |
| 19. | Butterfield | 83.0% | 12.6%(+70.5)#19 | 11.3%(+71.7)#179 |
| 20. | Oak Island | 82.5% | 12.6%(+69.9)#20 | 11.3%(+71.1)#182 |
| 21. | Barrera | 82.2% | 12.6%(+69.6)#21 | 11.3%(+70.9)#184 |
| 22. | Damon | 81.1% | 12.6%(+68.6)#22 | 11.3%(+69.8)#195 |
| 23. | Impact | 80.0% | 12.6%(+67.4)#23 | 11.3%(+68.7)#202 |
| 24. | Mcleod | 77.8% | 12.6%(+65.2)#24 | 11.3%(+66.4)#212 |
| 25. | El Socio | 76.2% | 12.6%(+63.6)#25 | 11.3%(+64.8)#229 |
| 26. | Briggs | 75.6% | 12.6%(+63.0)#26 | 11.3%(+64.2)#237 |
| 27. | Indian Hills | 72.3% | 12.6%(+59.7)#27 | 11.3%(+61.0)#281 |
| 28. | Tierra Verde | 71.9% | 12.6%(+59.3)#28 | 11.3%(+60.6)#287 |
| 29. | Hargill | 67.5% | 12.6%(+55.0)#29 | 11.3%(+56.2)#350 |
| 30. | Rancho Alegre | 67.1% | 12.6%(+54.5)#30 | 11.3%(+55.7)#355 |
| 31. | Bledsoe | 66.7% | 12.6%(+54.1)#31 | 11.3%(+55.3)#361 |
| 32. | Salineno North | 66.7% | 12.6%(+54.1)#32 | 11.3%(+55.3)#363 |
| 33. | Lake View | 64.0% | 12.6%(+51.4)#33 | 11.3%(+52.7)#404 |
| 34. | Salida Del Sol Estates | 61.0% | 12.6%(+48.4)#34 | 11.3%(+49.7)#471 |
| 35. | Hull | 60.4% | 12.6%(+47.9)#35 | 11.3%(+49.1)#485 |
| 36. | Fronton | 59.4% | 12.6%(+46.8)#36 | 11.3%(+48.0)#523 |
| 37. | South La Paloma | 59.2% | 12.6%(+46.6)#37 | 11.3%(+47.9)#530 |
| 38. | Fort Davis | 59.1% | 12.6%(+46.6)#38 | 11.3%(+47.8)#535 |
| 39. | Villa Verde | 59.0% | 12.6%(+46.5)#39 | 11.3%(+47.7)#542 |
| 40. | Girard | 58.3% | 12.6%(+45.8)#40 | 11.3%(+47.0)#559 |
| 41. | Abram | 57.5% | 12.6%(+45.0)#41 | 11.3%(+46.2)#575 |
| 42. | Bluetown | 57.0% | 12.6%(+44.4)#42 | 11.3%(+45.6)#588 |
| 43. | Seco Mines | 56.0% | 12.6%(+43.5)#43 | 11.3%(+44.7)#623 |
| 44. | Batesville | 55.7% | 12.6%(+43.1)#44 | 11.3%(+44.3)#638 |
| 45. | Ramos | 55.6% | 12.6%(+43.0)#45 | 11.3%(+44.2)#643 |
| 46. | Alto Bonito Heights | 55.5% | 12.6%(+42.9)#46 | 11.3%(+44.1)#648 |
| 47. | San Perlita | 55.0% | 12.6%(+42.4)#47 | 11.3%(+43.7)#663 |
| 48. | Fabrica | 54.8% | 12.6%(+42.2)#48 | 11.3%(+43.4)#674 |
| 49. | El Refugio | 54.3% | 12.6%(+41.7)#49 | 11.3%(+42.9)#689 |
| 50. | San Pedro | 53.6% | 12.6%(+41.1)#50 | 11.3%(+42.3)#710 |
| 51. | Sparks | 53.4% | 12.6%(+40.8)#51 | 11.3%(+42.0)#719 |
| 52. | Garza Salinas Ii | 51.8% | 12.6%(+39.2)#52 | 11.3%(+40.4)#781 |
| 53. | Alice Acres | 51.7% | 12.6%(+39.2)#53 | 11.3%(+40.4)#785 |
| 54. | San Carlos I | 51.5% | 12.6%(+38.9)#54 | 11.3%(+40.1)#795 |
| 55. | La Presa | 49.6% | 12.6%(+37.0)#55 | 11.3%(+38.3)#902 |
| 56. | La Tina Ranch | 49.2% | 12.6%(+36.6)#56 | 11.3%(+37.8)#919 |
| 57. | Ranchitos Las Lomas | 49.2% | 12.6%(+36.6)#57 | 11.3%(+37.8)#920 |
| 58. | Medina | 48.9% | 12.6%(+36.4)#58 | 11.3%(+37.6)#932 |
| 59. | Evergreen | 48.9% | 12.6%(+36.3)#59 | 11.3%(+37.5)#935 |
| 60. | Doolittle | 48.6% | 12.6%(+36.1)#60 | 11.3%(+37.3)#945 |
| 61. | Lopeno | 48.6% | 12.6%(+36.0)#61 | 11.3%(+37.2)#948 |
| 62. | Siesta Shores | 48.5% | 12.6%(+36.0)#62 | 11.3%(+37.2)#950 |
| 63. | Ames | 48.5% | 12.6%(+35.9)#63 | 11.3%(+37.1)#955 |
| 64. | Dodson | 47.4% | 12.6%(+34.8)#64 | 11.3%(+36.0)#1,021 |
| 65. | Loma Grande | 46.8% | 12.6%(+34.3)#65 | 11.3%(+35.5)#1,051 |
| 66. | Las Quintas Fronterizas | 46.1% | 12.6%(+33.5)#66 | 11.3%(+34.8)#1,099 |
| 67. | Easton | 46.0% | 12.6%(+33.5)#67 | 11.3%(+34.7)#1,104 |
| 68. | Havana | 45.8% | 12.6%(+33.2)#68 | 11.3%(+34.4)#1,119 |
| 69. | Carrizo Springs | 45.4% | 12.6%(+32.8)#69 | 11.3%(+34.0)#1,137 |
| 70. | Buckholts | 45.2% | 12.6%(+32.7)#70 | 11.3%(+33.9)#1,147 |
| 71. | Presidio | 44.7% | 12.6%(+32.1)#71 | 11.3%(+33.3)#1,176 |
| 72. | Palmview South | 44.0% | 12.6%(+31.5)#72 | 11.3%(+32.7)#1,222 |
| 73. | Escobares | 43.9% | 12.6%(+31.3)#73 | 11.3%(+32.5)#1,230 |
| 74. | O Brien | 42.9% | 12.6%(+30.3)#74 | 11.3%(+31.5)#1,306 |
| 75. | Normanna | 42.9% | 12.6%(+30.3)#75 | 11.3%(+31.5)#1,310 |
| 76. | Ranchitos East | 42.7% | 12.6%(+30.2)#76 | 11.3%(+31.4)#1,317 |
| 77. | Citrus City | 42.6% | 12.6%(+30.1)#77 | 11.3%(+31.3)#1,320 |
| 78. | Falfurrias | 42.6% | 12.6%(+30.0)#78 | 11.3%(+31.2)#1,327 |
| 79. | Chula Vista Cdp Zavala County | 42.6% | 12.6%(+30.0)#79 | 11.3%(+31.2)#1,333 |
| 80. | Santa Rosa | 42.2% | 12.6%(+29.7)#80 | 11.3%(+30.9)#1,360 |
| 81. | Solis | 42.2% | 12.6%(+29.7)#81 | 11.3%(+30.9)#1,363 |
| 82. | Pineland | 42.0% | 12.6%(+29.4)#82 | 11.3%(+30.6)#1,380 |
| 83. | Camargito | 41.7% | 12.6%(+29.1)#83 | 11.3%(+30.3)#1,402 |
| 84. | Prairie View | 41.6% | 12.6%(+29.1)#84 | 11.3%(+30.3)#1,414 |
| 85. | El Rancho Vela | 41.4% | 12.6%(+28.9)#85 | 11.3%(+30.1)#1,434 |
| 86. | Caney City | 40.9% | 12.6%(+28.3)#86 | 11.3%(+29.6)#1,489 |
| 87. | Big Wells | 40.5% | 12.6%(+27.9)#87 | 11.3%(+29.1)#1,536 |
| 88. | Banquete | 40.5% | 12.6%(+27.9)#88 | 11.3%(+29.1)#1,538 |
| 89. | Blessing | 40.2% | 12.6%(+27.6)#89 | 11.3%(+28.8)#1,556 |
| 90. | Gorman | 40.1% | 12.6%(+27.5)#90 | 11.3%(+28.8)#1,562 |
| 91. | Talco | 40.1% | 12.6%(+27.5)#91 | 11.3%(+28.7)#1,565 |
| 92. | Rangerville | 40.0% | 12.6%(+27.4)#92 | 11.3%(+28.7)#1,571 |
| 93. | Dublin | 39.9% | 12.6%(+27.3)#93 | 11.3%(+28.5)#1,590 |
| 94. | Rancho Chico | 39.4% | 12.6%(+26.8)#94 | 11.3%(+28.1)#1,631 |
| 95. | Woodbranch | 39.4% | 12.6%(+26.8)#95 | 11.3%(+28.0)#1,632 |
| 96. | Cameron Park | 39.4% | 12.6%(+26.8)#96 | 11.3%(+28.0)#1,634 |
| 97. | Rule | 39.2% | 12.6%(+26.6)#97 | 11.3%(+27.8)#1,653 |
| 98. | Rosanky | 38.8% | 12.6%(+26.3)#98 | 11.3%(+27.5)#1,693 |
| 99. | Scottsville | 38.7% | 12.6%(+26.2)#99 | 11.3%(+27.4)#1,706 |
| 100. | The Homesteads | 38.7% | 12.6%(+26.1)#100 | 11.3%(+27.3)#1,718 |
Common Questions
What are the Top 10 Cities with the Highest Male Poverty Level in Texas?
Top 10 Cities with the Highest Male Poverty Level in Texas are:
#1
100.0%
#2
100.0%
#3
100.0%
#4
100.0%
#5
100.0%
#6
100.0%
#7
100.0%
#8
93.9%
#9
93.2%
#10
89.3%
What city has the Highest Male Poverty Level in Texas?
La Esperanza has the Highest Male Poverty Level in Texas with 100.0%.
What is the Poverty Level Among Males in the State of Texas?
Poverty Level Among Males in Texas is 12.6%.
What is the Poverty Level Among Males in the United States?
Poverty Level Among Males in the United States is 11.3%.