Zip Codes with the Highest Percentage of Population with a Degree in Visual and Performing Arts in Weatherford, TX
RELATED REPORTS & OPTIONS
Visual and Performing Arts
Weatherford
Compare Zip Codes
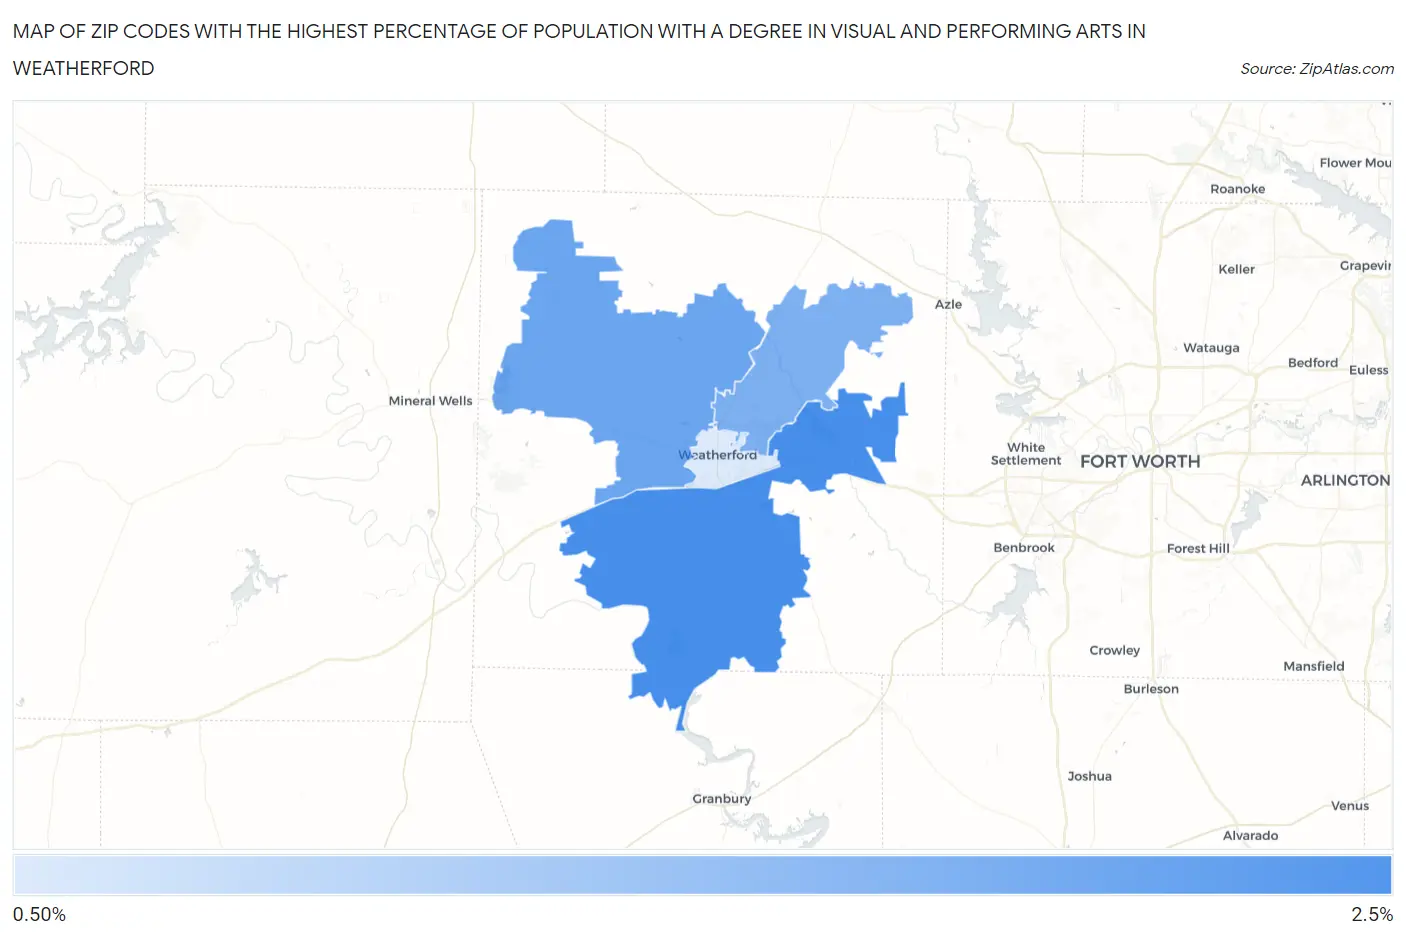
Map of Zip Codes with the Highest Percentage of Population with a Degree in Visual and Performing Arts in Weatherford
0.0%
2.5%
Zip Codes with the Highest Percentage of Population with a Degree in Visual and Performing Arts in Weatherford, TX
| Zip Code | % Graduates | vs State | vs National | |
| 1. | 76087 | 2.3% | 3.2%(-0.888)#775 | 4.3%(-1.93)#15,293 |
| 2. | 76088 | 2.0% | 3.2%(-1.21)#868 | 4.3%(-2.25)#16,447 |
| 3. | 76085 | 1.9% | 3.2%(-1.35)#903 | 4.3%(-2.40)#16,933 |
| 4. | 76086 | 0.98% | 3.2%(-2.23)#1,102 | 4.3%(-3.27)#19,712 |
1
Common Questions
What are the Top 3 Zip Codes with the Highest Percentage of Population with a Degree in Visual and Performing Arts in Weatherford, TX?
Top 3 Zip Codes with the Highest Percentage of Population with a Degree in Visual and Performing Arts in Weatherford, TX are:
What zip code has the Highest Percentage of Population with a Degree in Visual and Performing Arts in Weatherford, TX?
76087 has the Highest Percentage of Population with a Degree in Visual and Performing Arts in Weatherford, TX with 2.3%.
What is the Percentage of Population with a Degree in Visual and Performing Arts in Weatherford, TX?
Percentage of Population with a Degree in Visual and Performing Arts in Weatherford is 0.93%.
What is the Percentage of Population with a Degree in Visual and Performing Arts in Texas?
Percentage of Population with a Degree in Visual and Performing Arts in Texas is 3.2%.
What is the Percentage of Population with a Degree in Visual and Performing Arts in the United States?
Percentage of Population with a Degree in Visual and Performing Arts in the United States is 4.3%.