Redwood, TX
Redwood Map
Redwood Overview
3,423
TOTAL POPULATION
1,921
MALE POPULATION
1,502
FEMALE POPULATION
127.90
MALES / 100 FEMALES
78.19
FEMALES / 100 MALES
40.2
MEDIAN AGE
3.8
AVG FAMILY SIZE
3.3
AVG HOUSEHOLD SIZE
$25,593
PER CAPITA INCOME
$77,273
AVG FAMILY INCOME
$69,132
AVG HOUSEHOLD INCOME
33.2%
WAGE / INCOME GAP [ % ]
66.8¢/ $1
WAGE / INCOME GAP [ $ ]
0.31
INEQUALITY / GINI INDEX
2,036
LABOR FORCE [ PEOPLE ]
71.2%
PERCENT IN LABOR FORCE
6.7%
UNEMPLOYMENT RATE
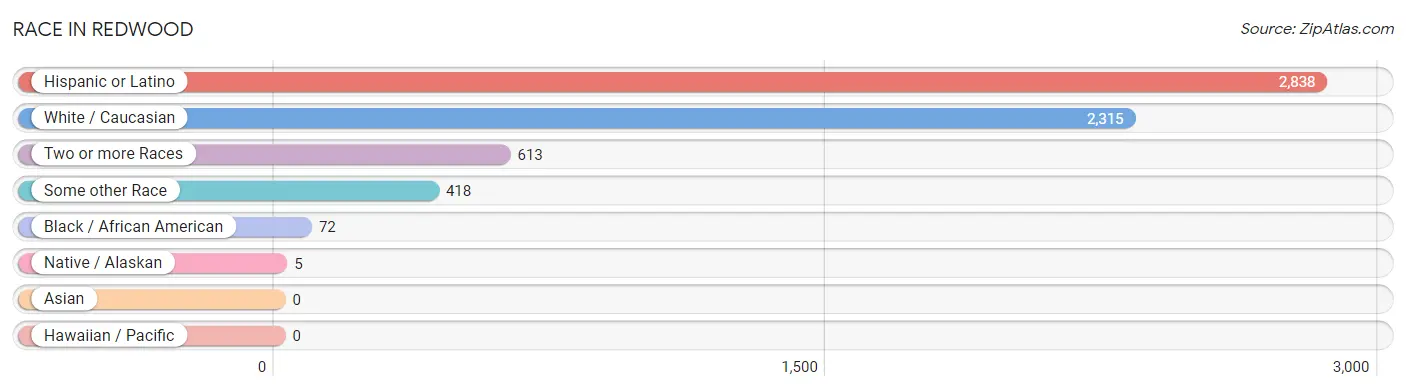
Race in Redwood
The most populous races in Redwood are Hispanic or Latino (2,838 | 82.9%), White / Caucasian (2,315 | 67.6%), and Two or more Races (613 | 17.9%).
| Race | # Population | % Population |
| Asian | 0 | 0.0% |
| Black / African American | 72 | 2.1% |
| Hawaiian / Pacific | 0 | 0.0% |
| Hispanic or Latino | 2,838 | 82.9% |
| Native / Alaskan | 5 | 0.2% |
| White / Caucasian | 2,315 | 67.6% |
| Two or more Races | 613 | 17.9% |
| Some other Race | 418 | 12.2% |
| Total | 3,423 | 100.0% |
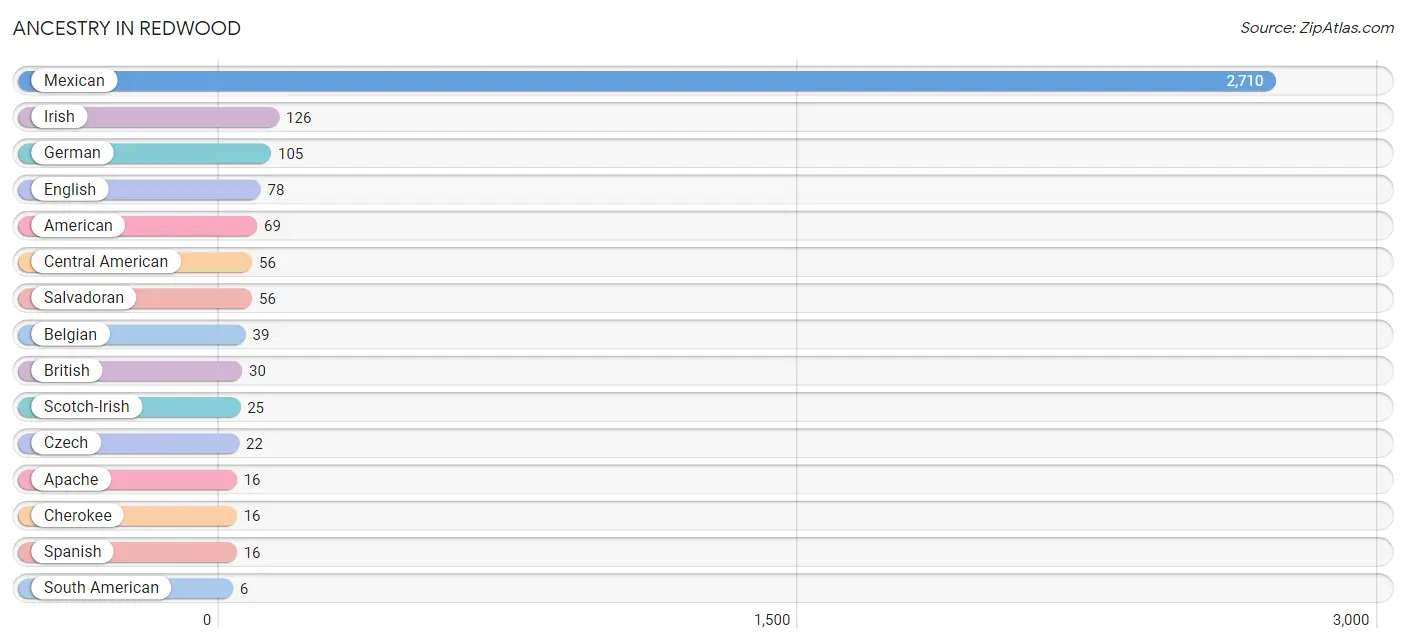
Ancestry in Redwood
The most populous ancestries reported in Redwood are Mexican (2,710 | 79.2%), Irish (126 | 3.7%), German (105 | 3.1%), English (78 | 2.3%), and American (69 | 2.0%), together accounting for 90.2% of all Redwood residents.
| Ancestry | # Population | % Population |
| American | 69 | 2.0% |
| Apache | 16 | 0.5% |
| Belgian | 39 | 1.1% |
| British | 30 | 0.9% |
| Central American | 56 | 1.6% |
| Cherokee | 16 | 0.5% |
| Czech | 22 | 0.6% |
| English | 78 | 2.3% |
| German | 105 | 3.1% |
| Irish | 126 | 3.7% |
| Mexican | 2,710 | 79.2% |
| Salvadoran | 56 | 1.6% |
| Scotch-Irish | 25 | 0.7% |
| South American | 6 | 0.2% |
| Spanish | 16 | 0.5% |
| Venezuelan | 6 | 0.2% | View All 16 Rows |
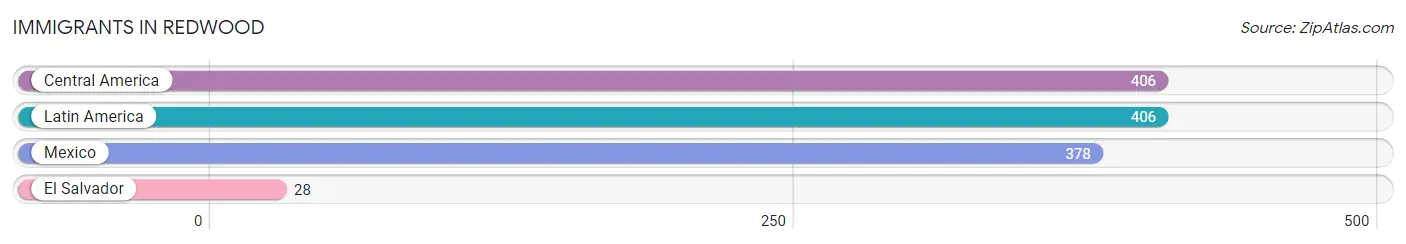
Immigrants in Redwood
The most numerous immigrant groups reported in Redwood came from Central America (406 | 11.9%), Latin America (406 | 11.9%), Mexico (378 | 11.0%), and El Salvador (28 | 0.8%), together accounting for 35.6% of all Redwood residents.
| Immigration Origin | # Population | % Population |
| Central America | 406 | 11.9% |
| El Salvador | 28 | 0.8% |
| Latin America | 406 | 11.9% |
| Mexico | 378 | 11.0% | View All 4 Rows |
Sex and Age in Redwood
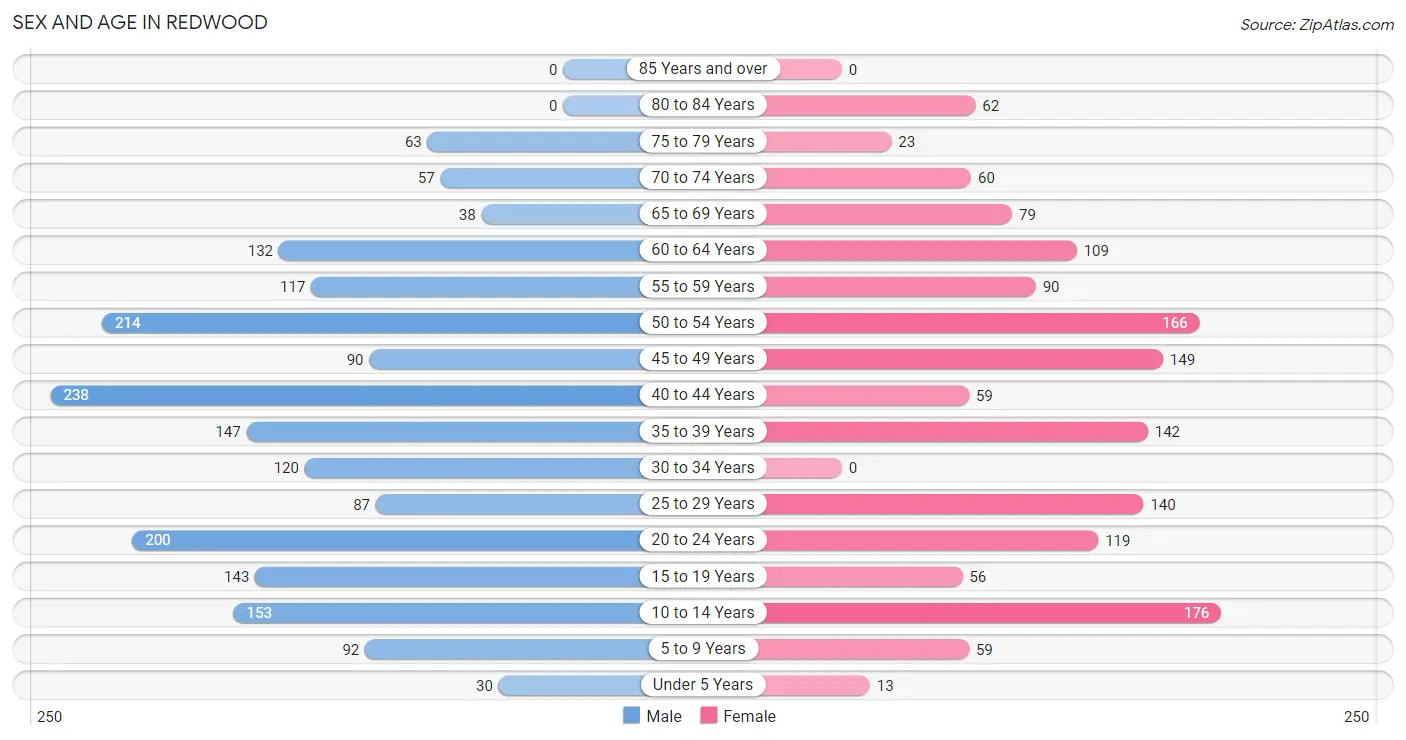
Sex and Age in Redwood
The most populous age groups in Redwood are 40 to 44 Years (238 | 12.4%) for men and 10 to 14 Years (176 | 11.7%) for women.
| Age Bracket | Male | Female |
| Under 5 Years | 30 (1.6%) | 13 (0.9%) |
| 5 to 9 Years | 92 (4.8%) | 59 (3.9%) |
| 10 to 14 Years | 153 (8.0%) | 176 (11.7%) |
| 15 to 19 Years | 143 (7.4%) | 56 (3.7%) |
| 20 to 24 Years | 200 (10.4%) | 119 (7.9%) |
| 25 to 29 Years | 87 (4.5%) | 140 (9.3%) |
| 30 to 34 Years | 120 (6.2%) | 0 (0.0%) |
| 35 to 39 Years | 147 (7.6%) | 142 (9.5%) |
| 40 to 44 Years | 238 (12.4%) | 59 (3.9%) |
| 45 to 49 Years | 90 (4.7%) | 149 (9.9%) |
| 50 to 54 Years | 214 (11.1%) | 166 (11.1%) |
| 55 to 59 Years | 117 (6.1%) | 90 (6.0%) |
| 60 to 64 Years | 132 (6.9%) | 109 (7.3%) |
| 65 to 69 Years | 38 (2.0%) | 79 (5.3%) |
| 70 to 74 Years | 57 (3.0%) | 60 (4.0%) |
| 75 to 79 Years | 63 (3.3%) | 23 (1.5%) |
| 80 to 84 Years | 0 (0.0%) | 62 (4.1%) |
| 85 Years and over | 0 (0.0%) | 0 (0.0%) |
| Total | 1,921 (100.0%) | 1,502 (100.0%) |
Families and Households in Redwood
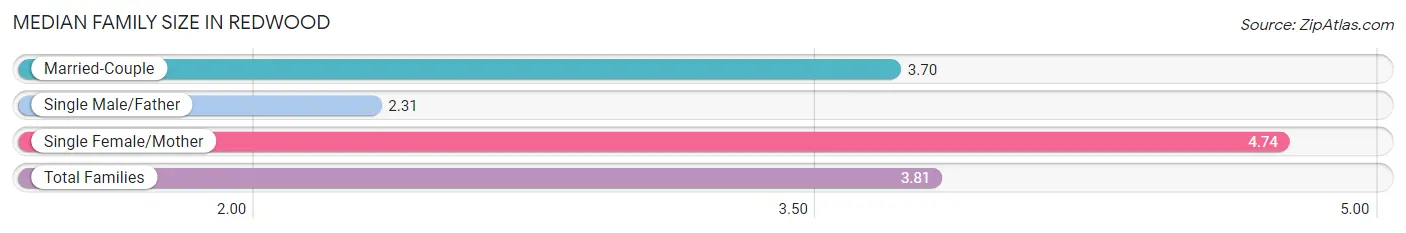
Median Family Size in Redwood
The median family size in Redwood is 3.81 persons per family, with single female/mother families (146 | 18.9%) accounting for the largest median family size of 4.74 persons per family. On the other hand, single male/father families (48 | 6.2%) represent the smallest median family size with 2.31 persons per family.
| Family Type | # Families | Family Size |
| Married-Couple | 578 (74.9%) | 3.70 |
| Single Male/Father | 48 (6.2%) | 2.31 |
| Single Female/Mother | 146 (18.9%) | 4.74 |
| Total Families | 772 (100.0%) | 3.81 |
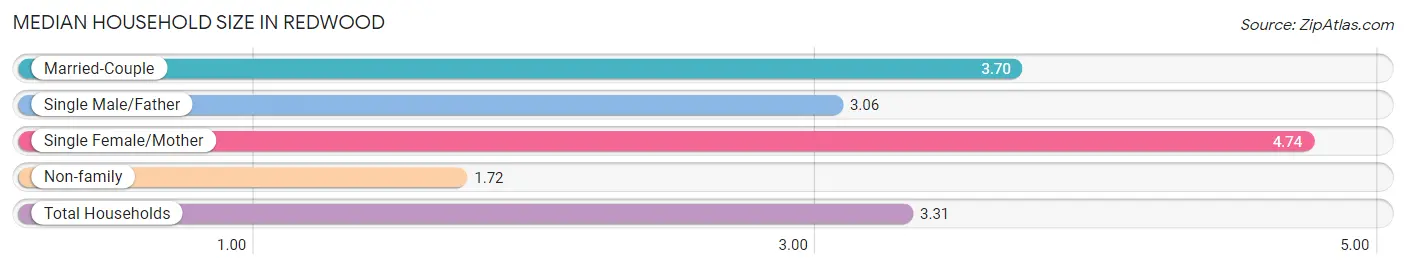
Median Household Size in Redwood
The median household size in Redwood is 3.31 persons per household, with single female/mother households (146 | 14.1%) accounting for the largest median household size of 4.74 persons per household. non-family households (261 | 25.3%) represent the smallest median household size with 1.72 persons per household.
| Household Type | # Households | Household Size |
| Married-Couple | 578 (55.9%) | 3.70 |
| Single Male/Father | 48 (4.6%) | 3.06 |
| Single Female/Mother | 146 (14.1%) | 4.74 |
| Non-family | 261 (25.3%) | 1.72 |
| Total Households | 1,033 (100.0%) | 3.31 |
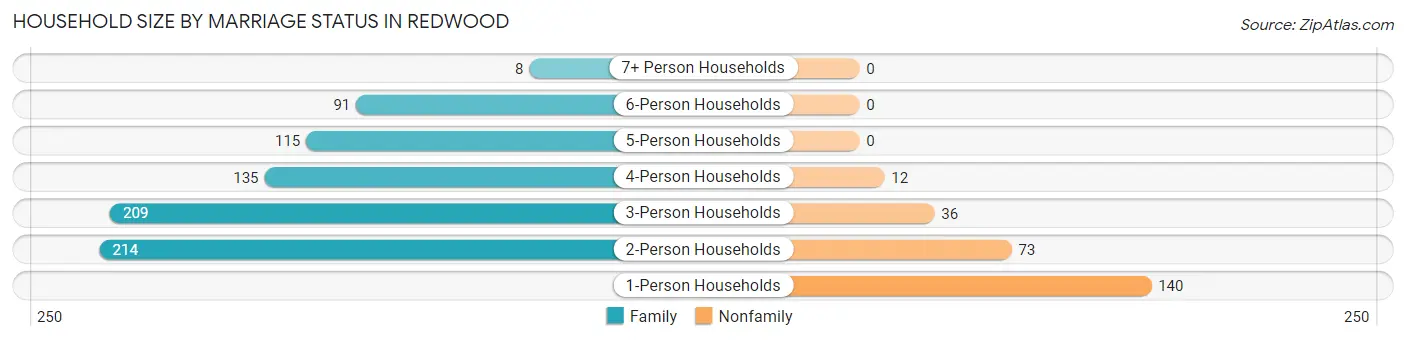
Household Size by Marriage Status in Redwood
Out of a total of 1,033 households in Redwood, 772 (74.7%) are family households, while 261 (25.3%) are nonfamily households. The most numerous type of family households are 2-person households, comprising 214, and the most common type of nonfamily households are 1-person households, comprising 140.
| Household Size | Family Households | Nonfamily Households |
| 1-Person Households | - | 140 (13.6%) |
| 2-Person Households | 214 (20.7%) | 73 (7.1%) |
| 3-Person Households | 209 (20.2%) | 36 (3.5%) |
| 4-Person Households | 135 (13.1%) | 12 (1.2%) |
| 5-Person Households | 115 (11.1%) | 0 (0.0%) |
| 6-Person Households | 91 (8.8%) | 0 (0.0%) |
| 7+ Person Households | 8 (0.8%) | 0 (0.0%) |
| Total | 772 (74.7%) | 261 (25.3%) |
Female Fertility in Redwood
Fertility by Age in Redwood
| Age Bracket | Women with Births | Births / 1,000 Women |
| 15 to 19 years | 0 (0.0%) | 0.0 |
| 20 to 34 years | 0 (0.0%) | 0.0 |
| 35 to 50 years | 0 (0.0%) | 0.0 |
| Total | 0 (0.0%) | 0.0 |
Fertility by Age by Marriage Status in Redwood
| Age Bracket | Married | Unmarried |
| 15 to 19 years | 0 (0.0%) | 0 (0.0%) |
| 20 to 34 years | 0 (0.0%) | 0 (0.0%) |
| 35 to 50 years | 0 (0.0%) | 0 (0.0%) |
| Total | 0 (0.0%) | 0 (0.0%) |
Fertility by Education in Redwood
| Educational Attainment | Women with Births | Births / 1,000 Women |
| Less than High School | 0 (0.0%) | 0.0 |
| High School Diploma | 0 (0.0%) | 0.0 |
| College or Associate's Degree | 0 (0.0%) | 0.0 |
| Bachelor's Degree | 0 (0.0%) | 0.0 |
| Graduate Degree | 0 (0.0%) | 0.0 |
| Total | 0 (0.0%) | 0.0 |
Fertility by Education by Marriage Status in Redwood
| Educational Attainment | Married | Unmarried |
| Less than High School | 0 (0.0%) | 0 (0.0%) |
| High School Diploma | 0 (0.0%) | 0 (0.0%) |
| College or Associate's Degree | 0 (0.0%) | 0 (0.0%) |
| Bachelor's Degree | 0 (0.0%) | 0 (0.0%) |
| Graduate Degree | 0 (0.0%) | 0 (0.0%) |
| Total | 0 (0.0%) | 0 (0.0%) |
Income in Redwood
Income Overview in Redwood
Per Capita Income in Redwood is $25,593, while median incomes of families and households are $77,273 and $69,132 respectively.
| Characteristic | Number | Measure |
| Per Capita Income | 3,423 | $25,593 |
| Median Family Income | 772 | $77,273 |
| Mean Family Income | 772 | $74,013 |
| Median Household Income | 1,033 | $69,132 |
| Mean Household Income | 1,033 | $77,288 |
| Income Deficit | 772 | $0 |
| Wage / Income Gap (%) | 3,423 | 33.23% |
| Wage / Income Gap ($) | 3,423 | 66.77¢ per $1 |
| Gini / Inequality Index | 3,423 | 0.31 |
Earnings by Sex in Redwood
Average Earnings in Redwood are $30,824, $33,382 for men and $22,288 for women, a difference of 33.2%.
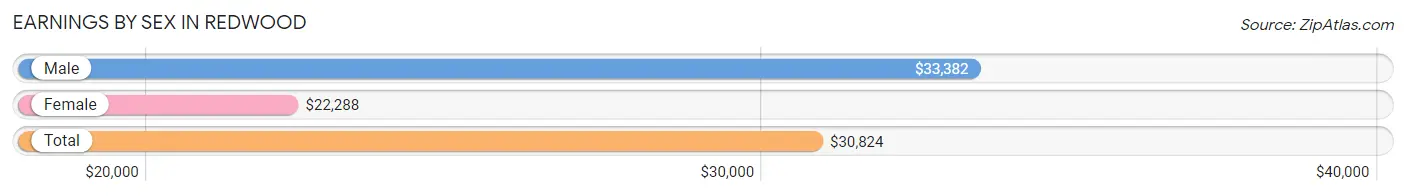
| Sex | Number | Average Earnings |
| Male | 1,303 (62.1%) | $33,382 |
| Female | 794 (37.9%) | $22,288 |
| Total | 2,097 (100.0%) | $30,824 |
Earnings by Sex by Income Bracket in Redwood
The most common earnings brackets in Redwood are $25,000 to $29,999 for men (249 | 19.1%) and $20,000 to $22,499 for women (189 | 23.8%).
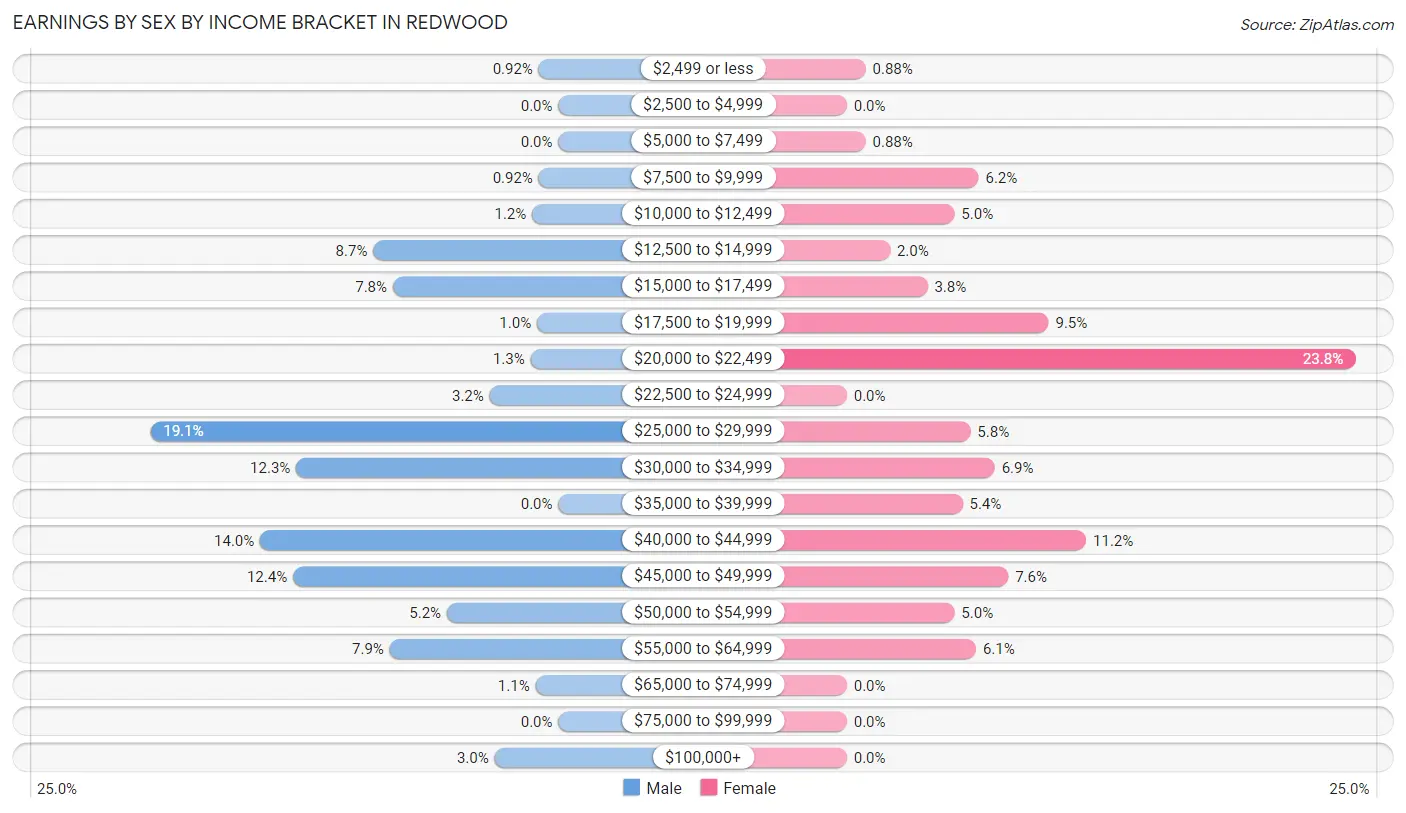
| Income | Male | Female |
| $2,499 or less | 12 (0.9%) | 7 (0.9%) |
| $2,500 to $4,999 | 0 (0.0%) | 0 (0.0%) |
| $5,000 to $7,499 | 0 (0.0%) | 7 (0.9%) |
| $7,500 to $9,999 | 12 (0.9%) | 49 (6.2%) |
| $10,000 to $12,499 | 16 (1.2%) | 40 (5.0%) |
| $12,500 to $14,999 | 113 (8.7%) | 16 (2.0%) |
| $15,000 to $17,499 | 101 (7.7%) | 30 (3.8%) |
| $17,500 to $19,999 | 13 (1.0%) | 75 (9.5%) |
| $20,000 to $22,499 | 17 (1.3%) | 189 (23.8%) |
| $22,500 to $24,999 | 42 (3.2%) | 0 (0.0%) |
| $25,000 to $29,999 | 249 (19.1%) | 46 (5.8%) |
| $30,000 to $34,999 | 160 (12.3%) | 55 (6.9%) |
| $35,000 to $39,999 | 0 (0.0%) | 43 (5.4%) |
| $40,000 to $44,999 | 182 (14.0%) | 89 (11.2%) |
| $45,000 to $49,999 | 162 (12.4%) | 60 (7.6%) |
| $50,000 to $54,999 | 68 (5.2%) | 40 (5.0%) |
| $55,000 to $64,999 | 103 (7.9%) | 48 (6.0%) |
| $65,000 to $74,999 | 14 (1.1%) | 0 (0.0%) |
| $75,000 to $99,999 | 0 (0.0%) | 0 (0.0%) |
| $100,000+ | 39 (3.0%) | 0 (0.0%) |
| Total | 1,303 (100.0%) | 794 (100.0%) |
Earnings by Sex by Educational Attainment in Redwood
Average earnings in Redwood are $40,557 for men and $32,308 for women, a difference of 20.3%. Men with an educational attainment of college or associate's degree enjoy the highest average annual earnings of $45,184, while those with high school diploma education earn the least with $34,004. Women with an educational attainment of high school diploma earn the most with the average annual earnings of $40,981, while those with less than high school education have the smallest earnings of $21,633.
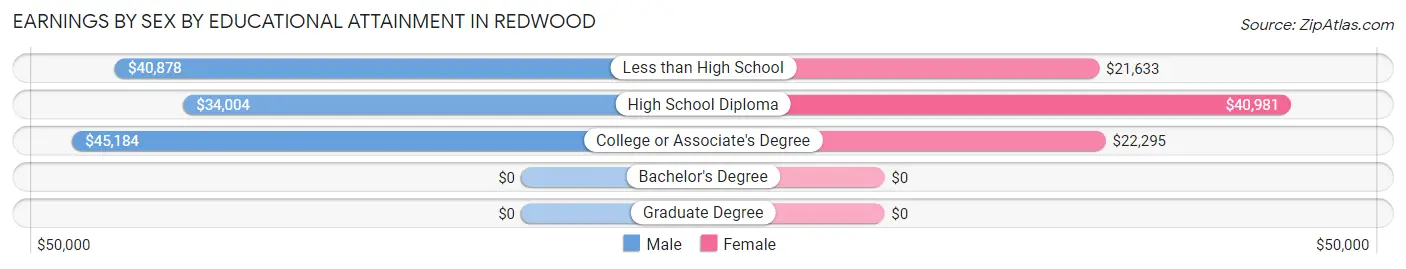
| Educational Attainment | Male Income | Female Income |
| Less than High School | $40,878 | $21,633 |
| High School Diploma | $34,004 | $40,981 |
| College or Associate's Degree | $45,184 | $22,295 |
| Bachelor's Degree | - | - |
| Graduate Degree | - | - |
| Total | $40,557 | $32,308 |
Family Income in Redwood
Family Income Brackets in Redwood
According to the Redwood family income data, there are 299 families falling into the $75,000 to $99,999 income range, which is the most common income bracket and makes up 38.7% of all families.
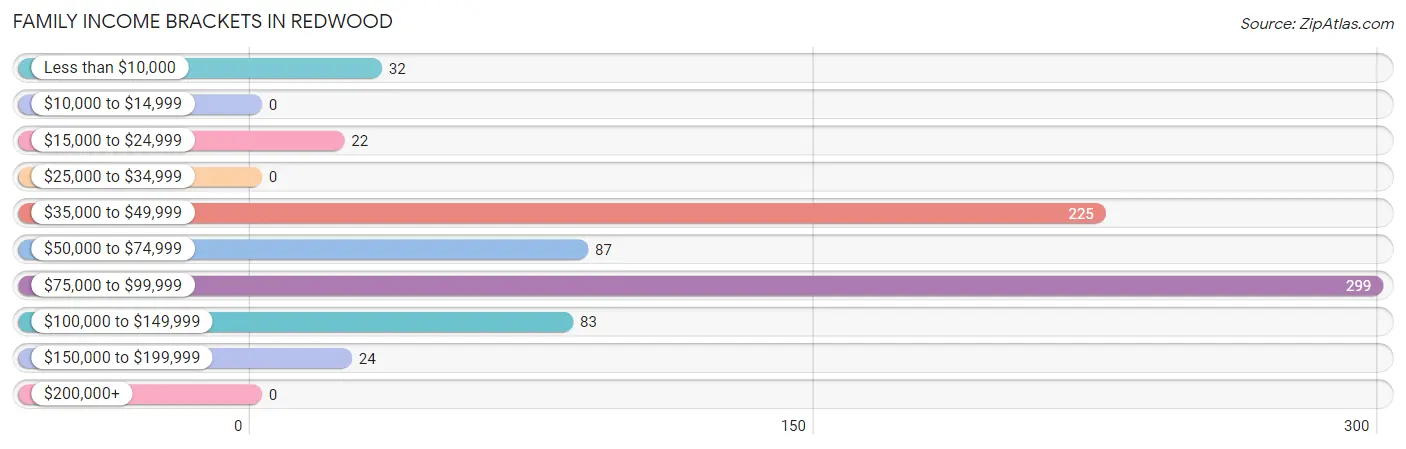
| Income Bracket | # Families | % Families |
| Less than $10,000 | 32 | 4.1% |
| $10,000 to $14,999 | 0 | 0.0% |
| $15,000 to $24,999 | 22 | 2.8% |
| $25,000 to $34,999 | 0 | 0.0% |
| $35,000 to $49,999 | 225 | 29.1% |
| $50,000 to $74,999 | 87 | 11.3% |
| $75,000 to $99,999 | 299 | 38.7% |
| $100,000 to $149,999 | 83 | 10.8% |
| $150,000 to $199,999 | 24 | 3.1% |
| $200,000+ | 0 | 0.0% |
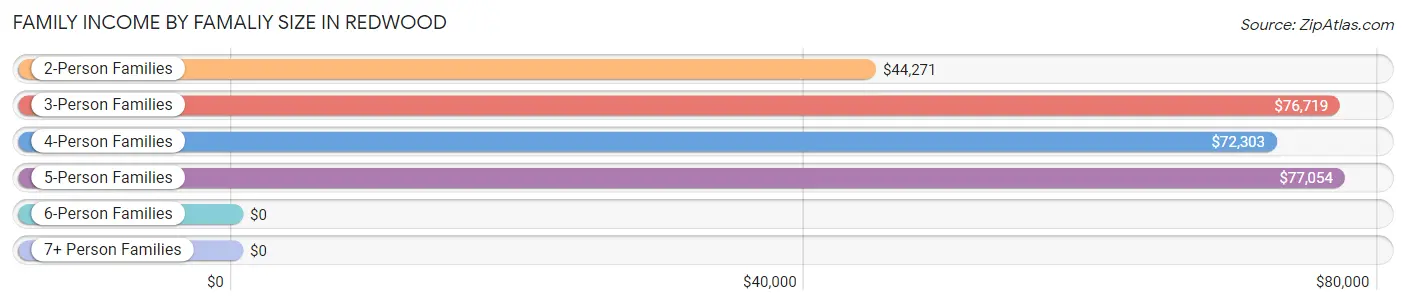
Family Income by Famaliy Size in Redwood
5-person families (115 | 14.9%) account for the highest median family income in Redwood with $77,054 per family, while 3-person families (217 | 28.1%) have the highest median income of $25,573 per family member.
| Income Bracket | # Families | Median Income |
| 2-Person Families | 228 (29.5%) | $44,271 |
| 3-Person Families | 217 (28.1%) | $76,719 |
| 4-Person Families | 113 (14.6%) | $72,303 |
| 5-Person Families | 115 (14.9%) | $77,054 |
| 6-Person Families | 91 (11.8%) | $0 |
| 7+ Person Families | 8 (1.0%) | $0 |
| Total | 772 (100.0%) | $77,273 |
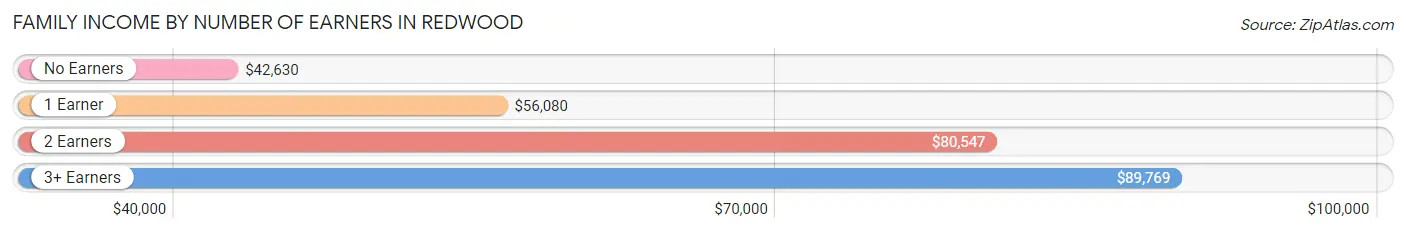
Family Income by Number of Earners in Redwood
The median family income in Redwood is $77,273, with families comprising 3+ earners (183) having the highest median family income of $89,769, while families with no earners (117) have the lowest median family income of $42,630, accounting for 23.7% and 15.2% of families, respectively.
| Number of Earners | # Families | Median Income |
| No Earners | 117 (15.2%) | $42,630 |
| 1 Earner | 145 (18.8%) | $56,080 |
| 2 Earners | 327 (42.4%) | $80,547 |
| 3+ Earners | 183 (23.7%) | $89,769 |
| Total | 772 (100.0%) | $77,273 |
Household Income in Redwood
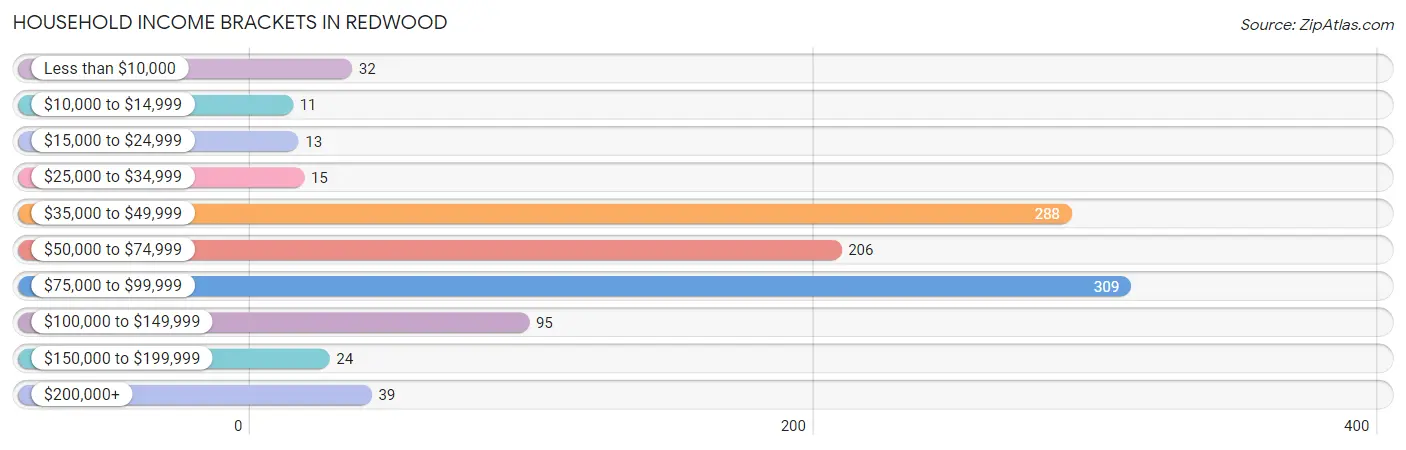
Household Income Brackets in Redwood
With 309 households falling in the category, the $75,000 to $99,999 income range is the most frequent in Redwood, accounting for 29.9% of all households. In contrast, only 11 households (1.1%) fall into the $10,000 to $14,999 income bracket, making it the least populous group.
| Income Bracket | # Households | % Households |
| Less than $10,000 | 32 | 3.1% |
| $10,000 to $14,999 | 11 | 1.1% |
| $15,000 to $24,999 | 13 | 1.3% |
| $25,000 to $34,999 | 15 | 1.5% |
| $35,000 to $49,999 | 288 | 27.9% |
| $50,000 to $74,999 | 206 | 19.9% |
| $75,000 to $99,999 | 309 | 29.9% |
| $100,000 to $149,999 | 95 | 9.2% |
| $150,000 to $199,999 | 24 | 2.3% |
| $200,000+ | 39 | 3.8% |
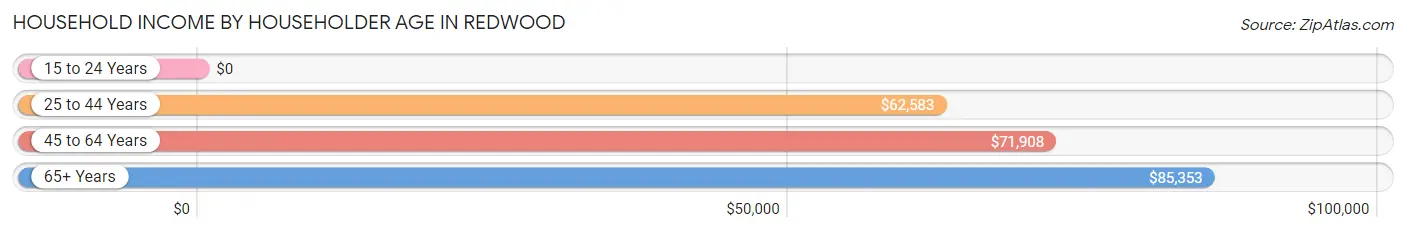
Household Income by Householder Age in Redwood
The median household income in Redwood is $69,132, with the highest median household income of $85,353 found in the 65+ years age bracket for the primary householder. A total of 245 households (23.7%) fall into this category.
| Income Bracket | # Households | Median Income |
| 15 to 24 Years | 0 (0.0%) | $0 |
| 25 to 44 Years | 257 (24.9%) | $62,583 |
| 45 to 64 Years | 531 (51.4%) | $71,908 |
| 65+ Years | 245 (23.7%) | $85,353 |
| Total | 1,033 (100.0%) | $69,132 |
Poverty in Redwood
Income Below Poverty by Sex and Age in Redwood
With 0.4% poverty level for males and 4.5% for females among the residents of Redwood, 45 to 54 year old males and 5 year old females are the most vulnerable to poverty, with 8 males (2.6%) and 25 females (69.4%) in their respective age groups living below the poverty level.
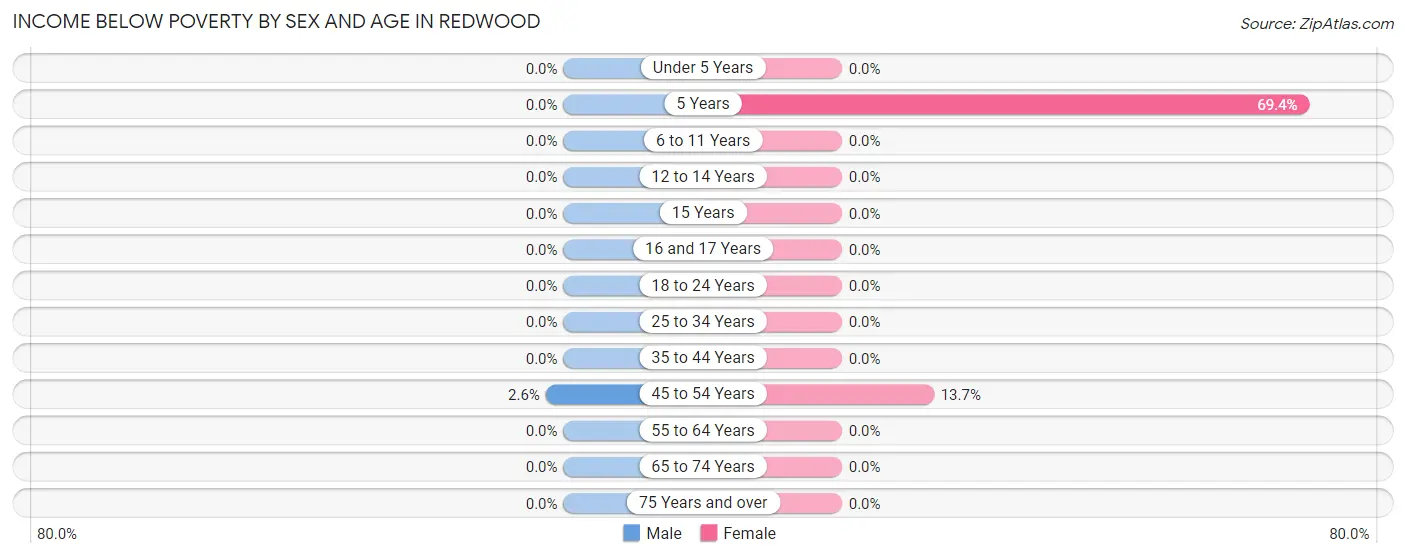
| Age Bracket | Male | Female |
| Under 5 Years | 0 (0.0%) | 0 (0.0%) |
| 5 Years | 0 (0.0%) | 25 (69.4%) |
| 6 to 11 Years | 0 (0.0%) | 0 (0.0%) |
| 12 to 14 Years | 0 (0.0%) | 0 (0.0%) |
| 15 Years | 0 (0.0%) | 0 (0.0%) |
| 16 and 17 Years | 0 (0.0%) | 0 (0.0%) |
| 18 to 24 Years | 0 (0.0%) | 0 (0.0%) |
| 25 to 34 Years | 0 (0.0%) | 0 (0.0%) |
| 35 to 44 Years | 0 (0.0%) | 0 (0.0%) |
| 45 to 54 Years | 8 (2.6%) | 43 (13.7%) |
| 55 to 64 Years | 0 (0.0%) | 0 (0.0%) |
| 65 to 74 Years | 0 (0.0%) | 0 (0.0%) |
| 75 Years and over | 0 (0.0%) | 0 (0.0%) |
| Total | 8 (0.4%) | 68 (4.5%) |
Income Above Poverty by Sex and Age in Redwood
According to the poverty statistics in Redwood, males aged under 5 years and females aged under 5 years are the age groups that are most secure financially, with 100.0% of males and 100.0% of females in these age groups living above the poverty line.
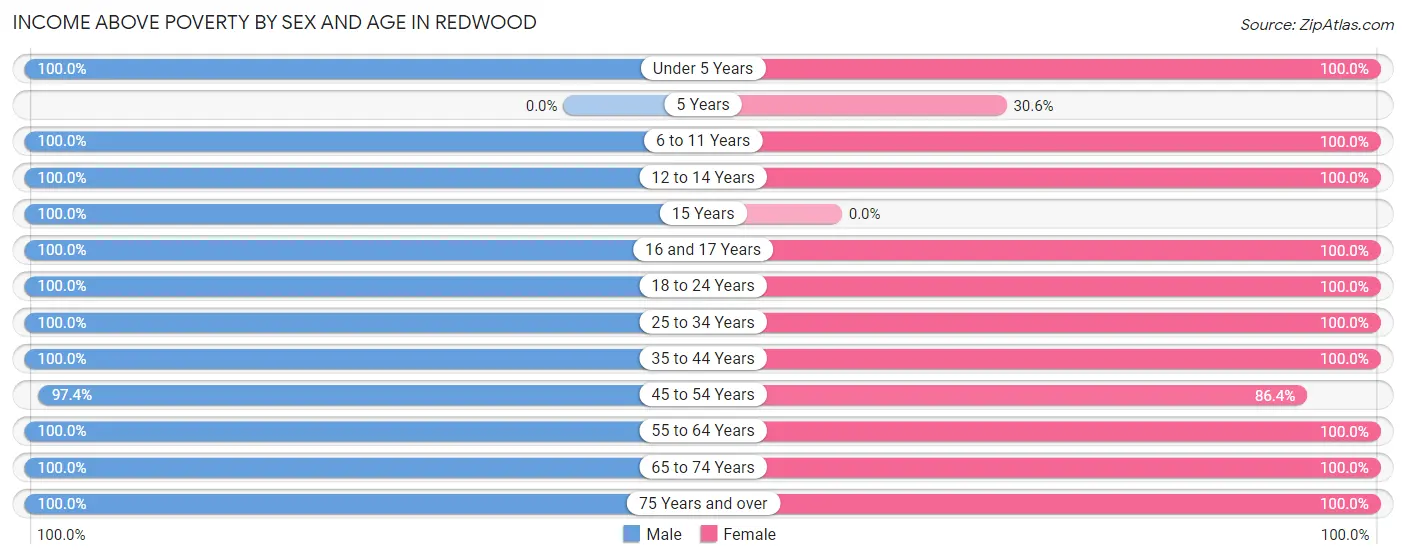
| Age Bracket | Male | Female |
| Under 5 Years | 30 (100.0%) | 13 (100.0%) |
| 5 Years | 0 (0.0%) | 11 (30.6%) |
| 6 to 11 Years | 140 (100.0%) | 119 (100.0%) |
| 12 to 14 Years | 82 (100.0%) | 80 (100.0%) |
| 15 Years | 40 (100.0%) | 0 (0.0%) |
| 16 and 17 Years | 91 (100.0%) | 27 (100.0%) |
| 18 to 24 Years | 212 (100.0%) | 148 (100.0%) |
| 25 to 34 Years | 207 (100.0%) | 140 (100.0%) |
| 35 to 44 Years | 385 (100.0%) | 201 (100.0%) |
| 45 to 54 Years | 296 (97.4%) | 272 (86.4%) |
| 55 to 64 Years | 249 (100.0%) | 199 (100.0%) |
| 65 to 74 Years | 95 (100.0%) | 139 (100.0%) |
| 75 Years and over | 63 (100.0%) | 85 (100.0%) |
| Total | 1,890 (99.6%) | 1,434 (95.5%) |
Income Below Poverty Among Married-Couple Families in Redwood
The poverty statistics for married-couple families in Redwood show that 1.2% or 7 of the total 578 families live below the poverty line. Families with no children have the highest poverty rate of 2.1%, comprising of 7 families. On the other hand, families with 1 or 2 children have the lowest poverty rate of 0.0%, which includes 0 families.
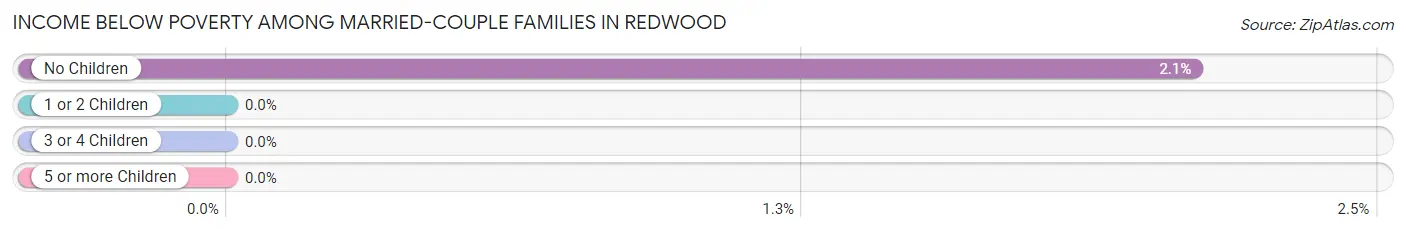
| Children | Above Poverty | Below Poverty |
| No Children | 326 (97.9%) | 7 (2.1%) |
| 1 or 2 Children | 157 (100.0%) | 0 (0.0%) |
| 3 or 4 Children | 88 (100.0%) | 0 (0.0%) |
| 5 or more Children | 0 (0.0%) | 0 (0.0%) |
| Total | 571 (98.8%) | 7 (1.2%) |
Income Below Poverty Among Single-Parent Households in Redwood
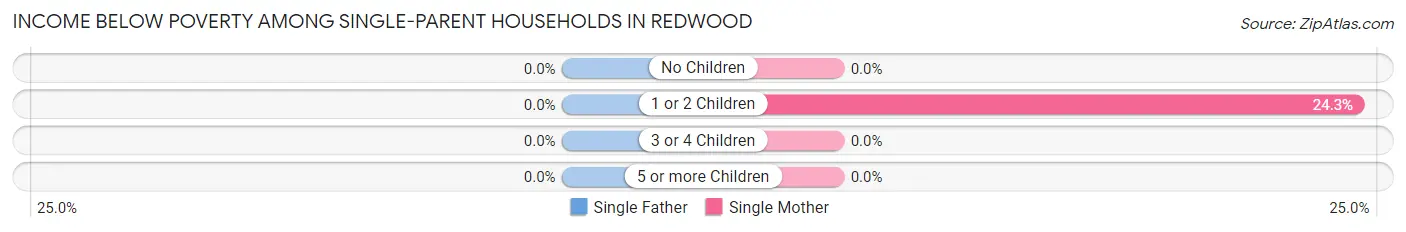
| Children | Single Father | Single Mother |
| No Children | 0 (0.0%) | 0 (0.0%) |
| 1 or 2 Children | 0 (0.0%) | 25 (24.3%) |
| 3 or 4 Children | 0 (0.0%) | 0 (0.0%) |
| 5 or more Children | 0 (0.0%) | 0 (0.0%) |
| Total | 0 (0.0%) | 25 (17.1%) |
Income Below Poverty Among Married-Couple vs Single-Parent Households in Redwood
The poverty data for Redwood shows that 7 of the married-couple family households (1.2%) and 25 of the single-parent households (12.9%) are living below the poverty level. Within the married-couple family households, those with no children have the highest poverty rate, with 7 households (2.1%) falling below the poverty line. Among the single-parent households, those with 1 or 2 children have the highest poverty rate, with 25 household (20.0%) living below poverty.
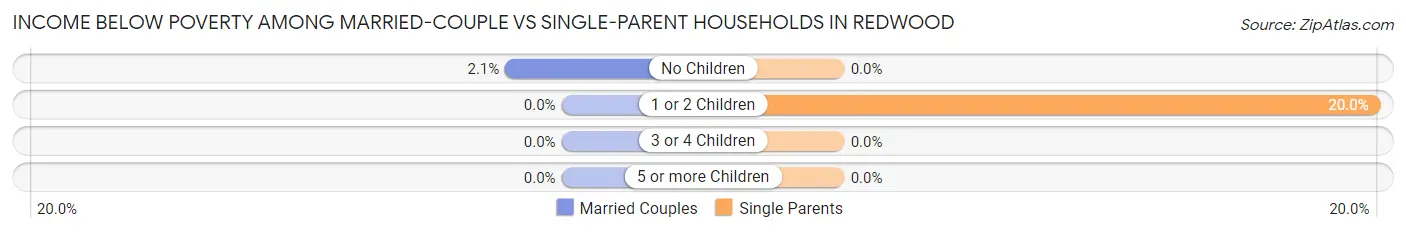
| Children | Married-Couple Families | Single-Parent Households |
| No Children | 7 (2.1%) | 0 (0.0%) |
| 1 or 2 Children | 0 (0.0%) | 25 (20.0%) |
| 3 or 4 Children | 0 (0.0%) | 0 (0.0%) |
| 5 or more Children | 0 (0.0%) | 0 (0.0%) |
| Total | 7 (1.2%) | 25 (12.9%) |
Employment Characteristics in Redwood
Employment by Class of Employer in Redwood
Among the 1,810 employed individuals in Redwood, private company employees (1,434 | 79.2%), local government employees (139 | 7.7%), and state government employees (120 | 6.6%) make up the most common classes of employment.
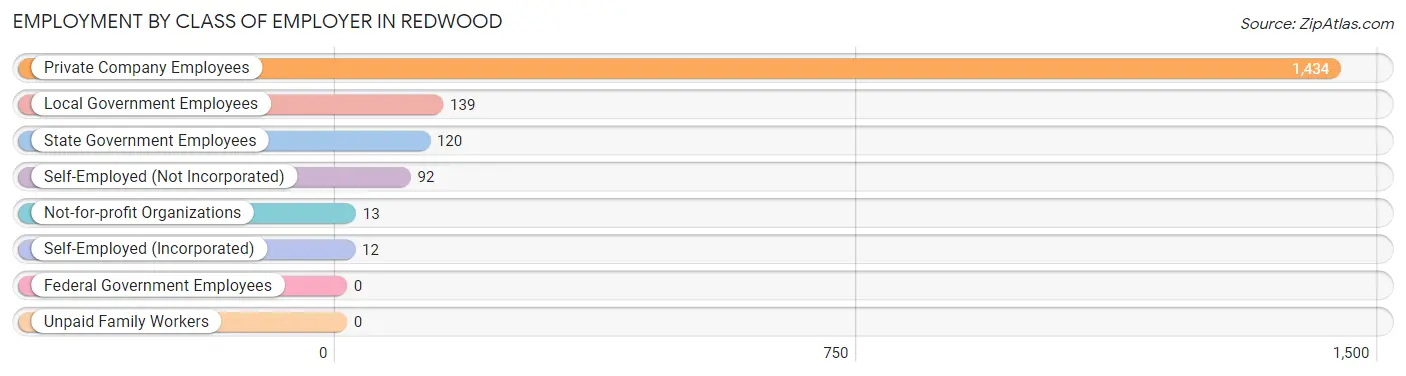
| Employer Class | # Employees | % Employees |
| Private Company Employees | 1,434 | 79.2% |
| Self-Employed (Incorporated) | 12 | 0.7% |
| Self-Employed (Not Incorporated) | 92 | 5.1% |
| Not-for-profit Organizations | 13 | 0.7% |
| Local Government Employees | 139 | 7.7% |
| State Government Employees | 120 | 6.6% |
| Federal Government Employees | 0 | 0.0% |
| Unpaid Family Workers | 0 | 0.0% |
| Total | 1,810 | 100.0% |
Employment Status by Age in Redwood
According to the labor force statistics for Redwood, out of the total population over 16 years of age (2,860), 71.2% or 2,036 individuals are in the labor force, with 6.7% or 136 of them unemployed. The age group with the highest labor force participation rate is 20 to 24 years, with 100.0% or 319 individuals in the labor force. Within the labor force, the 60 to 64 years age range has the highest percentage of unemployed individuals, with 33.6% or 39 of them being unemployed.
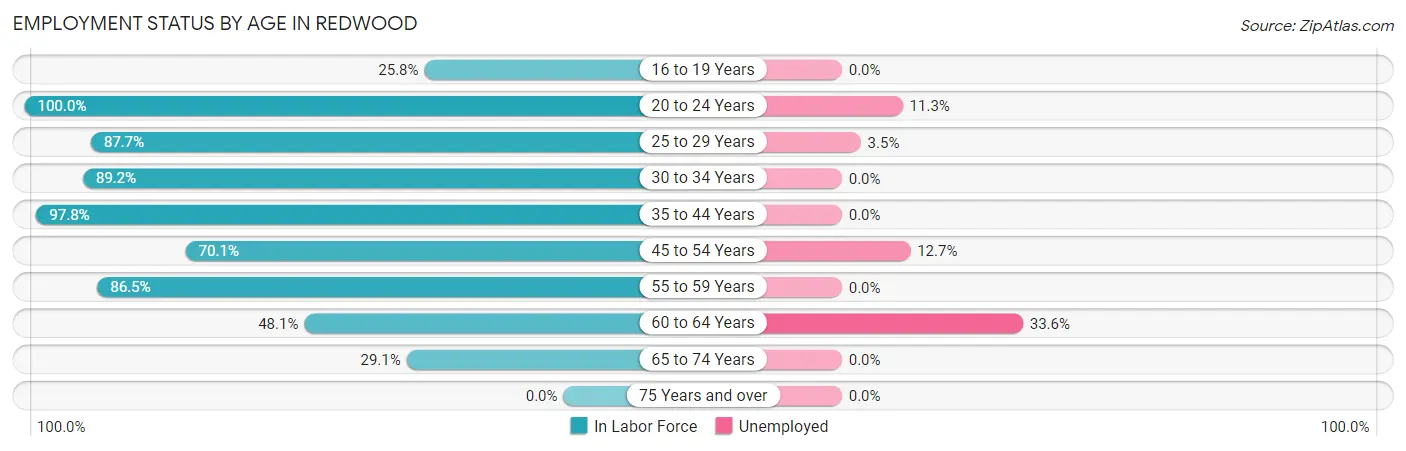
| Age Bracket | In Labor Force | Unemployed |
| 16 to 19 Years | 41 (25.8%) | 0 (0.0%) |
| 20 to 24 Years | 319 (100.0%) | 36 (11.3%) |
| 25 to 29 Years | 199 (87.7%) | 7 (3.5%) |
| 30 to 34 Years | 107 (89.2%) | 0 (0.0%) |
| 35 to 44 Years | 573 (97.8%) | 0 (0.0%) |
| 45 to 54 Years | 434 (70.1%) | 55 (12.7%) |
| 55 to 59 Years | 179 (86.5%) | 0 (0.0%) |
| 60 to 64 Years | 116 (48.1%) | 39 (33.6%) |
| 65 to 74 Years | 68 (29.1%) | 0 (0.0%) |
| 75 Years and over | 0 (0.0%) | 0 (0.0%) |
| Total | 2,036 (71.2%) | 136 (6.7%) |
Employment Status by Educational Attainment in Redwood
According to labor force statistics for Redwood, 80.4% of individuals (1,608) out of the total population between 25 and 64 years of age (2,000) are in the labor force, with 6.3% or 101 of them being unemployed. The group with the highest labor force participation rate are those with the educational attainment of college / associate degree, with 91.3% or 366 individuals in the labor force. Within the labor force, individuals with college / associate degree education have the highest percentage of unemployment, with 27.6% or 101 of them being unemployed.
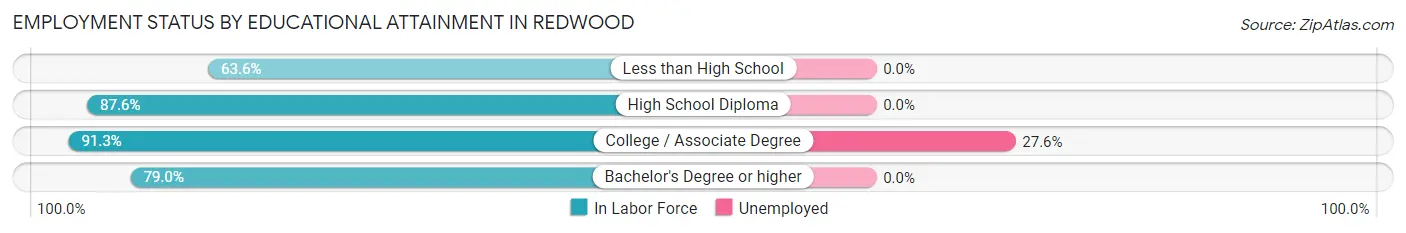
| Educational Attainment | In Labor Force | Unemployed |
| Less than High School | 393 (63.6%) | 0 (0.0%) |
| High School Diploma | 755 (87.6%) | 0 (0.0%) |
| College / Associate Degree | 366 (91.3%) | 111 (27.6%) |
| Bachelor's Degree or higher | 94 (79.0%) | 0 (0.0%) |
| Total | 1,608 (80.4%) | 126 (6.3%) |
Employment Occupations by Sex in Redwood
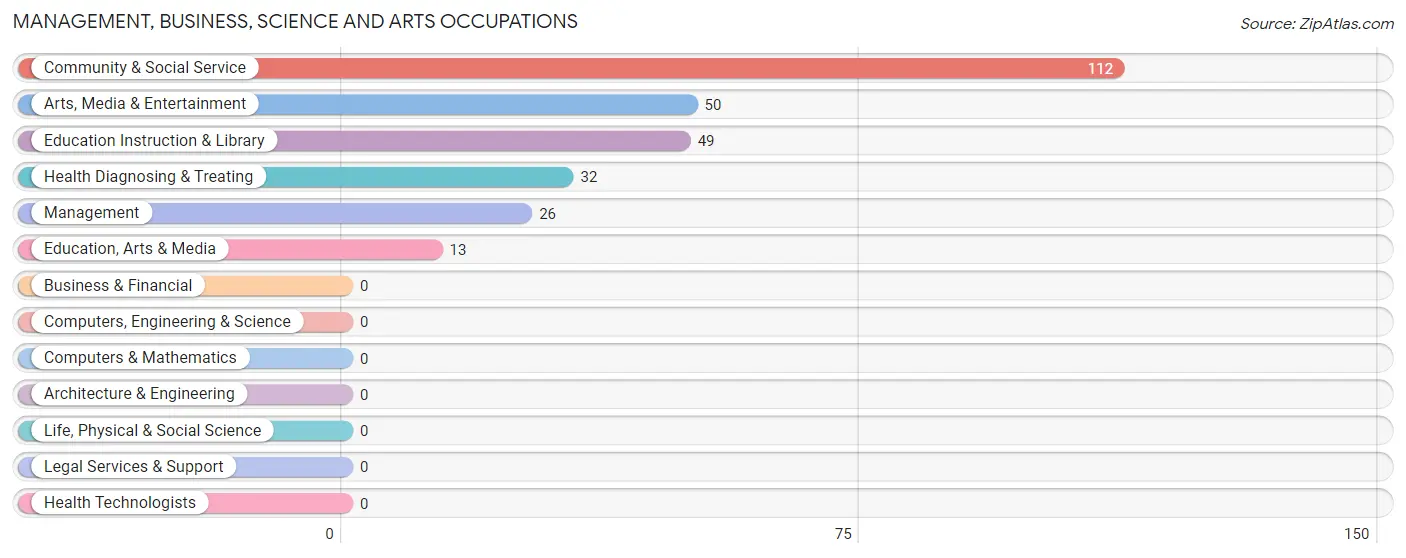
Management, Business, Science and Arts Occupations
The most common Management, Business, Science and Arts occupations in Redwood are Community & Social Service (112 | 5.9%), Arts, Media & Entertainment (50 | 2.6%), Education Instruction & Library (49 | 2.6%), Health Diagnosing & Treating (32 | 1.7%), and Management (26 | 1.4%).
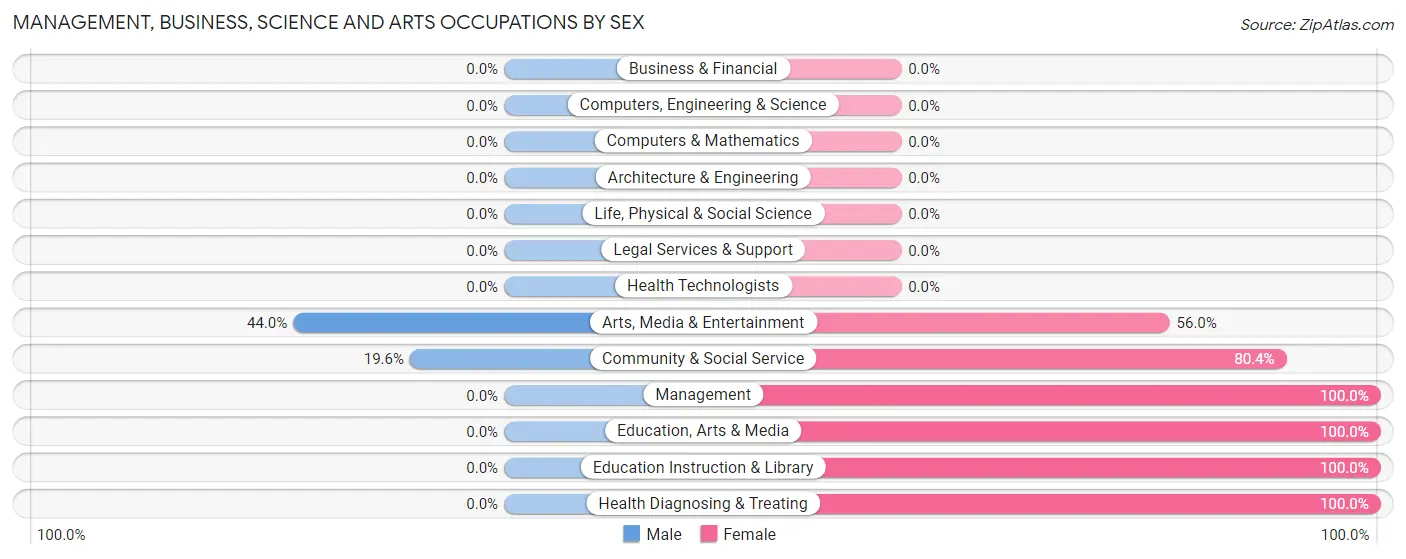
Management, Business, Science and Arts Occupations by Sex
Within the Management, Business, Science and Arts occupations in Redwood, the most male-oriented occupations are Arts, Media & Entertainment (44.0%), and Community & Social Service (19.6%), while the most female-oriented occupations are Management (100.0%), Education, Arts & Media (100.0%), and Education Instruction & Library (100.0%).
| Occupation | Male | Female |
| Management | 0 (0.0%) | 26 (100.0%) |
| Business & Financial | 0 (0.0%) | 0 (0.0%) |
| Computers, Engineering & Science | 0 (0.0%) | 0 (0.0%) |
| Computers & Mathematics | 0 (0.0%) | 0 (0.0%) |
| Architecture & Engineering | 0 (0.0%) | 0 (0.0%) |
| Life, Physical & Social Science | 0 (0.0%) | 0 (0.0%) |
| Community & Social Service | 22 (19.6%) | 90 (80.4%) |
| Education, Arts & Media | 0 (0.0%) | 13 (100.0%) |
| Legal Services & Support | 0 (0.0%) | 0 (0.0%) |
| Education Instruction & Library | 0 (0.0%) | 49 (100.0%) |
| Arts, Media & Entertainment | 22 (44.0%) | 28 (56.0%) |
| Health Diagnosing & Treating | 0 (0.0%) | 32 (100.0%) |
| Health Technologists | 0 (0.0%) | 0 (0.0%) |
| Total (Category) | 22 (12.9%) | 148 (87.1%) |
| Total (Overall) | 1,223 (64.4%) | 676 (35.6%) |
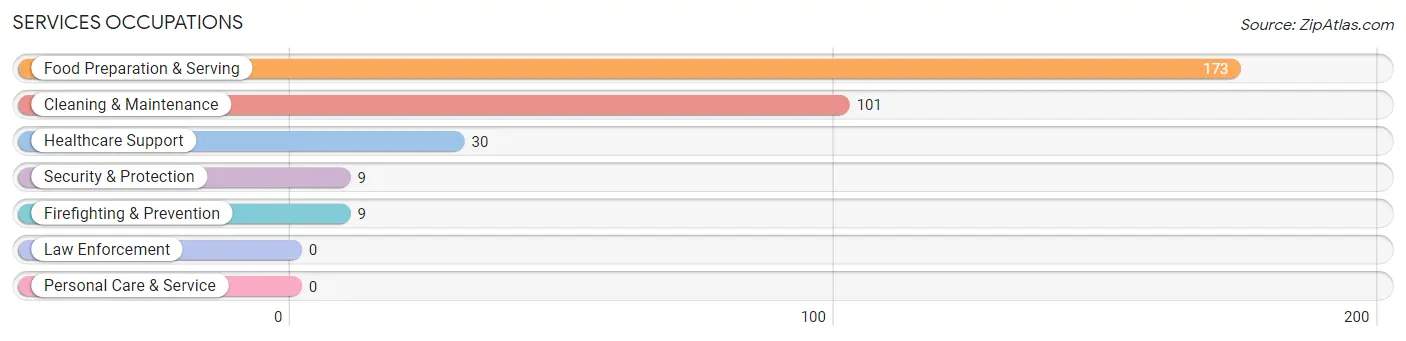
Services Occupations
The most common Services occupations in Redwood are Food Preparation & Serving (173 | 9.1%), Cleaning & Maintenance (101 | 5.3%), Healthcare Support (30 | 1.6%), Security & Protection (9 | 0.5%), and Firefighting & Prevention (9 | 0.5%).
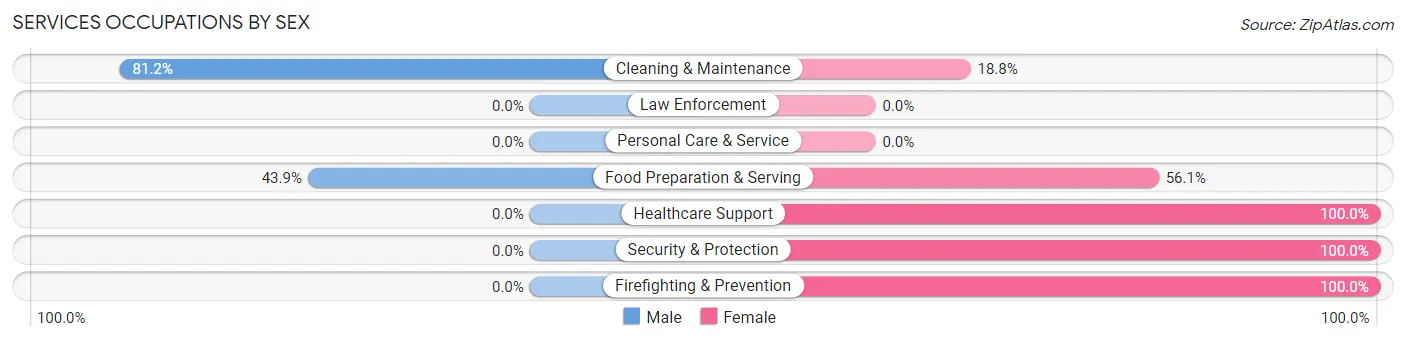
Services Occupations by Sex
Within the Services occupations in Redwood, the most male-oriented occupations are Cleaning & Maintenance (81.2%), and Food Preparation & Serving (43.9%), while the most female-oriented occupations are Healthcare Support (100.0%), Security & Protection (100.0%), and Firefighting & Prevention (100.0%).
| Occupation | Male | Female |
| Healthcare Support | 0 (0.0%) | 30 (100.0%) |
| Security & Protection | 0 (0.0%) | 9 (100.0%) |
| Firefighting & Prevention | 0 (0.0%) | 9 (100.0%) |
| Law Enforcement | 0 (0.0%) | 0 (0.0%) |
| Food Preparation & Serving | 76 (43.9%) | 97 (56.1%) |
| Cleaning & Maintenance | 82 (81.2%) | 19 (18.8%) |
| Personal Care & Service | 0 (0.0%) | 0 (0.0%) |
| Total (Category) | 158 (50.5%) | 155 (49.5%) |
| Total (Overall) | 1,223 (64.4%) | 676 (35.6%) |
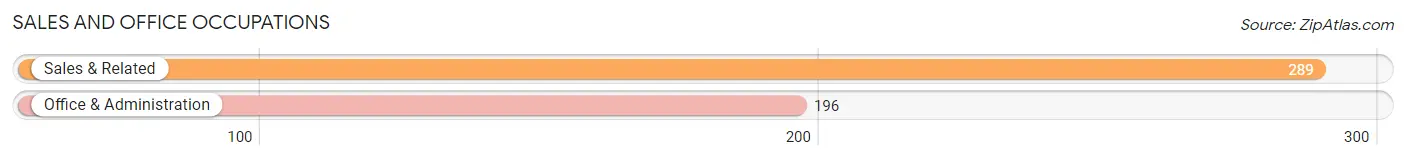
Sales and Office Occupations
The most common Sales and Office occupations in Redwood are Sales & Related (289 | 15.2%), and Office & Administration (196 | 10.3%).
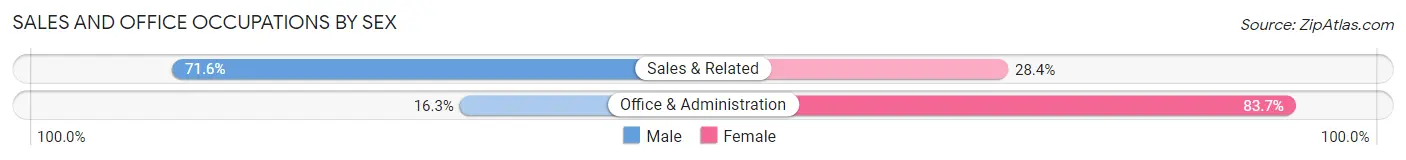
Sales and Office Occupations by Sex
| Occupation | Male | Female |
| Sales & Related | 207 (71.6%) | 82 (28.4%) |
| Office & Administration | 32 (16.3%) | 164 (83.7%) |
| Total (Category) | 239 (49.3%) | 246 (50.7%) |
| Total (Overall) | 1,223 (64.4%) | 676 (35.6%) |
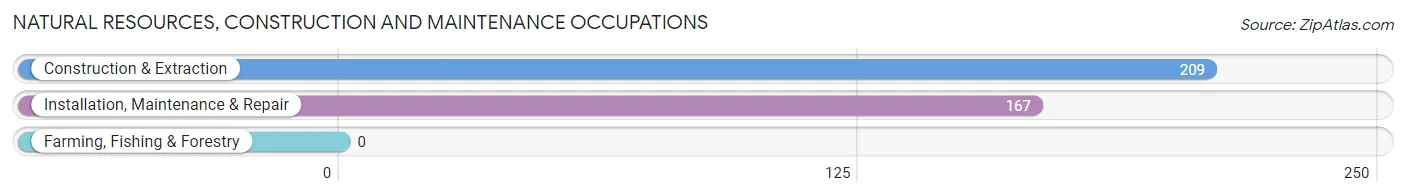
Natural Resources, Construction and Maintenance Occupations
The most common Natural Resources, Construction and Maintenance occupations in Redwood are Construction & Extraction (209 | 11.0%), and Installation, Maintenance & Repair (167 | 8.8%).
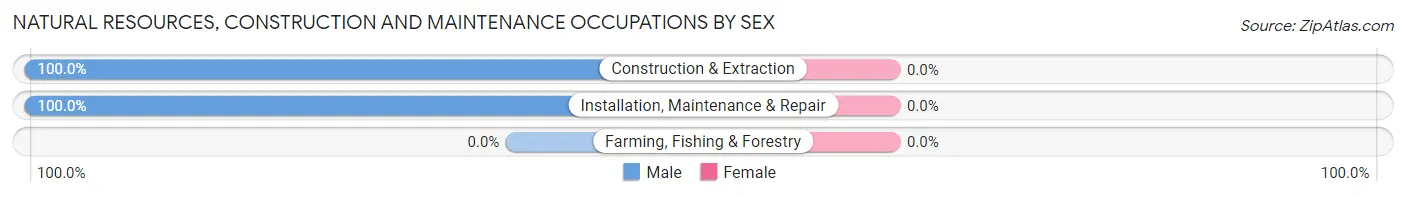
Natural Resources, Construction and Maintenance Occupations by Sex
| Occupation | Male | Female |
| Farming, Fishing & Forestry | 0 (0.0%) | 0 (0.0%) |
| Construction & Extraction | 209 (100.0%) | 0 (0.0%) |
| Installation, Maintenance & Repair | 167 (100.0%) | 0 (0.0%) |
| Total (Category) | 376 (100.0%) | 0 (0.0%) |
| Total (Overall) | 1,223 (64.4%) | 676 (35.6%) |
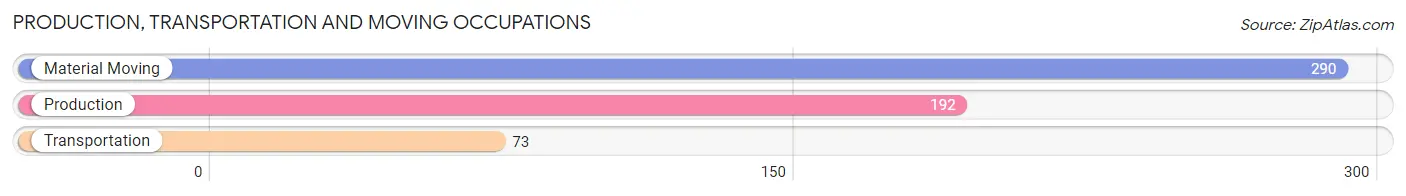
Production, Transportation and Moving Occupations
The most common Production, Transportation and Moving occupations in Redwood are Material Moving (290 | 15.3%), Production (192 | 10.1%), and Transportation (73 | 3.8%).
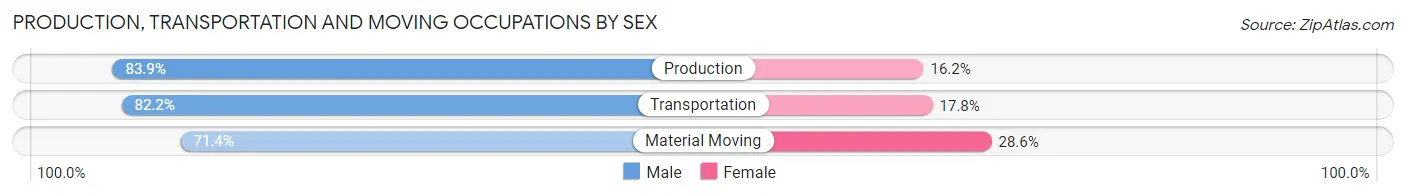
Production, Transportation and Moving Occupations by Sex
| Occupation | Male | Female |
| Production | 161 (83.9%) | 31 (16.2%) |
| Transportation | 60 (82.2%) | 13 (17.8%) |
| Material Moving | 207 (71.4%) | 83 (28.6%) |
| Total (Category) | 428 (77.1%) | 127 (22.9%) |
| Total (Overall) | 1,223 (64.4%) | 676 (35.6%) |
Employment Industries by Sex in Redwood
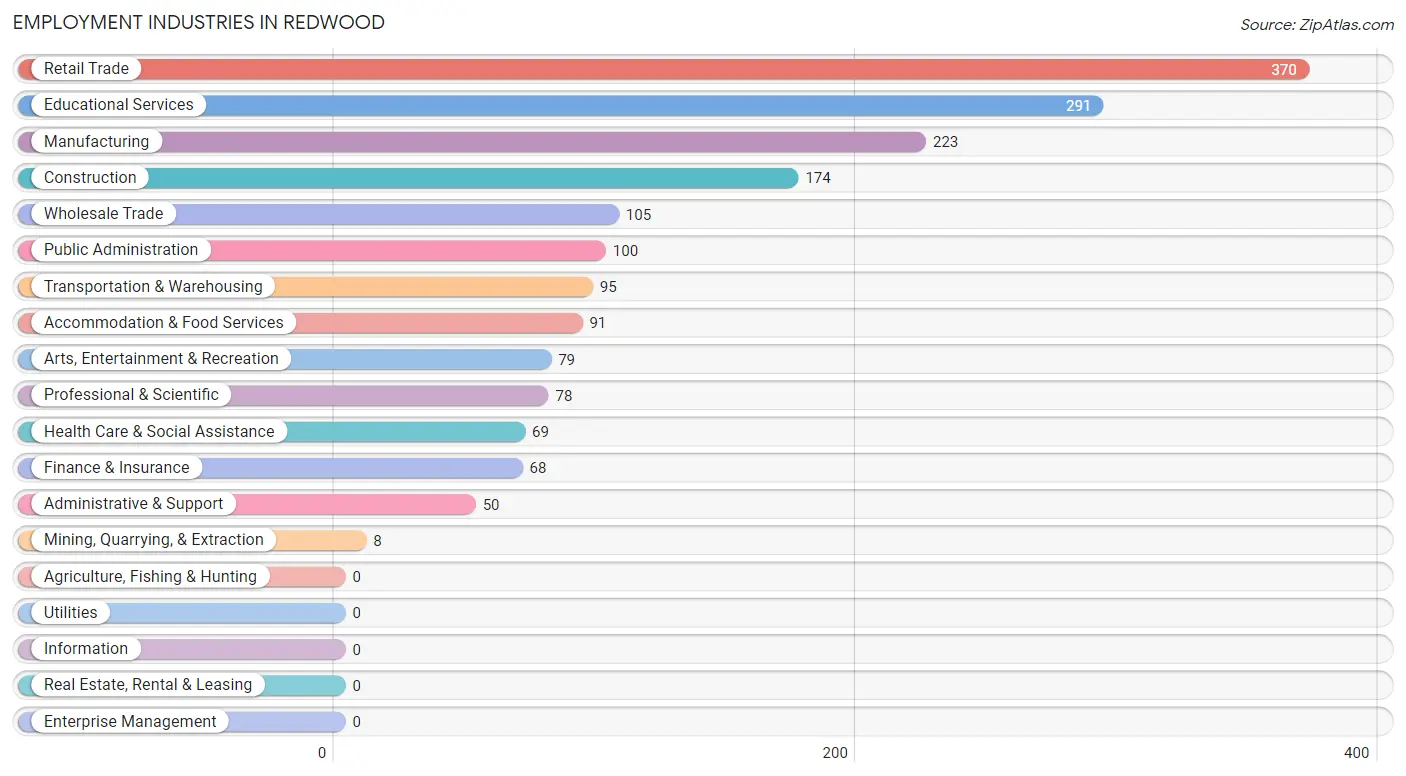
Employment Industries in Redwood
The major employment industries in Redwood include Retail Trade (370 | 19.5%), Educational Services (291 | 15.3%), Manufacturing (223 | 11.7%), Construction (174 | 9.2%), and Wholesale Trade (105 | 5.5%).
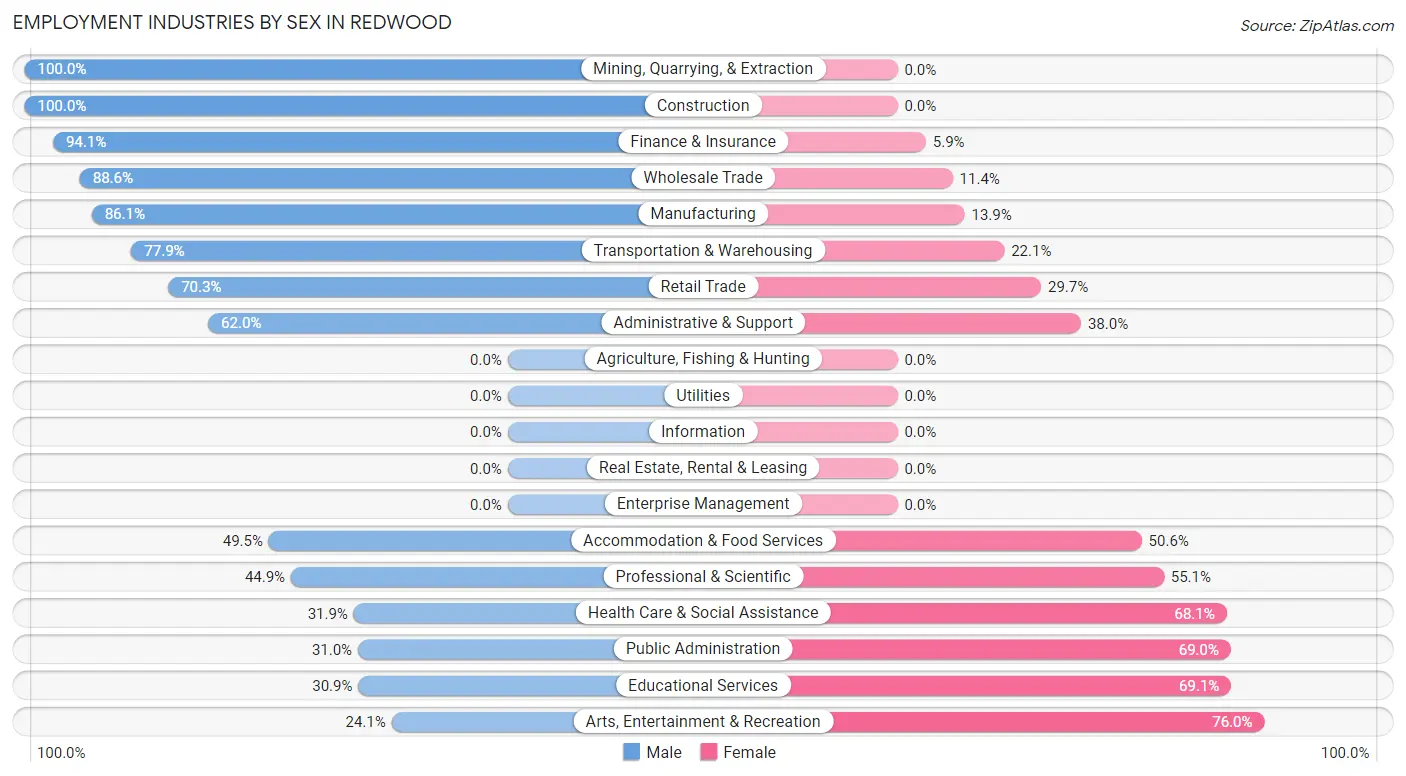
Employment Industries by Sex in Redwood
The Redwood industries that see more men than women are Mining, Quarrying, & Extraction (100.0%), Construction (100.0%), and Finance & Insurance (94.1%), whereas the industries that tend to have a higher number of women are Arts, Entertainment & Recreation (75.9%), Educational Services (69.1%), and Public Administration (69.0%).
| Industry | Male | Female |
| Agriculture, Fishing & Hunting | 0 (0.0%) | 0 (0.0%) |
| Mining, Quarrying, & Extraction | 8 (100.0%) | 0 (0.0%) |
| Construction | 174 (100.0%) | 0 (0.0%) |
| Manufacturing | 192 (86.1%) | 31 (13.9%) |
| Wholesale Trade | 93 (88.6%) | 12 (11.4%) |
| Retail Trade | 260 (70.3%) | 110 (29.7%) |
| Transportation & Warehousing | 74 (77.9%) | 21 (22.1%) |
| Utilities | 0 (0.0%) | 0 (0.0%) |
| Information | 0 (0.0%) | 0 (0.0%) |
| Finance & Insurance | 64 (94.1%) | 4 (5.9%) |
| Real Estate, Rental & Leasing | 0 (0.0%) | 0 (0.0%) |
| Professional & Scientific | 35 (44.9%) | 43 (55.1%) |
| Enterprise Management | 0 (0.0%) | 0 (0.0%) |
| Administrative & Support | 31 (62.0%) | 19 (38.0%) |
| Educational Services | 90 (30.9%) | 201 (69.1%) |
| Health Care & Social Assistance | 22 (31.9%) | 47 (68.1%) |
| Arts, Entertainment & Recreation | 19 (24.0%) | 60 (75.9%) |
| Accommodation & Food Services | 45 (49.4%) | 46 (50.5%) |
| Public Administration | 31 (31.0%) | 69 (69.0%) |
| Total | 1,223 (64.4%) | 676 (35.6%) |
Education in Redwood
School Enrollment in Redwood
The most common levels of schooling among the 867 students in Redwood are high school (274 | 31.6%), middle school (255 | 29.4%), and college / undergraduate (218 | 25.1%).
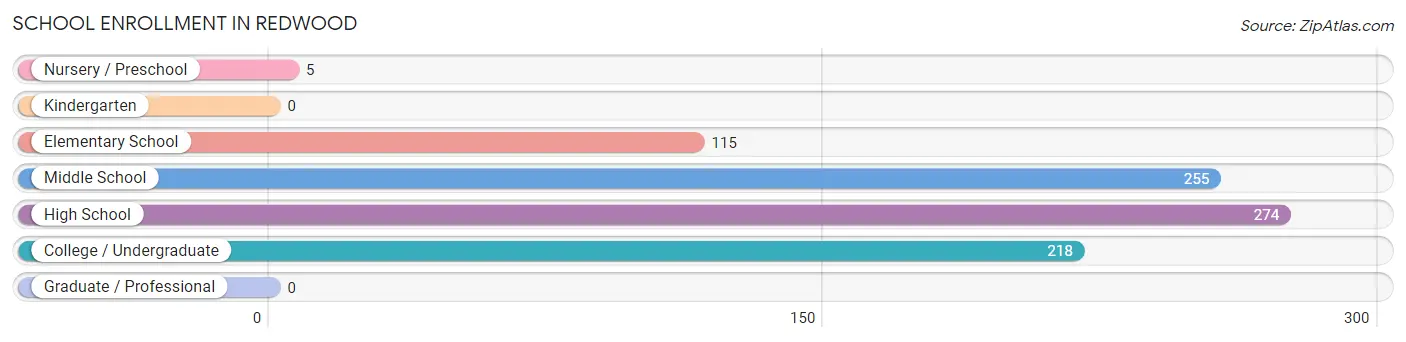
| School Level | # Students | % Students |
| Nursery / Preschool | 5 | 0.6% |
| Kindergarten | 0 | 0.0% |
| Elementary School | 115 | 13.3% |
| Middle School | 255 | 29.4% |
| High School | 274 | 31.6% |
| College / Undergraduate | 218 | 25.1% |
| Graduate / Professional | 0 | 0.0% |
| Total | 867 | 100.0% |
School Enrollment by Age by Funding Source in Redwood
Out of a total of 867 students who are enrolled in schools in Redwood, 10 (1.2%) attend a private institution, while the remaining 857 (98.8%) are enrolled in public schools. The age group of 10 to 14 year olds has the highest likelihood of being enrolled in private schools, with 10 (3.1% in the age bracket) enrolled. Conversely, the age group of 3 to 4 year olds has the lowest likelihood of being enrolled in a private school, with 5 (100.0% in the age bracket) attending a public institution.
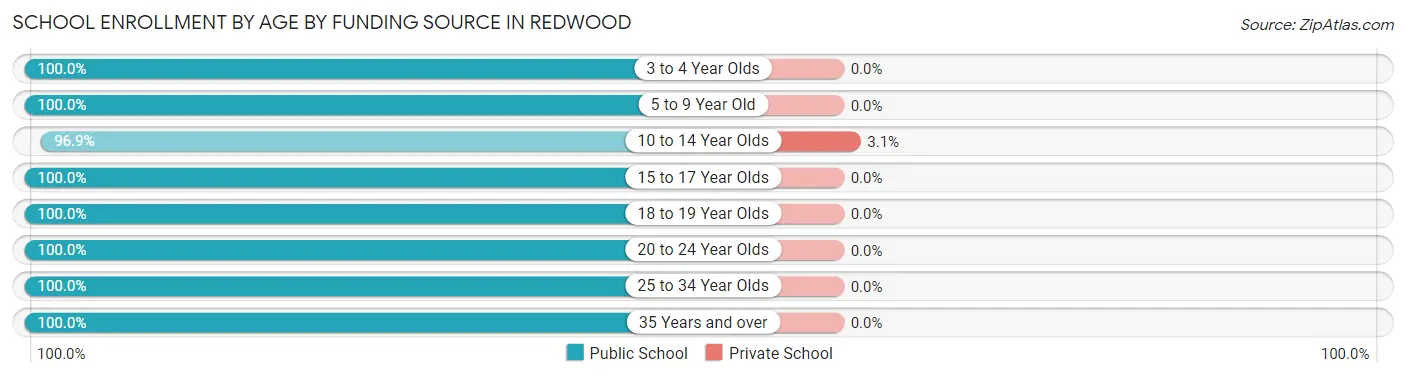
| Age Bracket | Public School | Private School |
| 3 to 4 Year Olds | 5 (100.0%) | 0 (0.0%) |
| 5 to 9 Year Old | 115 (100.0%) | 0 (0.0%) |
| 10 to 14 Year Olds | 313 (96.9%) | 10 (3.1%) |
| 15 to 17 Year Olds | 158 (100.0%) | 0 (0.0%) |
| 18 to 19 Year Olds | 29 (100.0%) | 0 (0.0%) |
| 20 to 24 Year Olds | 186 (100.0%) | 0 (0.0%) |
| 25 to 34 Year Olds | 44 (100.0%) | 0 (0.0%) |
| 35 Years and over | 7 (100.0%) | 0 (0.0%) |
| Total | 857 (98.8%) | 10 (1.2%) |
Educational Attainment by Field of Study in Redwood
Liberal arts & history (59 | 31.6%), education (49 | 26.2%), visual & performing arts (38 | 20.3%), computers & mathematics (30 | 16.0%), and literature & languages (11 | 5.9%) are the most common fields of study among 187 individuals in Redwood who have obtained a bachelor's degree or higher.
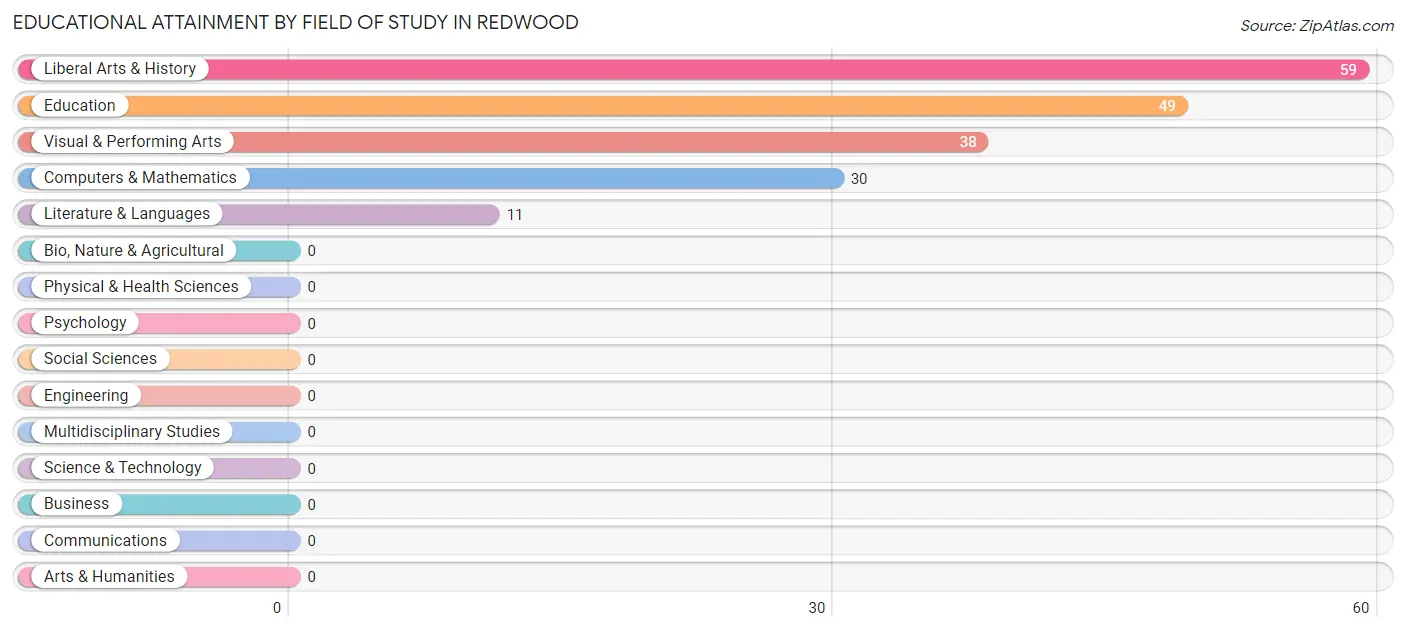
| Field of Study | # Graduates | % Graduates |
| Computers & Mathematics | 30 | 16.0% |
| Bio, Nature & Agricultural | 0 | 0.0% |
| Physical & Health Sciences | 0 | 0.0% |
| Psychology | 0 | 0.0% |
| Social Sciences | 0 | 0.0% |
| Engineering | 0 | 0.0% |
| Multidisciplinary Studies | 0 | 0.0% |
| Science & Technology | 0 | 0.0% |
| Business | 0 | 0.0% |
| Education | 49 | 26.2% |
| Literature & Languages | 11 | 5.9% |
| Liberal Arts & History | 59 | 31.6% |
| Visual & Performing Arts | 38 | 20.3% |
| Communications | 0 | 0.0% |
| Arts & Humanities | 0 | 0.0% |
| Total | 187 | 100.0% |
Transportation & Commute in Redwood
Vehicle Availability by Sex in Redwood
The most prevalent vehicle ownership categories in Redwood are males with 4 vehicles (276, accounting for 23.9%) and females with 4 vehicles (90, making up 42.2%).
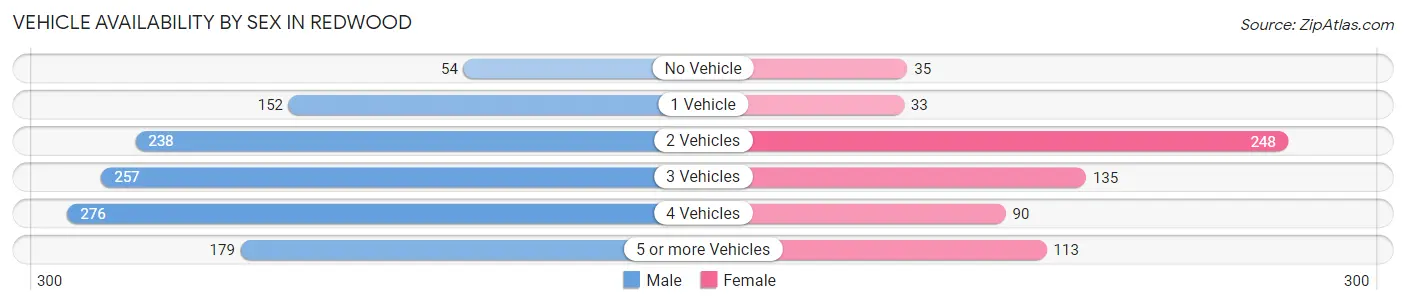
| Vehicles Available | Male | Female |
| No Vehicle | 54 (4.7%) | 35 (5.3%) |
| 1 Vehicle | 152 (13.2%) | 33 (5.1%) |
| 2 Vehicles | 238 (20.6%) | 248 (37.9%) |
| 3 Vehicles | 257 (22.2%) | 135 (20.6%) |
| 4 Vehicles | 276 (23.9%) | 90 (13.8%) |
| 5 or more Vehicles | 179 (15.5%) | 113 (17.3%) |
| Total | 1,156 (100.0%) | 654 (100.0%) |
Commute Time in Redwood
The most frequently occuring commute durations in Redwood are 30 to 34 minutes (394 commuters, 22.3%), 15 to 19 minutes (390 commuters, 22.1%), and 10 to 14 minutes (323 commuters, 18.3%).
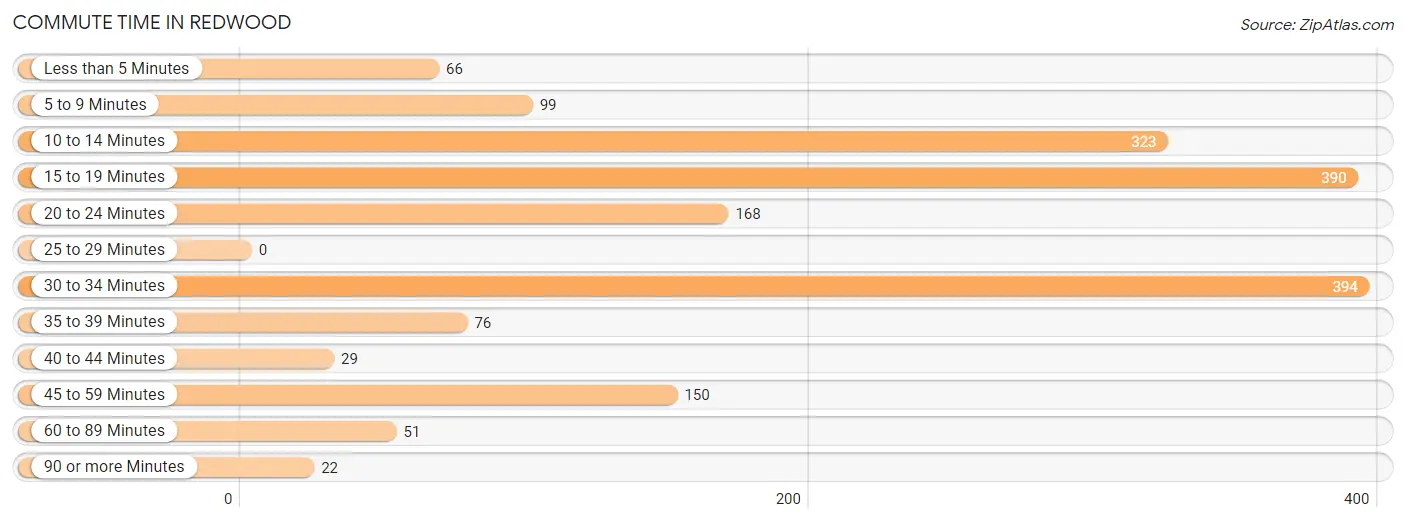
| Commute Time | # Commuters | % Commuters |
| Less than 5 Minutes | 66 | 3.7% |
| 5 to 9 Minutes | 99 | 5.6% |
| 10 to 14 Minutes | 323 | 18.3% |
| 15 to 19 Minutes | 390 | 22.1% |
| 20 to 24 Minutes | 168 | 9.5% |
| 25 to 29 Minutes | 0 | 0.0% |
| 30 to 34 Minutes | 394 | 22.3% |
| 35 to 39 Minutes | 76 | 4.3% |
| 40 to 44 Minutes | 29 | 1.6% |
| 45 to 59 Minutes | 150 | 8.5% |
| 60 to 89 Minutes | 51 | 2.9% |
| 90 or more Minutes | 22 | 1.2% |
Commute Time by Sex in Redwood
The most common commute times in Redwood are 15 to 19 minutes (269 commuters, 24.1%) for males and 30 to 34 minutes (163 commuters, 24.9%) for females.
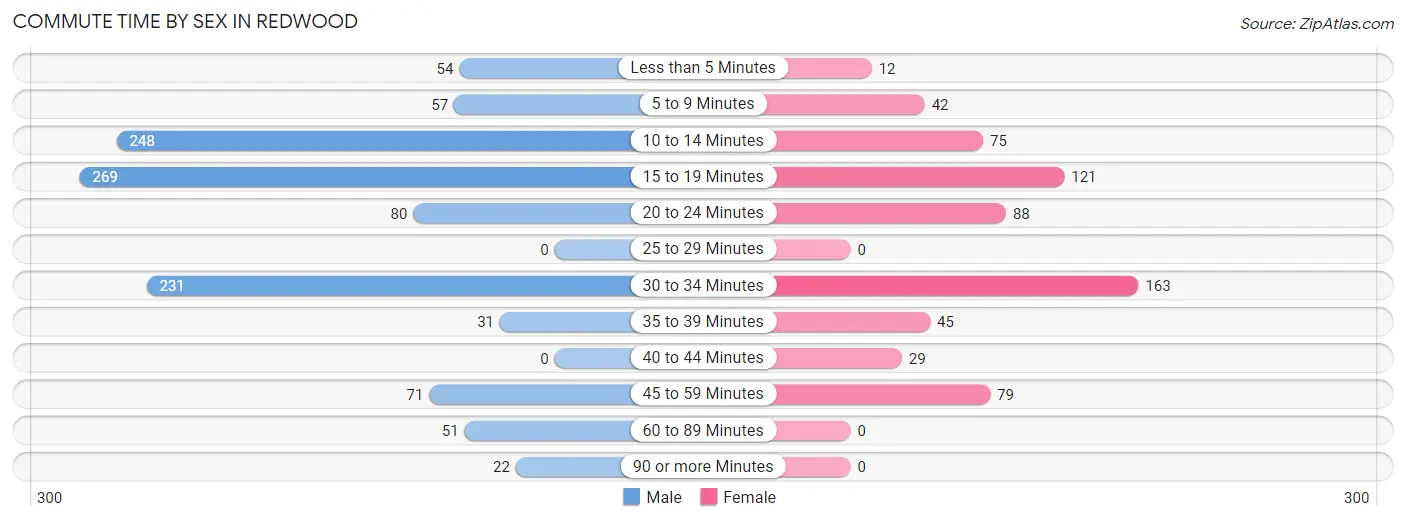
| Commute Time | Male | Female |
| Less than 5 Minutes | 54 (4.9%) | 12 (1.8%) |
| 5 to 9 Minutes | 57 (5.1%) | 42 (6.4%) |
| 10 to 14 Minutes | 248 (22.3%) | 75 (11.5%) |
| 15 to 19 Minutes | 269 (24.1%) | 121 (18.5%) |
| 20 to 24 Minutes | 80 (7.2%) | 88 (13.5%) |
| 25 to 29 Minutes | 0 (0.0%) | 0 (0.0%) |
| 30 to 34 Minutes | 231 (20.7%) | 163 (24.9%) |
| 35 to 39 Minutes | 31 (2.8%) | 45 (6.9%) |
| 40 to 44 Minutes | 0 (0.0%) | 29 (4.4%) |
| 45 to 59 Minutes | 71 (6.4%) | 79 (12.1%) |
| 60 to 89 Minutes | 51 (4.6%) | 0 (0.0%) |
| 90 or more Minutes | 22 (2.0%) | 0 (0.0%) |
Time of Departure to Work by Sex in Redwood
The most frequent times of departure to work in Redwood are 12:00 AM to 4:59 AM (210, 18.9%) for males and 7:00 AM to 7:29 AM (166, 25.4%) for females.

| Time of Departure | Male | Female |
| 12:00 AM to 4:59 AM | 210 (18.9%) | 21 (3.2%) |
| 5:00 AM to 5:29 AM | 91 (8.2%) | 38 (5.8%) |
| 5:30 AM to 5:59 AM | 73 (6.6%) | 40 (6.1%) |
| 6:00 AM to 6:29 AM | 121 (10.9%) | 85 (13.0%) |
| 6:30 AM to 6:59 AM | 90 (8.1%) | 0 (0.0%) |
| 7:00 AM to 7:29 AM | 203 (18.2%) | 166 (25.4%) |
| 7:30 AM to 7:59 AM | 37 (3.3%) | 162 (24.8%) |
| 8:00 AM to 8:29 AM | 67 (6.0%) | 0 (0.0%) |
| 8:30 AM to 8:59 AM | 36 (3.2%) | 15 (2.3%) |
| 9:00 AM to 9:59 AM | 12 (1.1%) | 0 (0.0%) |
| 10:00 AM to 10:59 AM | 52 (4.7%) | 40 (6.1%) |
| 11:00 AM to 11:59 AM | 0 (0.0%) | 41 (6.3%) |
| 12:00 PM to 3:59 PM | 93 (8.4%) | 0 (0.0%) |
| 4:00 PM to 11:59 PM | 29 (2.6%) | 46 (7.0%) |
| Total | 1,114 (100.0%) | 654 (100.0%) |
Housing Occupancy in Redwood
Occupancy by Ownership in Redwood
Of the total 1,033 dwellings in Redwood, owner-occupied units account for 783 (75.8%), while renter-occupied units make up 250 (24.2%).
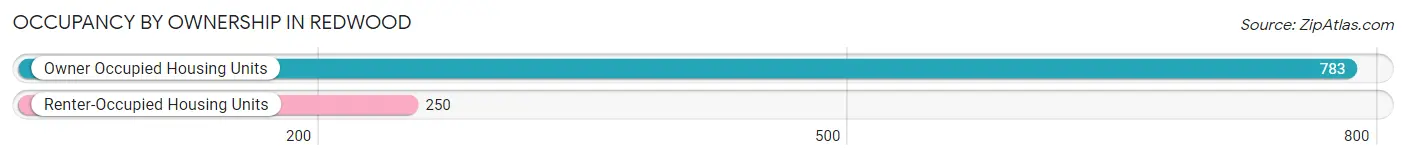
| Occupancy | # Housing Units | % Housing Units |
| Owner Occupied Housing Units | 783 | 75.8% |
| Renter-Occupied Housing Units | 250 | 24.2% |
| Total Occupied Housing Units | 1,033 | 100.0% |
Occupancy by Household Size in Redwood
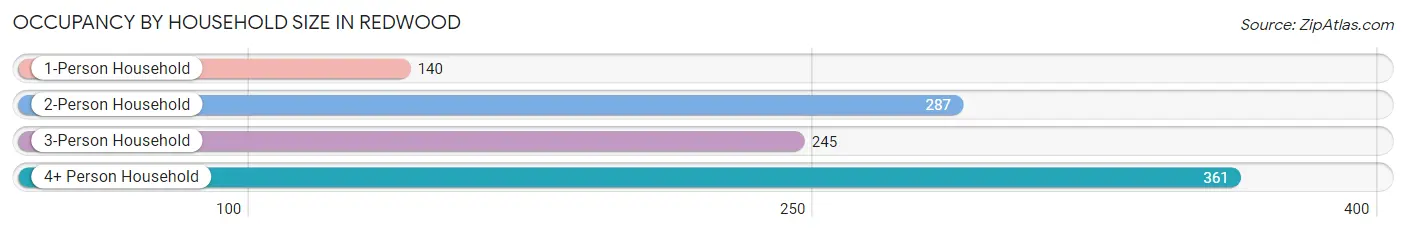
| Household Size | # Housing Units | % Housing Units |
| 1-Person Household | 140 | 13.6% |
| 2-Person Household | 287 | 27.8% |
| 3-Person Household | 245 | 23.7% |
| 4+ Person Household | 361 | 34.9% |
| Total Housing Units | 1,033 | 100.0% |
Occupancy by Ownership by Household Size in Redwood
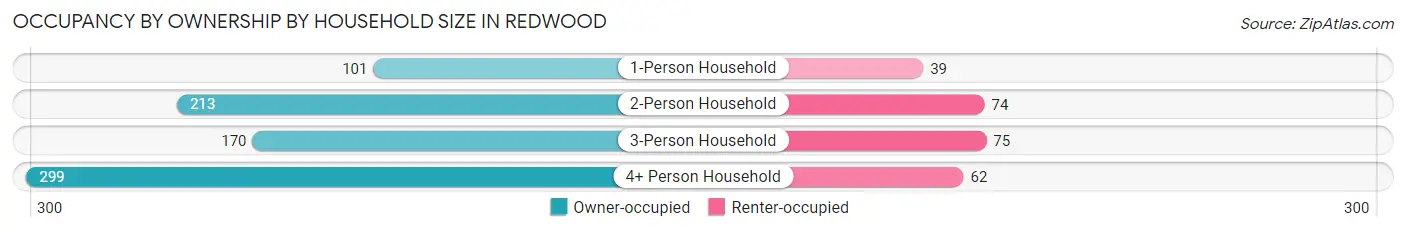
| Household Size | Owner-occupied | Renter-occupied |
| 1-Person Household | 101 (72.1%) | 39 (27.9%) |
| 2-Person Household | 213 (74.2%) | 74 (25.8%) |
| 3-Person Household | 170 (69.4%) | 75 (30.6%) |
| 4+ Person Household | 299 (82.8%) | 62 (17.2%) |
| Total Housing Units | 783 (75.8%) | 250 (24.2%) |
Occupancy by Educational Attainment in Redwood
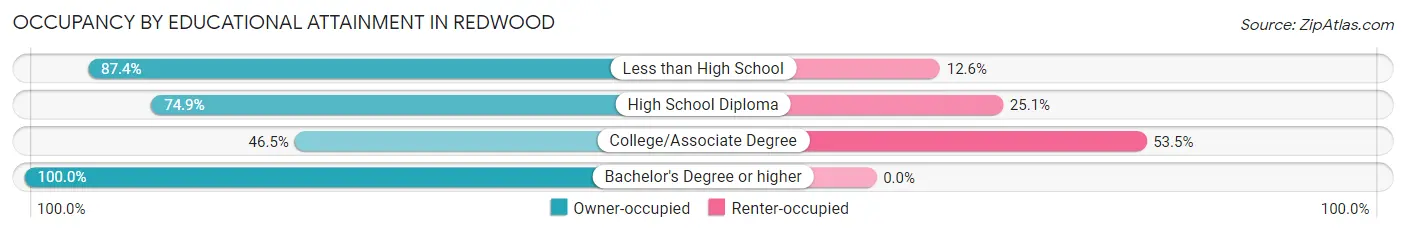
| Household Size | Owner-occupied | Renter-occupied |
| Less than High School | 305 (87.4%) | 44 (12.6%) |
| High School Diploma | 298 (74.9%) | 100 (25.1%) |
| College/Associate Degree | 92 (46.5%) | 106 (53.5%) |
| Bachelor's Degree or higher | 88 (100.0%) | 0 (0.0%) |
Occupancy by Age of Householder in Redwood
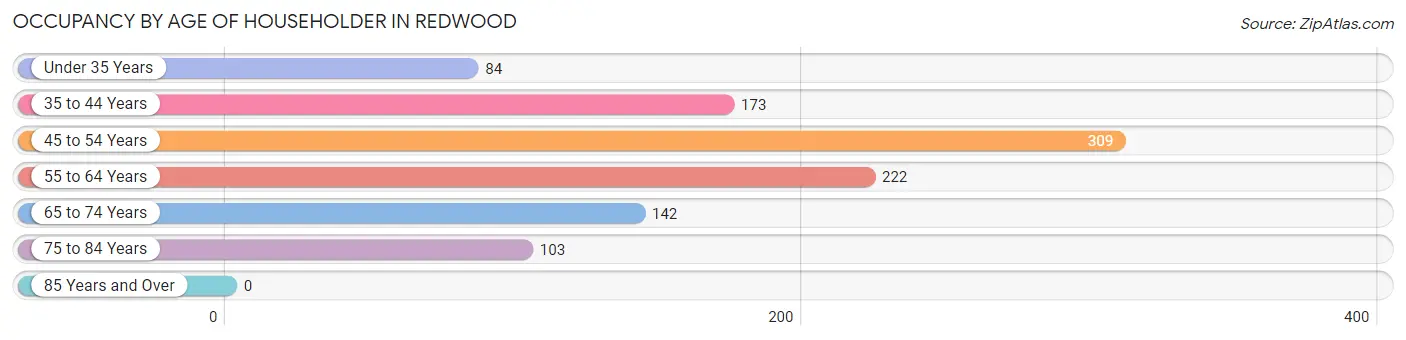
| Age Bracket | # Households | % Households |
| Under 35 Years | 84 | 8.1% |
| 35 to 44 Years | 173 | 16.8% |
| 45 to 54 Years | 309 | 29.9% |
| 55 to 64 Years | 222 | 21.5% |
| 65 to 74 Years | 142 | 13.8% |
| 75 to 84 Years | 103 | 10.0% |
| 85 Years and Over | 0 | 0.0% |
| Total | 1,033 | 100.0% |
Housing Finances in Redwood
Median Income by Occupancy in Redwood
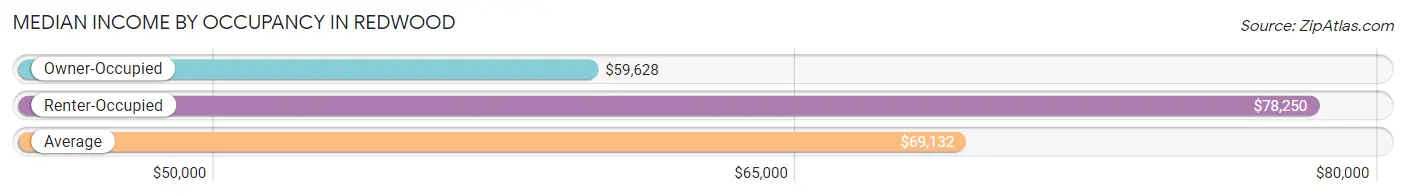
| Occupancy Type | # Households | Median Income |
| Owner-Occupied | 783 (75.8%) | $59,628 |
| Renter-Occupied | 250 (24.2%) | $78,250 |
| Average | 1,033 (100.0%) | $69,132 |
Occupancy by Householder Income Bracket in Redwood
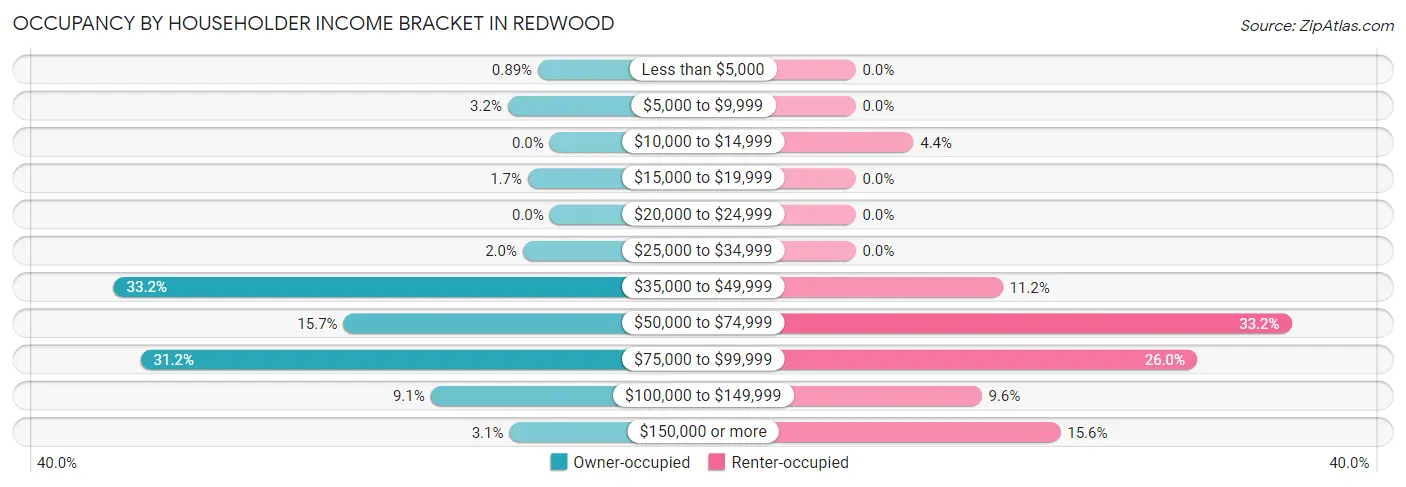
| Income Bracket | Owner-occupied | Renter-occupied |
| Less than $5,000 | 7 (0.9%) | 0 (0.0%) |
| $5,000 to $9,999 | 25 (3.2%) | 0 (0.0%) |
| $10,000 to $14,999 | 0 (0.0%) | 11 (4.4%) |
| $15,000 to $19,999 | 13 (1.7%) | 0 (0.0%) |
| $20,000 to $24,999 | 0 (0.0%) | 0 (0.0%) |
| $25,000 to $34,999 | 16 (2.0%) | 0 (0.0%) |
| $35,000 to $49,999 | 260 (33.2%) | 28 (11.2%) |
| $50,000 to $74,999 | 123 (15.7%) | 83 (33.2%) |
| $75,000 to $99,999 | 244 (31.2%) | 65 (26.0%) |
| $100,000 to $149,999 | 71 (9.1%) | 24 (9.6%) |
| $150,000 or more | 24 (3.1%) | 39 (15.6%) |
| Total | 783 (100.0%) | 250 (100.0%) |
Monthly Housing Cost Tiers in Redwood
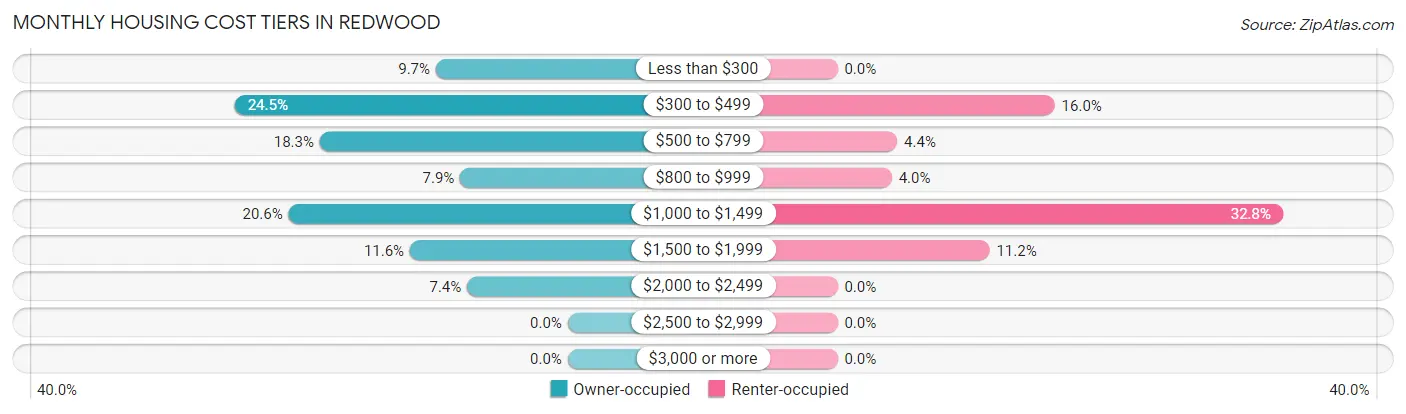
| Monthly Cost | Owner-occupied | Renter-occupied |
| Less than $300 | 76 (9.7%) | 0 (0.0%) |
| $300 to $499 | 192 (24.5%) | 40 (16.0%) |
| $500 to $799 | 143 (18.3%) | 11 (4.4%) |
| $800 to $999 | 62 (7.9%) | 10 (4.0%) |
| $1,000 to $1,499 | 161 (20.6%) | 82 (32.8%) |
| $1,500 to $1,999 | 91 (11.6%) | 28 (11.2%) |
| $2,000 to $2,499 | 58 (7.4%) | 0 (0.0%) |
| $2,500 to $2,999 | 0 (0.0%) | 0 (0.0%) |
| $3,000 or more | 0 (0.0%) | 0 (0.0%) |
| Total | 783 (100.0%) | 250 (100.0%) |
Physical Housing Characteristics in Redwood
Housing Structures in Redwood
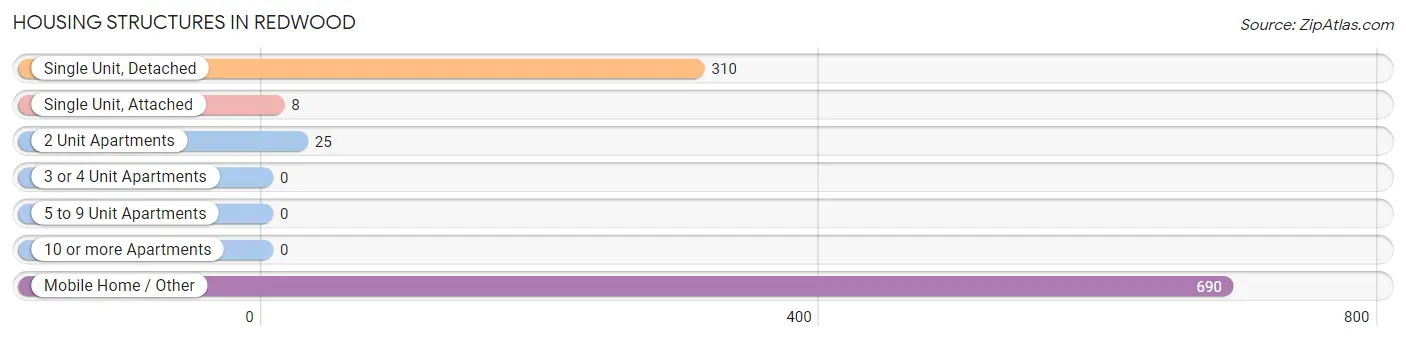
| Structure Type | # Housing Units | % Housing Units |
| Single Unit, Detached | 310 | 30.0% |
| Single Unit, Attached | 8 | 0.8% |
| 2 Unit Apartments | 25 | 2.4% |
| 3 or 4 Unit Apartments | 0 | 0.0% |
| 5 to 9 Unit Apartments | 0 | 0.0% |
| 10 or more Apartments | 0 | 0.0% |
| Mobile Home / Other | 690 | 66.8% |
| Total | 1,033 | 100.0% |
Housing Structures by Occupancy in Redwood
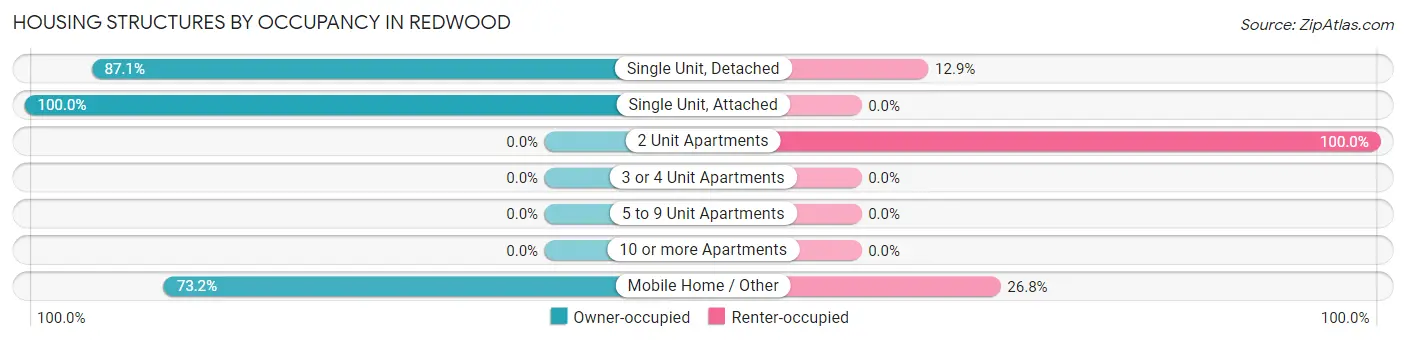
| Structure Type | Owner-occupied | Renter-occupied |
| Single Unit, Detached | 270 (87.1%) | 40 (12.9%) |
| Single Unit, Attached | 8 (100.0%) | 0 (0.0%) |
| 2 Unit Apartments | 0 (0.0%) | 25 (100.0%) |
| 3 or 4 Unit Apartments | 0 (0.0%) | 0 (0.0%) |
| 5 to 9 Unit Apartments | 0 (0.0%) | 0 (0.0%) |
| 10 or more Apartments | 0 (0.0%) | 0 (0.0%) |
| Mobile Home / Other | 505 (73.2%) | 185 (26.8%) |
| Total | 783 (75.8%) | 250 (24.2%) |
Housing Structures by Number of Rooms in Redwood
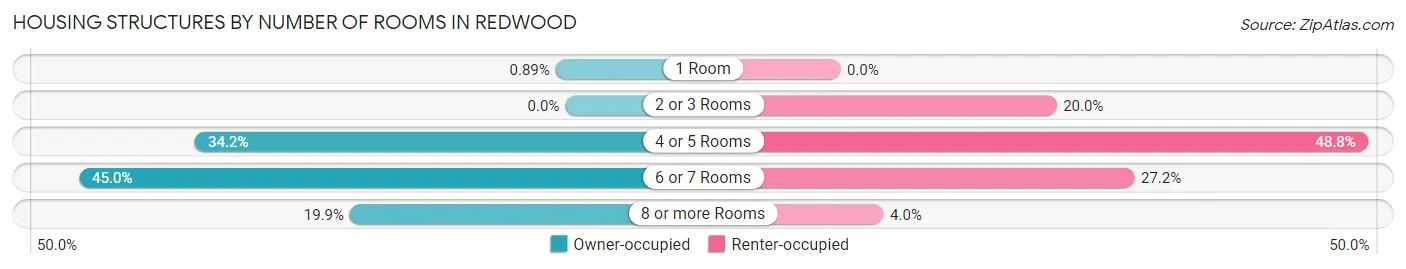
| Number of Rooms | Owner-occupied | Renter-occupied |
| 1 Room | 7 (0.9%) | 0 (0.0%) |
| 2 or 3 Rooms | 0 (0.0%) | 50 (20.0%) |
| 4 or 5 Rooms | 268 (34.2%) | 122 (48.8%) |
| 6 or 7 Rooms | 352 (45.0%) | 68 (27.2%) |
| 8 or more Rooms | 156 (19.9%) | 10 (4.0%) |
| Total | 783 (100.0%) | 250 (100.0%) |
Housing Structure by Heating Type in Redwood
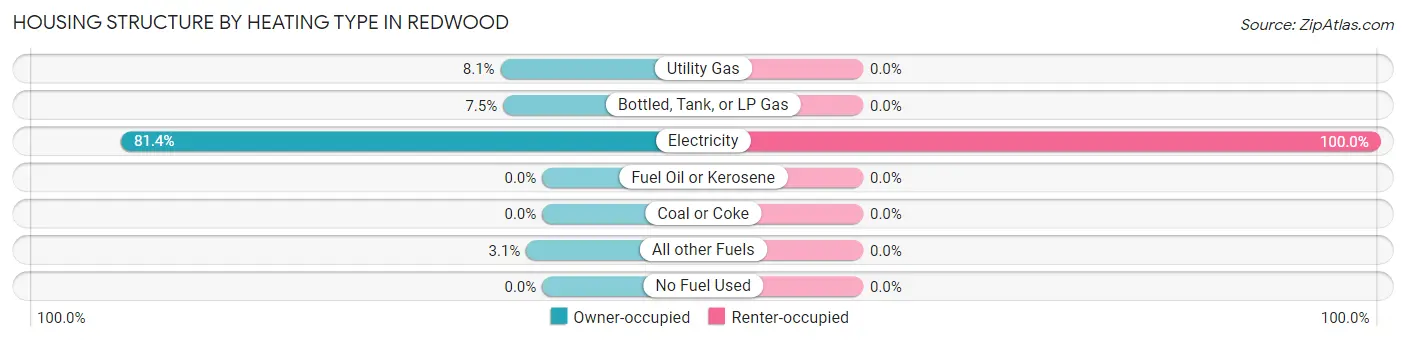
| Heating Type | Owner-occupied | Renter-occupied |
| Utility Gas | 63 (8.1%) | 0 (0.0%) |
| Bottled, Tank, or LP Gas | 59 (7.5%) | 0 (0.0%) |
| Electricity | 637 (81.4%) | 250 (100.0%) |
| Fuel Oil or Kerosene | 0 (0.0%) | 0 (0.0%) |
| Coal or Coke | 0 (0.0%) | 0 (0.0%) |
| All other Fuels | 24 (3.1%) | 0 (0.0%) |
| No Fuel Used | 0 (0.0%) | 0 (0.0%) |
| Total | 783 (100.0%) | 250 (100.0%) |
Household Vehicle Usage in Redwood
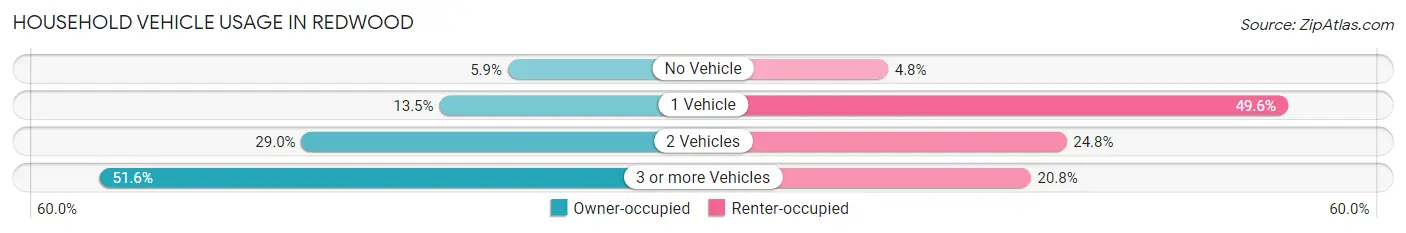
| Vehicles per Household | Owner-occupied | Renter-occupied |
| No Vehicle | 46 (5.9%) | 12 (4.8%) |
| 1 Vehicle | 106 (13.5%) | 124 (49.6%) |
| 2 Vehicles | 227 (29.0%) | 62 (24.8%) |
| 3 or more Vehicles | 404 (51.6%) | 52 (20.8%) |
| Total | 783 (100.0%) | 250 (100.0%) |
Real Estate & Mortgages in Redwood
Real Estate and Mortgage Overview in Redwood
| Characteristic | Without Mortgage | With Mortgage |
| Housing Units | 412 | 371 |
| Median Property Value | $155,700 | $137,600 |
| Median Household Income | $53,864 | $0 |
| Monthly Housing Costs | $454 | $0 |
| Real Estate Taxes | $1,583 | $0 |
Property Value by Mortgage Status in Redwood
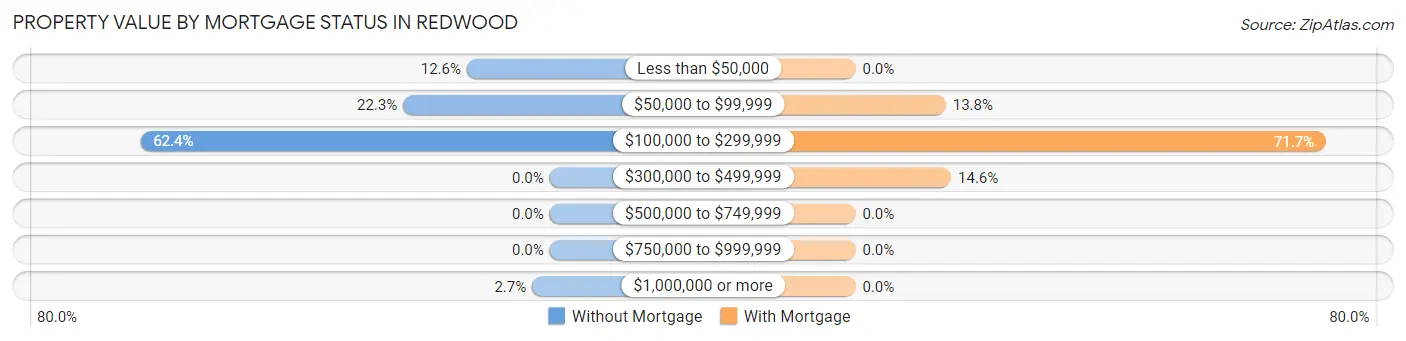
| Property Value | Without Mortgage | With Mortgage |
| Less than $50,000 | 52 (12.6%) | 0 (0.0%) |
| $50,000 to $99,999 | 92 (22.3%) | 51 (13.8%) |
| $100,000 to $299,999 | 257 (62.4%) | 266 (71.7%) |
| $300,000 to $499,999 | 0 (0.0%) | 54 (14.6%) |
| $500,000 to $749,999 | 0 (0.0%) | 0 (0.0%) |
| $750,000 to $999,999 | 0 (0.0%) | 0 (0.0%) |
| $1,000,000 or more | 11 (2.7%) | 0 (0.0%) |
| Total | 412 (100.0%) | 371 (100.0%) |
Household Income by Mortgage Status in Redwood
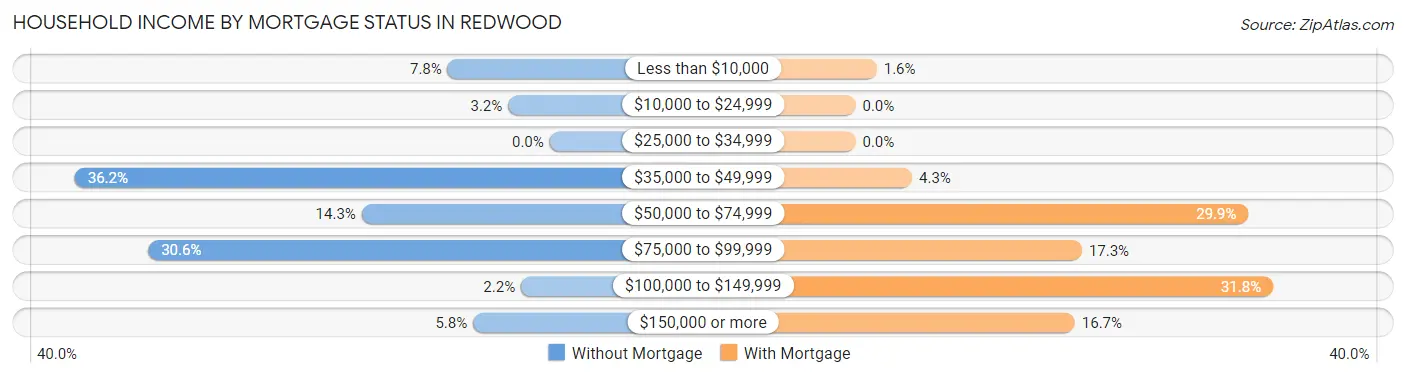
| Household Income | Without Mortgage | With Mortgage |
| Less than $10,000 | 32 (7.8%) | 6 (1.6%) |
| $10,000 to $24,999 | 13 (3.2%) | 0 (0.0%) |
| $25,000 to $34,999 | 0 (0.0%) | 0 (0.0%) |
| $35,000 to $49,999 | 149 (36.2%) | 16 (4.3%) |
| $50,000 to $74,999 | 59 (14.3%) | 111 (29.9%) |
| $75,000 to $99,999 | 126 (30.6%) | 64 (17.2%) |
| $100,000 to $149,999 | 9 (2.2%) | 118 (31.8%) |
| $150,000 or more | 24 (5.8%) | 62 (16.7%) |
| Total | 412 (100.0%) | 371 (100.0%) |
Property Value to Household Income Ratio in Redwood
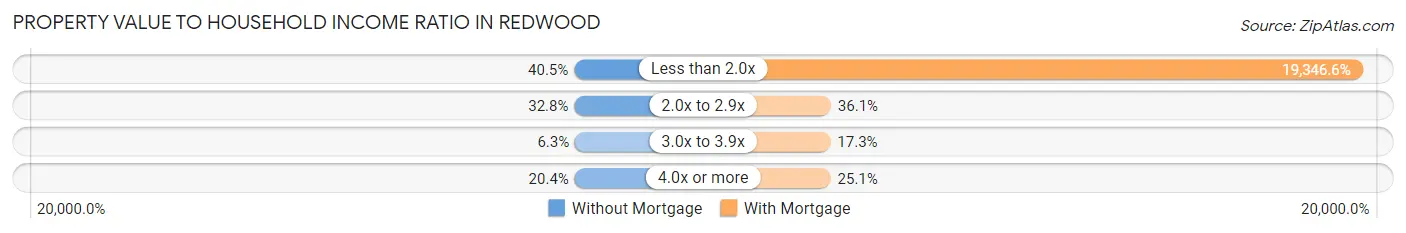
| Value-to-Income Ratio | Without Mortgage | With Mortgage |
| Less than 2.0x | 167 (40.5%) | 71,776 (19,346.6%) |
| 2.0x to 2.9x | 135 (32.8%) | 134 (36.1%) |
| 3.0x to 3.9x | 26 (6.3%) | 64 (17.2%) |
| 4.0x or more | 84 (20.4%) | 93 (25.1%) |
| Total | 412 (100.0%) | 371 (100.0%) |
Real Estate Taxes by Mortgage Status in Redwood
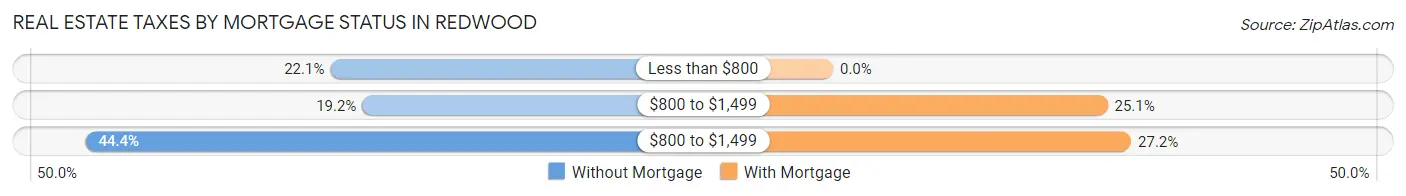
| Property Taxes | Without Mortgage | With Mortgage |
| Less than $800 | 91 (22.1%) | 0 (0.0%) |
| $800 to $1,499 | 79 (19.2%) | 93 (25.1%) |
| $800 to $1,499 | 183 (44.4%) | 101 (27.2%) |
| Total | 412 (100.0%) | 371 (100.0%) |
Health & Disability in Redwood
Health Insurance Coverage by Age in Redwood
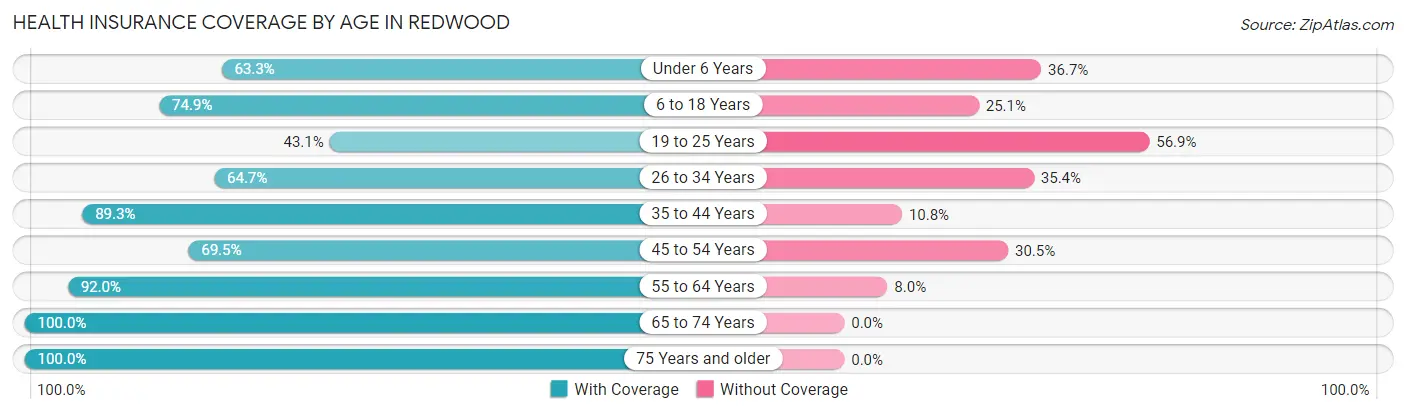
| Age Bracket | With Coverage | Without Coverage |
| Under 6 Years | 50 (63.3%) | 29 (36.7%) |
| 6 to 18 Years | 460 (74.9%) | 154 (25.1%) |
| 19 to 25 Years | 157 (43.1%) | 207 (56.9%) |
| 26 to 34 Years | 214 (64.6%) | 117 (35.3%) |
| 35 to 44 Years | 523 (89.2%) | 63 (10.7%) |
| 45 to 54 Years | 430 (69.5%) | 189 (30.5%) |
| 55 to 64 Years | 412 (92.0%) | 36 (8.0%) |
| 65 to 74 Years | 234 (100.0%) | 0 (0.0%) |
| 75 Years and older | 148 (100.0%) | 0 (0.0%) |
| Total | 2,628 (76.8%) | 795 (23.2%) |
Health Insurance Coverage by Citizenship Status in Redwood
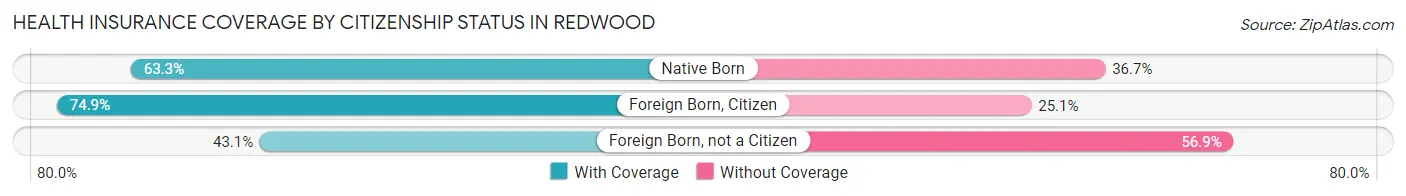
| Citizenship Status | With Coverage | Without Coverage |
| Native Born | 50 (63.3%) | 29 (36.7%) |
| Foreign Born, Citizen | 460 (74.9%) | 154 (25.1%) |
| Foreign Born, not a Citizen | 157 (43.1%) | 207 (56.9%) |
Health Insurance Coverage by Household Income in Redwood
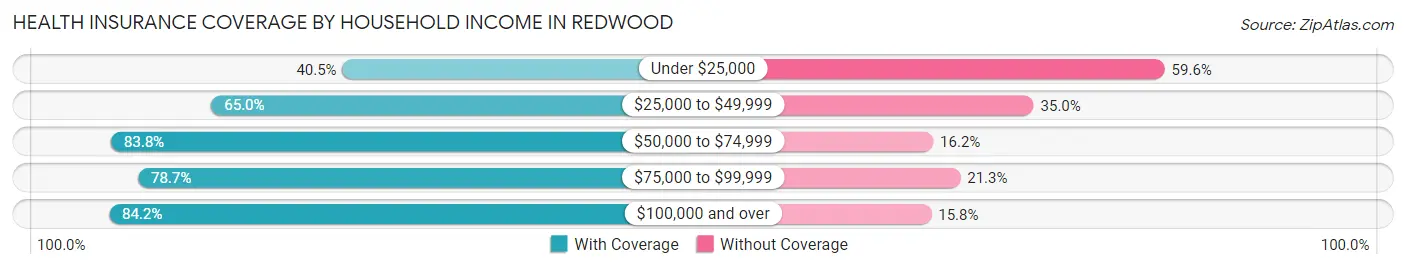
| Household Income | With Coverage | Without Coverage |
| Under $25,000 | 36 (40.5%) | 53 (59.6%) |
| $25,000 to $49,999 | 494 (65.0%) | 266 (35.0%) |
| $50,000 to $74,999 | 518 (83.8%) | 100 (16.2%) |
| $75,000 to $99,999 | 963 (78.7%) | 260 (21.3%) |
| $100,000 and over | 617 (84.2%) | 116 (15.8%) |
Public vs Private Health Insurance Coverage by Age in Redwood
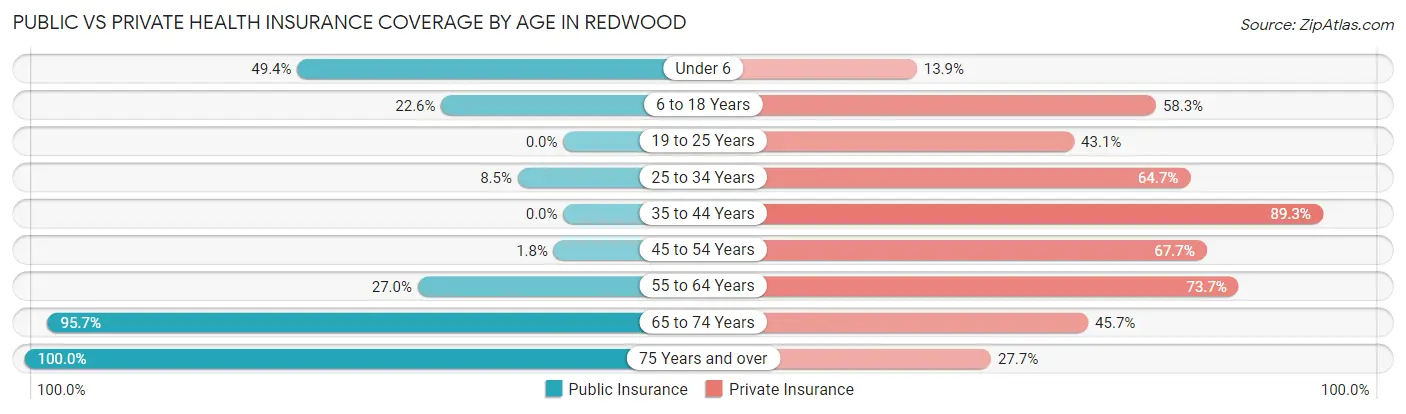
| Age Bracket | Public Insurance | Private Insurance |
| Under 6 | 39 (49.4%) | 11 (13.9%) |
| 6 to 18 Years | 139 (22.6%) | 358 (58.3%) |
| 19 to 25 Years | 0 (0.0%) | 157 (43.1%) |
| 25 to 34 Years | 28 (8.5%) | 214 (64.6%) |
| 35 to 44 Years | 0 (0.0%) | 523 (89.2%) |
| 45 to 54 Years | 11 (1.8%) | 419 (67.7%) |
| 55 to 64 Years | 121 (27.0%) | 330 (73.7%) |
| 65 to 74 Years | 224 (95.7%) | 107 (45.7%) |
| 75 Years and over | 148 (100.0%) | 41 (27.7%) |
| Total | 710 (20.7%) | 2,160 (63.1%) |
Disability Status by Sex by Age in Redwood
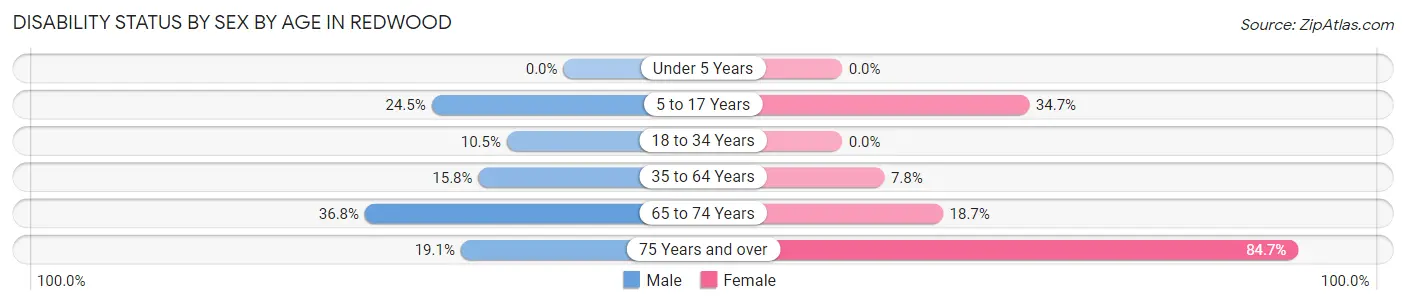
| Age Bracket | Male | Female |
| Under 5 Years | 0 (0.0%) | 0 (0.0%) |
| 5 to 17 Years | 92 (24.5%) | 91 (34.7%) |
| 18 to 34 Years | 44 (10.5%) | 0 (0.0%) |
| 35 to 64 Years | 148 (15.8%) | 56 (7.8%) |
| 65 to 74 Years | 35 (36.8%) | 26 (18.7%) |
| 75 Years and over | 12 (19.1%) | 72 (84.7%) |
Disability Class by Sex by Age in Redwood
Disability Class: Hearing Difficulty
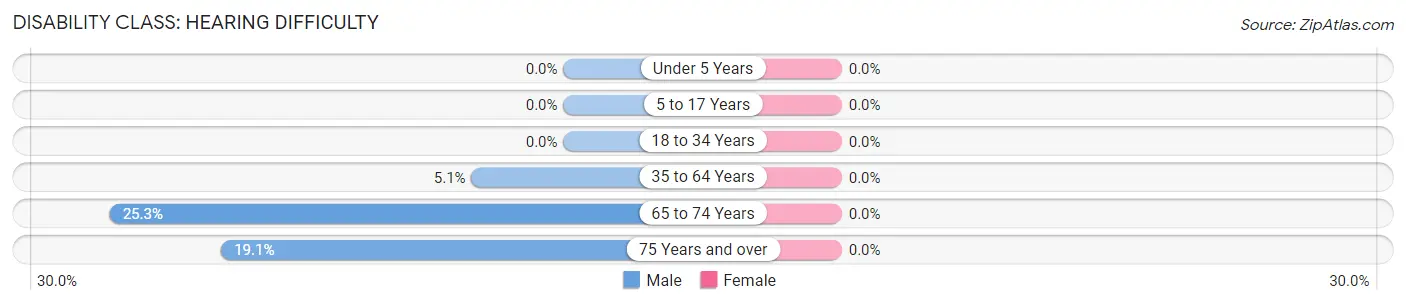
| Age Bracket | Male | Female |
| Under 5 Years | 0 (0.0%) | 0 (0.0%) |
| 5 to 17 Years | 0 (0.0%) | 0 (0.0%) |
| 18 to 34 Years | 0 (0.0%) | 0 (0.0%) |
| 35 to 64 Years | 48 (5.1%) | 0 (0.0%) |
| 65 to 74 Years | 24 (25.3%) | 0 (0.0%) |
| 75 Years and over | 12 (19.1%) | 0 (0.0%) |
Disability Class: Vision Difficulty
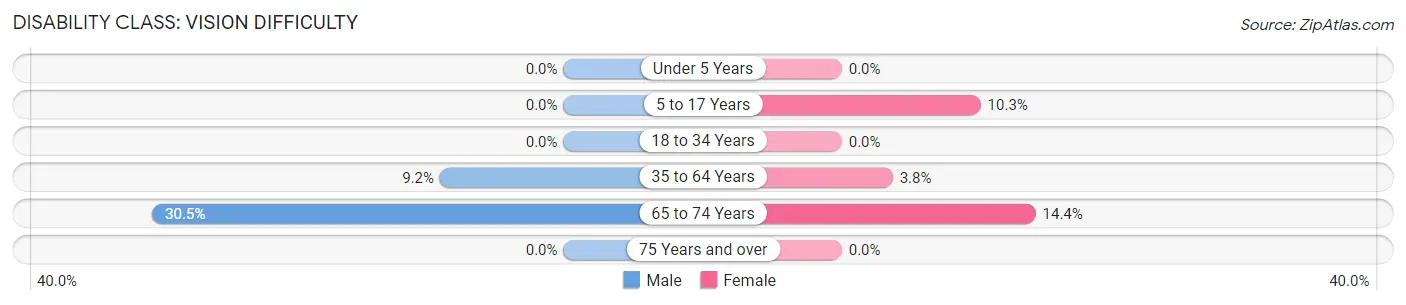
| Age Bracket | Male | Female |
| Under 5 Years | 0 (0.0%) | 0 (0.0%) |
| 5 to 17 Years | 0 (0.0%) | 27 (10.3%) |
| 18 to 34 Years | 0 (0.0%) | 0 (0.0%) |
| 35 to 64 Years | 86 (9.2%) | 27 (3.8%) |
| 65 to 74 Years | 29 (30.5%) | 20 (14.4%) |
| 75 Years and over | 0 (0.0%) | 0 (0.0%) |
Disability Class: Cognitive Difficulty
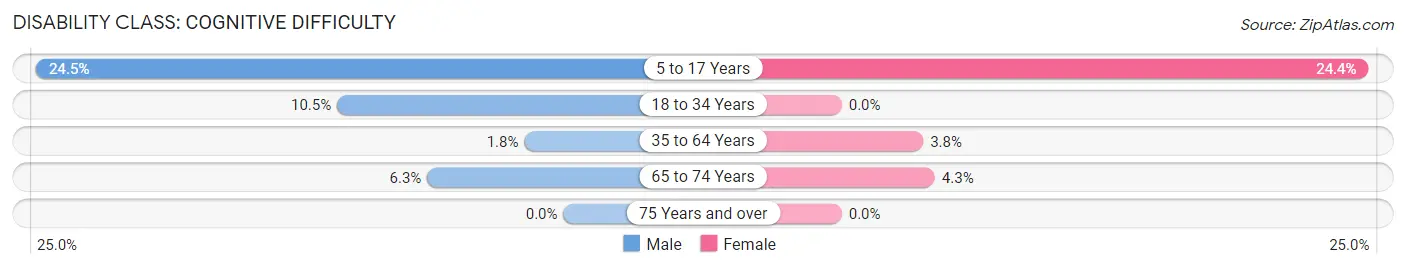
| Age Bracket | Male | Female |
| 5 to 17 Years | 92 (24.5%) | 64 (24.4%) |
| 18 to 34 Years | 44 (10.5%) | 0 (0.0%) |
| 35 to 64 Years | 17 (1.8%) | 27 (3.8%) |
| 65 to 74 Years | 6 (6.3%) | 6 (4.3%) |
| 75 Years and over | 0 (0.0%) | 0 (0.0%) |
Disability Class: Ambulatory Difficulty
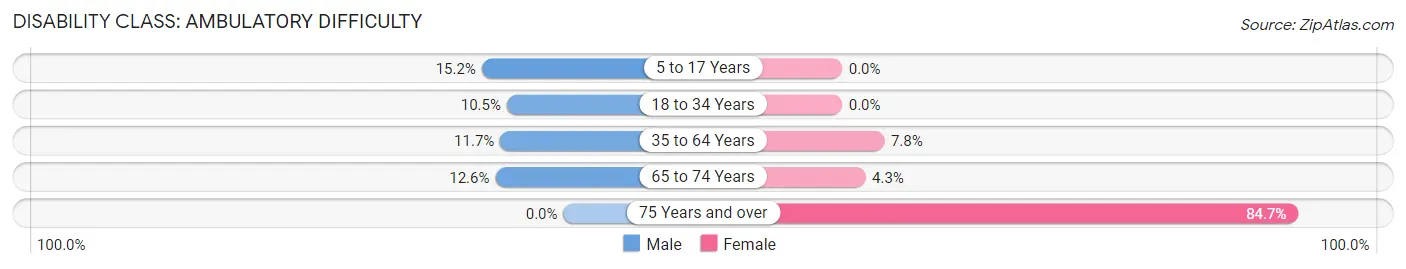
| Age Bracket | Male | Female |
| 5 to 17 Years | 57 (15.2%) | 0 (0.0%) |
| 18 to 34 Years | 44 (10.5%) | 0 (0.0%) |
| 35 to 64 Years | 110 (11.7%) | 56 (7.8%) |
| 65 to 74 Years | 12 (12.6%) | 6 (4.3%) |
| 75 Years and over | 0 (0.0%) | 72 (84.7%) |
Disability Class: Self-Care Difficulty
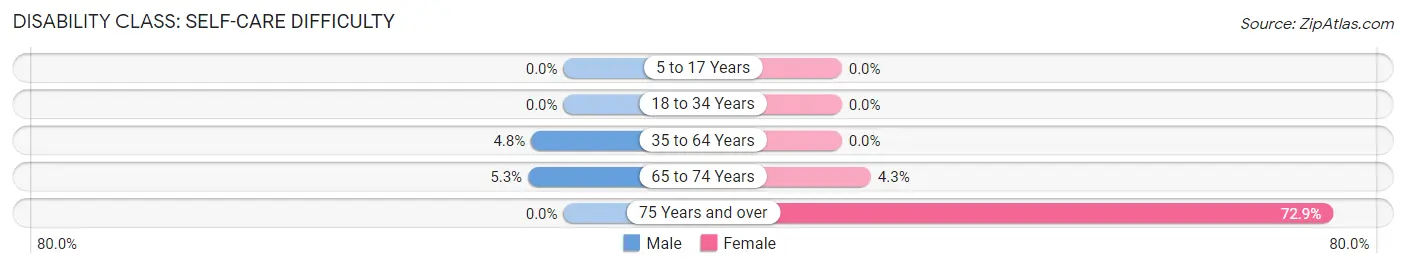
| Age Bracket | Male | Female |
| 5 to 17 Years | 0 (0.0%) | 0 (0.0%) |
| 18 to 34 Years | 0 (0.0%) | 0 (0.0%) |
| 35 to 64 Years | 45 (4.8%) | 0 (0.0%) |
| 65 to 74 Years | 5 (5.3%) | 6 (4.3%) |
| 75 Years and over | 0 (0.0%) | 62 (72.9%) |
Technology Access in Redwood
Computing Device Access in Redwood
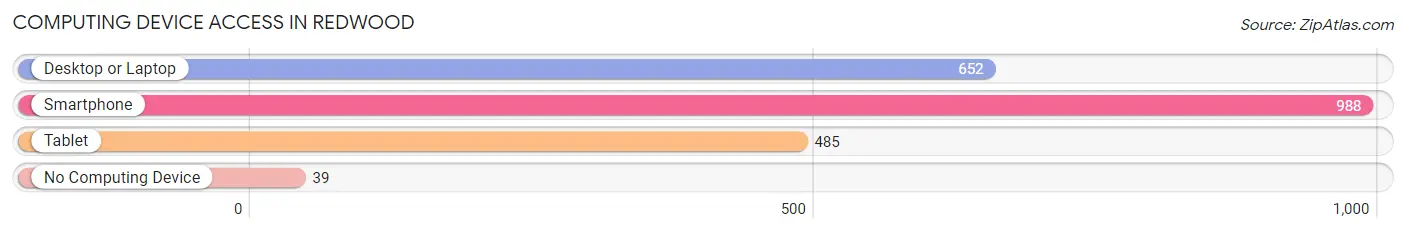
| Device Type | # Households | % Households |
| Desktop or Laptop | 652 | 63.1% |
| Smartphone | 988 | 95.6% |
| Tablet | 485 | 46.9% |
| No Computing Device | 39 | 3.8% |
| Total | 1,033 | 100.0% |
Internet Access in Redwood
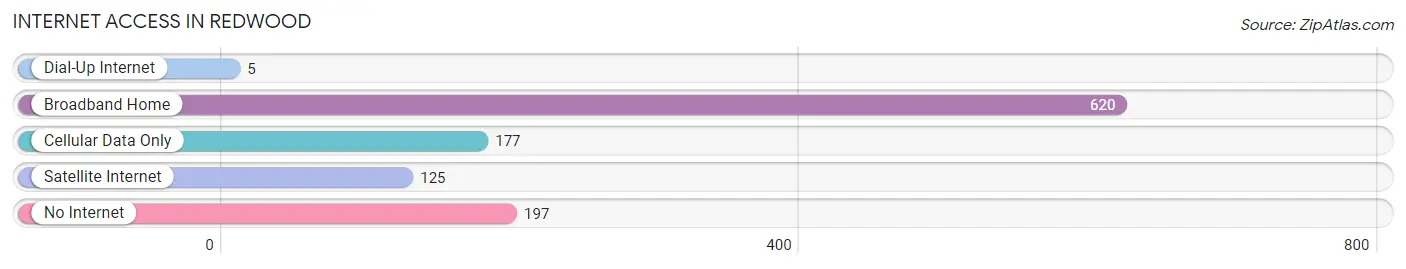
| Internet Type | # Households | % Households |
| Dial-Up Internet | 5 | 0.5% |
| Broadband Home | 620 | 60.0% |
| Cellular Data Only | 177 | 17.1% |
| Satellite Internet | 125 | 12.1% |
| No Internet | 197 | 19.1% |
| Total | 1,033 | 100.0% |
Redwood Summary
Redwood, Texas is a small town located in the southeastern corner of Texas, in the county of Redwood. It is situated on the banks of the Red River, which forms the border between Texas and Oklahoma. The town has a population of just over 1,000 people, and is part of the Texarkana metropolitan area.
History
The area that is now Redwood was first settled in the late 1800s by a group of settlers from the nearby town of Texarkana. The settlers were looking for a place to settle and farm, and the fertile soil and abundant water of the Red River made it an ideal location. The town was officially founded in 1891, and was named after the redwood trees that grew in the area.
The town grew slowly, but steadily, and by the early 1900s it had become a thriving agricultural community. The town was home to several cotton gins, a sawmill, and a number of other businesses. The town also had a school, a post office, and a number of churches.
In the 1920s, the town began to experience a decline in population as many of the residents moved away to larger cities. This trend continued until the 1950s, when the town began to experience a resurgence in population. This was due in part to the construction of a new bridge over the Red River, which allowed for easier access to the town.
Geography
Redwood is located in the southeastern corner of Texas, in the county of Redwood. It is situated on the banks of the Red River, which forms the border between Texas and Oklahoma. The town is located about 25 miles south of Texarkana, and about 50 miles north of Shreveport, Louisiana.
The town is situated in a flat, open area, with the Red River to the east and the Sabine River to the west. The town is surrounded by farmland, and is home to a number of small lakes and ponds. The climate in Redwood is generally mild, with hot summers and mild winters.
Economy
The economy of Redwood is largely based on agriculture. The town is home to several cotton gins, as well as a number of other agricultural businesses. The town also has a number of small businesses, including a few restaurants, a grocery store, and a few other retail stores.
The town is also home to a number of small manufacturing businesses, including a furniture factory and a metal fabrication plant. The town is also home to a number of small service businesses, including a few auto repair shops and a few small construction companies.
Demographics
As of the 2010 census, the population of Redwood was 1,072. The racial makeup of the town was 94.3% White, 0.7% African American, 0.3% Native American, 0.2% Asian, 0.1% Pacific Islander, and 4.4% from other races. The median household income in Redwood was $37,917, and the median family income was $45,625.
Conclusion
Redwood, Texas is a small town located in the southeastern corner of Texas, in the county of Redwood. It is situated on the banks of the Red River, which forms the border between Texas and Oklahoma. The town has a population of just over 1,000 people, and is part of the Texarkana metropolitan area. The economy of Redwood is largely based on agriculture, and the town is home to a number of small businesses. The racial makeup of the town is predominantly White, with a small percentage of African American, Native American, Asian, and Pacific Islander residents. The median household income in Redwood is $37,917, and the median family income is $45,625.
Common Questions
What is the Total Population of Redwood?
Total Population of Redwood is 3,423.
What is the Total Male Population of Redwood?
Total Male Population of Redwood is 1,921.
What is the Total Female Population of Redwood?
Total Female Population of Redwood is 1,502.
What is the Ratio of Males per 100 Females in Redwood?
There are 127.90 Males per 100 Females in Redwood.
What is the Ratio of Females per 100 Males in Redwood?
There are 78.19 Females per 100 Males in Redwood.
What is the Median Population Age in Redwood?
Median Population Age in Redwood is 40.2 Years.
What is the Average Family Size in Redwood
Average Family Size in Redwood is 3.8 People.
What is the Average Household Size in Redwood
Average Household Size in Redwood is 3.3 People.
What is Per Capita Income in Redwood?
Per Capita income in Redwood is $25,593.
What is the Median Family Income in Redwood?
Median Family Income in Redwood is $77,273.
What is the Median Household income in Redwood?
Median Household Income in Redwood is $69,132.
What is Income or Wage Gap in Redwood?
Income or Wage Gap in Redwood is 33.2%.
Women in Redwood earn 66.8 cents for every dollar earned by a man.
What is Inequality or Gini Index in Redwood?
Inequality or Gini Index in Redwood is 0.31.
How Large is the Labor Force in Redwood?
There are 2,036 People in the Labor Forcein in Redwood.
What is the Percentage of People in the Labor Force in Redwood?
71.2% of People are in the Labor Force in Redwood.
What is the Unemployment Rate in Redwood?
Unemployment Rate in Redwood is 6.7%.