Cities with the Most Immigrants from Sri Lanka in Texas
RELATED REPORTS & OPTIONS
Sri Lanka
Texas
Compare Cities
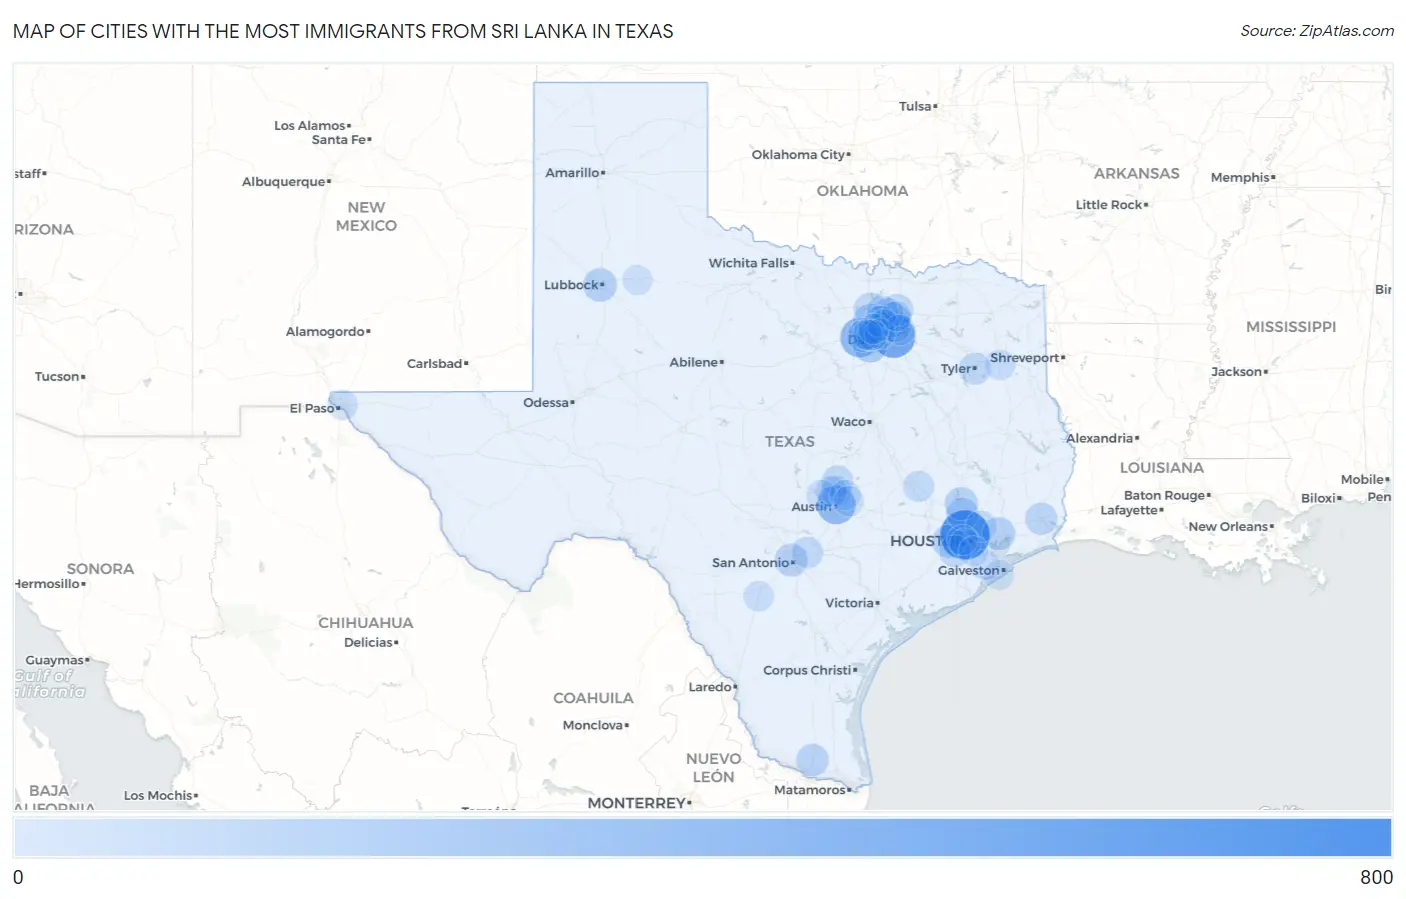
Map of Cities with the Most Immigrants from Sri Lanka in Texas
0
800
Cities with the Most Immigrants from Sri Lanka in Texas
| City | Sri Lanka | vs State | vs National | |
| 1. | Houston | 727 | 5,523(13.16%)#1 | 56,619(1.28%)#3 |
| 2. | Dallas | 486 | 5,523(8.80%)#2 | 56,619(0.86%)#5 |
| 3. | Fort Worth | 341 | 5,523(6.17%)#3 | 56,619(0.60%)#10 |
| 4. | Austin | 310 | 5,523(5.61%)#4 | 56,619(0.55%)#14 |
| 5. | Plano | 187 | 5,523(3.39%)#5 | 56,619(0.33%)#34 |
| 6. | Arlington | 170 | 5,523(3.08%)#6 | 56,619(0.30%)#39 |
| 7. | Flower Mound | 147 | 5,523(2.66%)#7 | 56,619(0.26%)#51 |
| 8. | Lubbock | 127 | 5,523(2.30%)#8 | 56,619(0.22%)#62 |
| 9. | Conroe | 112 | 5,523(2.03%)#9 | 56,619(0.20%)#81 |
| 10. | Cinco Ranch | 111 | 5,523(2.01%)#10 | 56,619(0.20%)#82 |
| 11. | Mont Belvieu | 108 | 5,523(1.96%)#11 | 56,619(0.19%)#87 |
| 12. | San Antonio | 98 | 5,523(1.77%)#12 | 56,619(0.17%)#96 |
| 13. | Edinburg | 93 | 5,523(1.68%)#13 | 56,619(0.16%)#107 |
| 14. | The Woodlands | 85 | 5,523(1.54%)#14 | 56,619(0.15%)#121 |
| 15. | Beaumont | 78 | 5,523(1.41%)#15 | 56,619(0.14%)#136 |
| 16. | Denton | 66 | 5,523(1.20%)#16 | 56,619(0.12%)#169 |
| 17. | Mckinney | 65 | 5,523(1.18%)#17 | 56,619(0.11%)#173 |
| 18. | Tyler | 65 | 5,523(1.18%)#18 | 56,619(0.11%)#174 |
| 19. | Richardson | 62 | 5,523(1.12%)#19 | 56,619(0.11%)#185 |
| 20. | Coppell | 61 | 5,523(1.10%)#20 | 56,619(0.11%)#193 |
| 21. | Sugar Land | 60 | 5,523(1.09%)#21 | 56,619(0.11%)#194 |
| 22. | Georgetown | 58 | 5,523(1.05%)#22 | 56,619(0.10%)#203 |
| 23. | Frisco | 55 | 5,523(1.00%)#23 | 56,619(0.10%)#212 |
| 24. | Bedford | 48 | 5,523(0.87%)#24 | 56,619(0.08%)#251 |
| 25. | North Richland Hills | 45 | 5,523(0.81%)#25 | 56,619(0.08%)#266 |
| 26. | Little Elm | 45 | 5,523(0.81%)#26 | 56,619(0.08%)#267 |
| 27. | Schertz | 45 | 5,523(0.81%)#27 | 56,619(0.08%)#269 |
| 28. | Haltom City | 44 | 5,523(0.80%)#28 | 56,619(0.08%)#273 |
| 29. | Lewisville | 42 | 5,523(0.76%)#29 | 56,619(0.07%)#293 |
| 30. | Atascocita | 37 | 5,523(0.67%)#30 | 56,619(0.07%)#323 |
| 31. | Carrollton | 34 | 5,523(0.62%)#31 | 56,619(0.06%)#342 |
| 32. | Brushy Creek | 34 | 5,523(0.62%)#32 | 56,619(0.06%)#354 |
| 33. | College Station | 33 | 5,523(0.60%)#33 | 56,619(0.06%)#363 |
| 34. | Cedar Park | 29 | 5,523(0.53%)#34 | 56,619(0.05%)#395 |
| 35. | Garland | 22 | 5,523(0.40%)#35 | 56,619(0.04%)#474 |
| 36. | Kilgore | 17 | 5,523(0.31%)#36 | 56,619(0.03%)#564 |
| 37. | Pflugerville | 15 | 5,523(0.27%)#37 | 56,619(0.03%)#590 |
| 38. | El Paso | 14 | 5,523(0.25%)#38 | 56,619(0.02%)#604 |
| 39. | Lago Vista | 13 | 5,523(0.24%)#39 | 56,619(0.02%)#646 |
| 40. | Manor | 11 | 5,523(0.20%)#40 | 56,619(0.02%)#688 |
| 41. | Santa Fe | 11 | 5,523(0.20%)#41 | 56,619(0.02%)#690 |
| 42. | Pearsall | 11 | 5,523(0.20%)#42 | 56,619(0.02%)#692 |
| 43. | Irving | 10 | 5,523(0.18%)#43 | 56,619(0.02%)#698 |
| 44. | Euless | 10 | 5,523(0.18%)#44 | 56,619(0.02%)#713 |
| 45. | Bellaire | 10 | 5,523(0.18%)#45 | 56,619(0.02%)#721 |
| 46. | Hurst | 9 | 5,523(0.16%)#46 | 56,619(0.02%)#734 |
| 47. | Grapevine | 6 | 5,523(0.11%)#47 | 56,619(0.01%)#791 |
| 48. | Allen | 5 | 5,523(0.09%)#48 | 56,619(0.01%)#805 |
| 49. | Piney Point Village | 5 | 5,523(0.09%)#49 | 56,619(0.01%)#810 |
| 50. | Brookside Village | 3 | 5,523(0.05%)#50 | 56,619(0.01%)#835 |
| 51. | Crosbyton | 2 | 5,523(0.04%)#51 | 56,619(0.00%)#850 |
| 52. | Galveston | 1 | 5,523(0.02%)#52 | 56,619(0.00%)#860 |
Common Questions
What are the Top 10 Cities with the Most Immigrants from Sri Lanka in Texas?
Top 10 Cities with the Most Immigrants from Sri Lanka in Texas are:
#1
727
#2
486
#3
341
#4
310
#5
187
#6
170
#7
147
#8
127
#9
112
#10
111
What city has the Most Immigrants from Sri Lanka in Texas?
Houston has the Most Immigrants from Sri Lanka in Texas with 727.
What is the Total Immigrants from Sri Lanka in the State of Texas?
Total Immigrants from Sri Lanka in Texas is 5,523.
What is the Total Immigrants from Sri Lanka in the United States?
Total Immigrants from Sri Lanka in the United States is 56,619.