Cities with the Highest Percentage of Population Employed in Accommodation & Food Services in Texas
RELATED REPORTS & OPTIONS
Accommodation & Food Services
Texas
Compare Cities
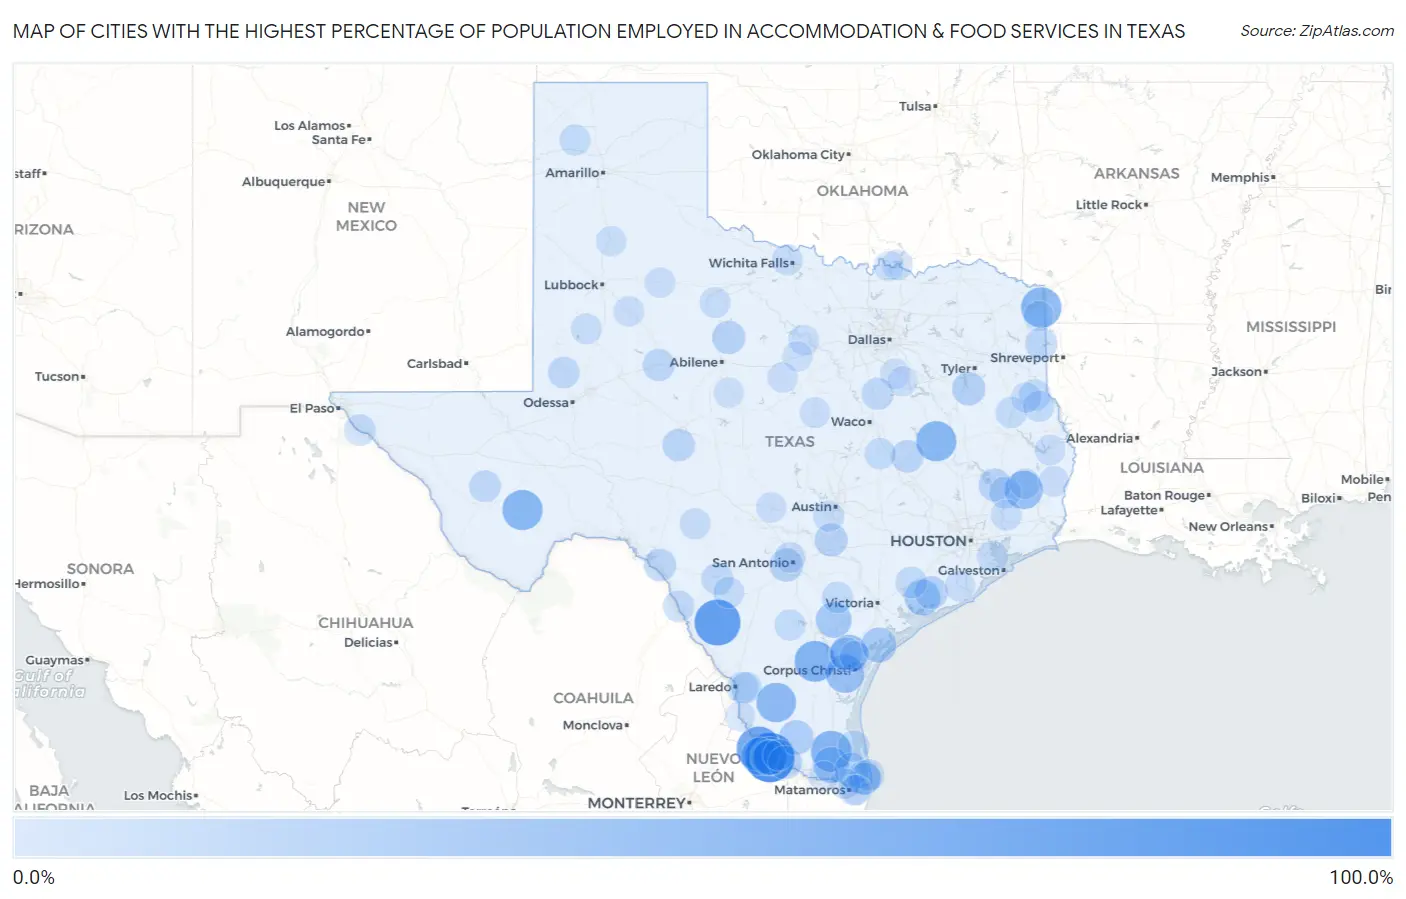
Map of Cities with the Highest Percentage of Population Employed in Accommodation & Food Services in Texas
0.0%
100.0%
Cities with the Highest Percentage of Population Employed in Accommodation & Food Services in Texas
| City | % Employed | vs State | vs National | |
| 1. | La Moca Ranch | 100.0% | 7.2%(+92.8)#1 | 6.9%(+93.1)#21 |
| 2. | Palo Blanco | 100.0% | 7.2%(+92.8)#2 | 6.9%(+93.1)#27 |
| 3. | Carrizo Hill | 84.0% | 7.2%(+76.8)#3 | 6.9%(+77.2)#41 |
| 4. | La Loma De Falcon | 76.9% | 7.2%(+69.7)#4 | 6.9%(+70.0)#47 |
| 5. | Amargosa | 62.0% | 7.2%(+54.8)#5 | 6.9%(+55.1)#80 |
| 6. | Ranchette Estates | 61.7% | 7.2%(+54.5)#6 | 6.9%(+54.8)#81 |
| 7. | Domino | 60.0% | 7.2%(+52.8)#7 | 6.9%(+53.1)#91 |
| 8. | Centerville | 59.2% | 7.2%(+52.0)#8 | 6.9%(+52.4)#97 |
| 9. | Marathon | 59.1% | 7.2%(+51.9)#9 | 6.9%(+52.2)#98 |
| 10. | Thompsonville | 56.5% | 7.2%(+49.3)#10 | 6.9%(+49.6)#112 |
| 11. | Benjamin Perez | 52.9% | 7.2%(+45.7)#11 | 6.9%(+46.0)#131 |
| 12. | Wildwood | 50.5% | 7.2%(+43.3)#12 | 6.9%(+43.6)#148 |
| 13. | Tierra Grande | 50.0% | 7.2%(+42.8)#13 | 6.9%(+43.1)#159 |
| 14. | Del Sol | 49.6% | 7.2%(+42.4)#14 | 6.9%(+42.7)#172 |
| 15. | Sunset Cdp Montague County | 49.2% | 7.2%(+42.0)#15 | 6.9%(+42.3)#175 |
| 16. | Guadalupe Guerra | 48.5% | 7.2%(+41.3)#16 | 6.9%(+41.6)#182 |
| 17. | Briggs | 47.6% | 7.2%(+40.4)#17 | 6.9%(+40.7)#188 |
| 18. | Tierra Bonita | 40.6% | 7.2%(+33.4)#18 | 6.9%(+33.7)#259 |
| 19. | Blessing | 40.0% | 7.2%(+32.8)#19 | 6.9%(+33.1)#263 |
| 20. | Normanna | 40.0% | 7.2%(+32.8)#20 | 6.9%(+33.1)#266 |
| 21. | Campo Verde | 39.9% | 7.2%(+32.7)#21 | 6.9%(+33.0)#267 |
| 22. | Myra | 37.3% | 7.2%(+30.1)#22 | 6.9%(+30.4)#306 |
| 23. | Lamar | 37.3% | 7.2%(+30.1)#23 | 6.9%(+30.4)#307 |
| 24. | San Isidro | 35.2% | 7.2%(+28.0)#24 | 6.9%(+28.3)#351 |
| 25. | El Quiote | 33.3% | 7.2%(+26.1)#25 | 6.9%(+26.5)#384 |
| 26. | La Tina Ranch | 31.6% | 7.2%(+24.4)#26 | 6.9%(+24.7)#428 |
| 27. | Laguna Heights | 31.3% | 7.2%(+24.1)#27 | 6.9%(+24.4)#443 |
| 28. | Villarreal | 31.1% | 7.2%(+23.9)#28 | 6.9%(+24.2)#449 |
| 29. | Cuney | 29.9% | 7.2%(+22.6)#29 | 6.9%(+23.0)#488 |
| 30. | Lackland Afb | 29.8% | 7.2%(+22.6)#30 | 6.9%(+22.9)#489 |
| 31. | Lueders | 29.7% | 7.2%(+22.5)#31 | 6.9%(+22.8)#493 |
| 32. | Staples | 28.8% | 7.2%(+21.6)#32 | 6.9%(+21.9)#521 |
| 33. | Tow | 28.6% | 7.2%(+21.4)#33 | 6.9%(+21.7)#537 |
| 34. | Salineno North | 28.6% | 7.2%(+21.4)#34 | 6.9%(+21.7)#539 |
| 35. | Markham | 28.5% | 7.2%(+21.3)#35 | 6.9%(+21.6)#543 |
| 36. | Goodrich | 27.8% | 7.2%(+20.6)#36 | 6.9%(+20.9)#575 |
| 37. | Christoval | 26.7% | 7.2%(+19.5)#37 | 6.9%(+19.9)#629 |
| 38. | Franklin | 26.5% | 7.2%(+19.3)#38 | 6.9%(+19.6)#641 |
| 39. | Val Verde Park | 26.2% | 7.2%(+19.0)#39 | 6.9%(+19.3)#660 |
| 40. | Morgan Farm | 25.9% | 7.2%(+18.7)#40 | 6.9%(+19.0)#678 |
| 41. | Colorado City | 24.8% | 7.2%(+17.6)#41 | 6.9%(+17.9)#755 |
| 42. | Uncertain | 24.2% | 7.2%(+17.0)#42 | 6.9%(+17.4)#795 |
| 43. | Uvalde Estates | 24.2% | 7.2%(+17.0)#43 | 6.9%(+17.3)#797 |
| 44. | Port Isabel | 24.1% | 7.2%(+16.9)#44 | 6.9%(+17.3)#803 |
| 45. | Bynum | 24.1% | 7.2%(+16.9)#45 | 6.9%(+17.2)#809 |
| 46. | Big Thicket Lake Estates | 23.7% | 7.2%(+16.5)#46 | 6.9%(+16.8)#843 |
| 47. | Fort Davis | 23.5% | 7.2%(+16.3)#47 | 6.9%(+16.7)#853 |
| 48. | Mckinney Acres | 23.0% | 7.2%(+15.8)#48 | 6.9%(+16.1)#909 |
| 49. | South Padre Island | 22.7% | 7.2%(+15.5)#49 | 6.9%(+15.9)#933 |
| 50. | Louise | 22.7% | 7.2%(+15.5)#50 | 6.9%(+15.8)#938 |
| 51. | Sunrise Shores | 22.4% | 7.2%(+15.2)#51 | 6.9%(+15.6)#956 |
| 52. | Runge | 22.3% | 7.2%(+15.1)#52 | 6.9%(+15.4)#968 |
| 53. | Port Mansfield | 22.2% | 7.2%(+15.0)#53 | 6.9%(+15.3)#983 |
| 54. | Seco Mines | 22.1% | 7.2%(+14.9)#54 | 6.9%(+15.2)#1,007 |
| 55. | Tenaha | 22.0% | 7.2%(+14.8)#55 | 6.9%(+15.1)#1,013 |
| 56. | Tornillo | 22.0% | 7.2%(+14.8)#56 | 6.9%(+15.1)#1,014 |
| 57. | San Carlos I | 21.8% | 7.2%(+14.6)#57 | 6.9%(+15.0)#1,024 |
| 58. | Rosebud | 21.1% | 7.2%(+13.9)#58 | 6.9%(+14.3)#1,105 |
| 59. | Redfield | 21.1% | 7.2%(+13.9)#59 | 6.9%(+14.2)#1,109 |
| 60. | Sammy Martinez | 20.9% | 7.2%(+13.7)#60 | 6.9%(+14.0)#1,129 |
| 61. | Channing | 20.8% | 7.2%(+13.6)#61 | 6.9%(+14.0)#1,138 |
| 62. | Tilden | 20.8% | 7.2%(+13.6)#62 | 6.9%(+13.9)#1,149 |
| 63. | Batesville | 20.6% | 7.2%(+13.4)#63 | 6.9%(+13.7)#1,167 |
| 64. | Bacliff | 20.3% | 7.2%(+13.1)#64 | 6.9%(+13.4)#1,210 |
| 65. | Center | 20.3% | 7.2%(+13.1)#65 | 6.9%(+13.4)#1,211 |
| 66. | Pueblo Nuevo | 20.2% | 7.2%(+13.0)#66 | 6.9%(+13.4)#1,215 |
| 67. | Rocksprings | 20.0% | 7.2%(+12.8)#67 | 6.9%(+13.1)#1,237 |
| 68. | Hays | 20.0% | 7.2%(+12.8)#68 | 6.9%(+13.1)#1,249 |
| 69. | Balcones Heights | 19.7% | 7.2%(+12.5)#69 | 6.9%(+12.9)#1,295 |
| 70. | Pleasant Valley | 19.3% | 7.2%(+12.0)#70 | 6.9%(+12.4)#1,376 |
| 71. | Rochester | 19.2% | 7.2%(+12.0)#71 | 6.9%(+12.3)#1,379 |
| 72. | Hardin | 19.2% | 7.2%(+12.0)#72 | 6.9%(+12.3)#1,385 |
| 73. | Welch | 18.8% | 7.2%(+11.6)#73 | 6.9%(+12.0)#1,447 |
| 74. | Warren | 18.8% | 7.2%(+11.6)#74 | 6.9%(+11.9)#1,454 |
| 75. | Villa Pancho | 18.8% | 7.2%(+11.6)#75 | 6.9%(+11.9)#1,457 |
| 76. | Taft Southwest | 18.6% | 7.2%(+11.4)#76 | 6.9%(+11.8)#1,485 |
| 77. | Hamilton | 18.5% | 7.2%(+11.3)#77 | 6.9%(+11.7)#1,505 |
| 78. | Kirbyville | 18.5% | 7.2%(+11.3)#78 | 6.9%(+11.6)#1,509 |
| 79. | Browndell | 18.5% | 7.2%(+11.3)#79 | 6.9%(+11.6)#1,513 |
| 80. | Timpson | 18.5% | 7.2%(+11.3)#80 | 6.9%(+11.6)#1,517 |
| 81. | Post | 18.3% | 7.2%(+11.1)#81 | 6.9%(+11.4)#1,549 |
| 82. | San Pedro | 18.3% | 7.2%(+11.1)#82 | 6.9%(+11.4)#1,560 |
| 83. | Fredericksburg | 18.1% | 7.2%(+10.9)#83 | 6.9%(+11.2)#1,610 |
| 84. | Palo Pinto | 18.0% | 7.2%(+10.8)#84 | 6.9%(+11.1)#1,625 |
| 85. | Preston | 17.9% | 7.2%(+10.7)#85 | 6.9%(+11.0)#1,640 |
| 86. | Wadsworth | 17.7% | 7.2%(+10.5)#86 | 6.9%(+10.8)#1,679 |
| 87. | Dickens | 17.6% | 7.2%(+10.4)#87 | 6.9%(+10.8)#1,692 |
| 88. | Brazoria | 17.5% | 7.2%(+10.3)#88 | 6.9%(+10.7)#1,703 |
| 89. | Gorman | 17.4% | 7.2%(+10.2)#89 | 6.9%(+10.5)#1,730 |
| 90. | Seth Ward | 17.4% | 7.2%(+10.2)#90 | 6.9%(+10.5)#1,731 |
| 91. | San Ygnacio | 17.3% | 7.2%(+10.1)#91 | 6.9%(+10.4)#1,773 |
| 92. | Novice | 17.2% | 7.2%(+10.0)#92 | 6.9%(+10.4)#1,780 |
| 93. | South Point | 17.2% | 7.2%(+10.0)#93 | 6.9%(+10.3)#1,786 |
| 94. | Mingus | 17.1% | 7.2%(+9.94)#94 | 6.9%(+10.3)#1,801 |
| 95. | Bardwell | 17.1% | 7.2%(+9.87)#95 | 6.9%(+10.2)#1,816 |
| 96. | Progreso | 16.9% | 7.2%(+9.68)#96 | 6.9%(+10.0)#1,856 |
| 97. | Atlanta | 16.9% | 7.2%(+9.65)#97 | 6.9%(+9.98)#1,864 |
| 98. | Sherwood Shores | 16.8% | 7.2%(+9.55)#98 | 6.9%(+9.87)#1,886 |
| 99. | Emhouse | 16.7% | 7.2%(+9.46)#99 | 6.9%(+9.79)#1,906 |
| 100. | Rochelle | 16.6% | 7.2%(+9.36)#100 | 6.9%(+9.69)#1,936 |
Common Questions
What are the Top 10 Cities with the Highest Percentage of Population Employed in Accommodation & Food Services in Texas?
Top 10 Cities with the Highest Percentage of Population Employed in Accommodation & Food Services in Texas are:
#1
100.0%
#2
84.0%
#3
76.9%
#4
62.0%
#5
61.7%
#6
60.0%
#7
59.2%
#8
59.1%
#9
56.5%
#10
52.9%
What city has the Highest Percentage of Population Employed in Accommodation & Food Services in Texas?
Palo Blanco has the Highest Percentage of Population Employed in Accommodation & Food Services in Texas with 100.0%.
What is the Percentage of Population Employed in Accommodation & Food Services in the State of Texas?
Percentage of Population Employed in Accommodation & Food Services in Texas is 7.2%.
What is the Percentage of Population Employed in Accommodation & Food Services in the United States?
Percentage of Population Employed in Accommodation & Food Services in the United States is 6.9%.