Payne Springs, TX
Payne Springs Map
Payne Springs Overview
613
TOTAL POPULATION
296
MALE POPULATION
317
FEMALE POPULATION
93.38
MALES / 100 FEMALES
107.09
FEMALES / 100 MALES
51.0
MEDIAN AGE
2.8
AVG FAMILY SIZE
2.3
AVG HOUSEHOLD SIZE
$27,781
PER CAPITA INCOME
$53,750
AVG FAMILY INCOME
$42,500
AVG HOUSEHOLD INCOME
36.0%
WAGE / INCOME GAP [ % ]
64.0¢/ $1
WAGE / INCOME GAP [ $ ]
0.44
INEQUALITY / GINI INDEX
228
LABOR FORCE [ PEOPLE ]
42.9%
PERCENT IN LABOR FORCE
1.3%
UNEMPLOYMENT RATE
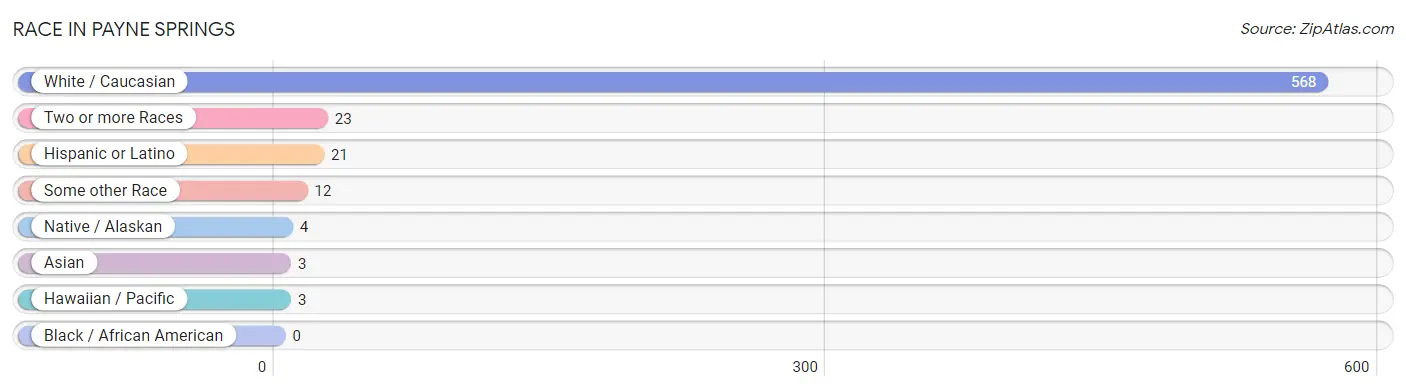
Race in Payne Springs
The most populous races in Payne Springs are White / Caucasian (568 | 92.7%), Two or more Races (23 | 3.7%), and Hispanic or Latino (21 | 3.4%).
| Race | # Population | % Population |
| Asian | 3 | 0.5% |
| Black / African American | 0 | 0.0% |
| Hawaiian / Pacific | 3 | 0.5% |
| Hispanic or Latino | 21 | 3.4% |
| Native / Alaskan | 4 | 0.6% |
| White / Caucasian | 568 | 92.7% |
| Two or more Races | 23 | 3.7% |
| Some other Race | 12 | 2.0% |
| Total | 613 | 100.0% |
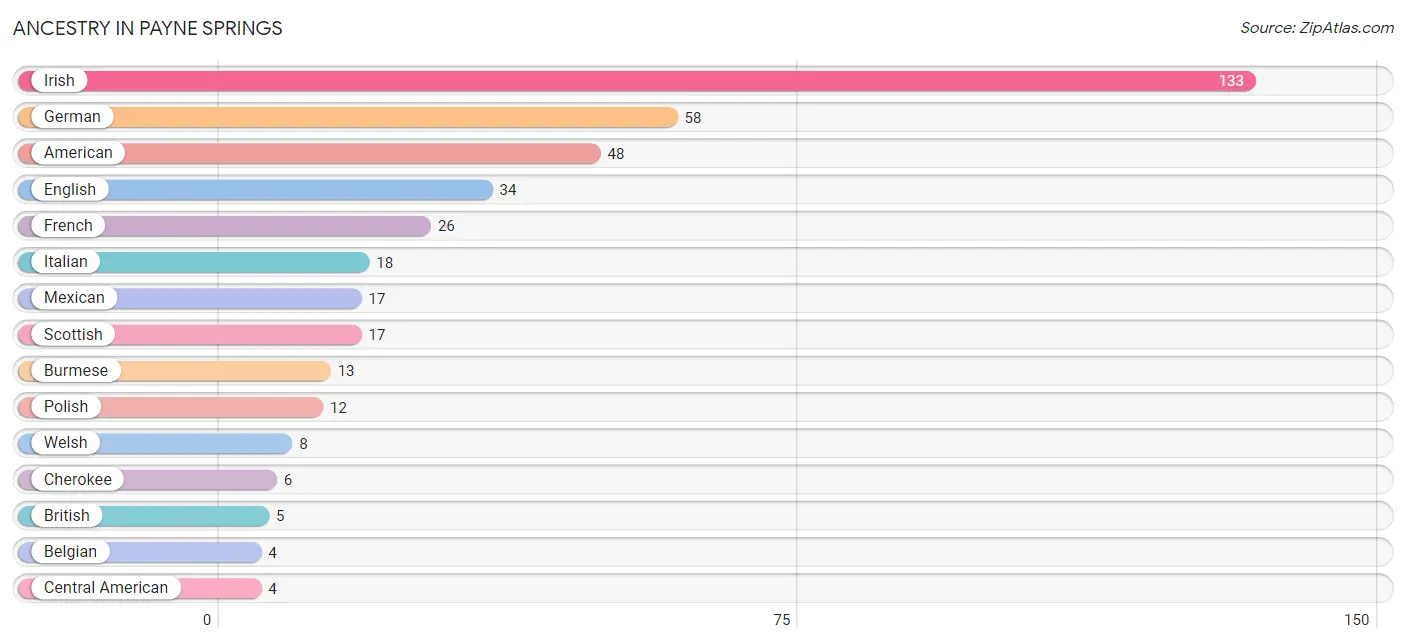
Ancestry in Payne Springs
The most populous ancestries reported in Payne Springs are Irish (133 | 21.7%), German (58 | 9.5%), American (48 | 7.8%), English (34 | 5.6%), and French (26 | 4.2%), together accounting for 48.8% of all Payne Springs residents.
| Ancestry | # Population | % Population |
| American | 48 | 7.8% |
| Belgian | 4 | 0.6% |
| British | 5 | 0.8% |
| Burmese | 13 | 2.1% |
| Canadian | 2 | 0.3% |
| Central American | 4 | 0.6% |
| Central American Indian | 4 | 0.6% |
| Cherokee | 6 | 1.0% |
| Delaware | 2 | 0.3% |
| Dutch West Indian | 3 | 0.5% |
| English | 34 | 5.6% |
| European | 4 | 0.6% |
| French | 26 | 4.2% |
| German | 58 | 9.5% |
| Guatemalan | 4 | 0.6% |
| Irish | 133 | 21.7% |
| Italian | 18 | 2.9% |
| Mexican | 17 | 2.8% |
| Native Hawaiian | 3 | 0.5% |
| Polish | 12 | 2.0% |
| Portuguese | 2 | 0.3% |
| Scottish | 17 | 2.8% |
| Sri Lankan | 3 | 0.5% |
| Swedish | 3 | 0.5% |
| Welsh | 8 | 1.3% | View All 25 Rows |
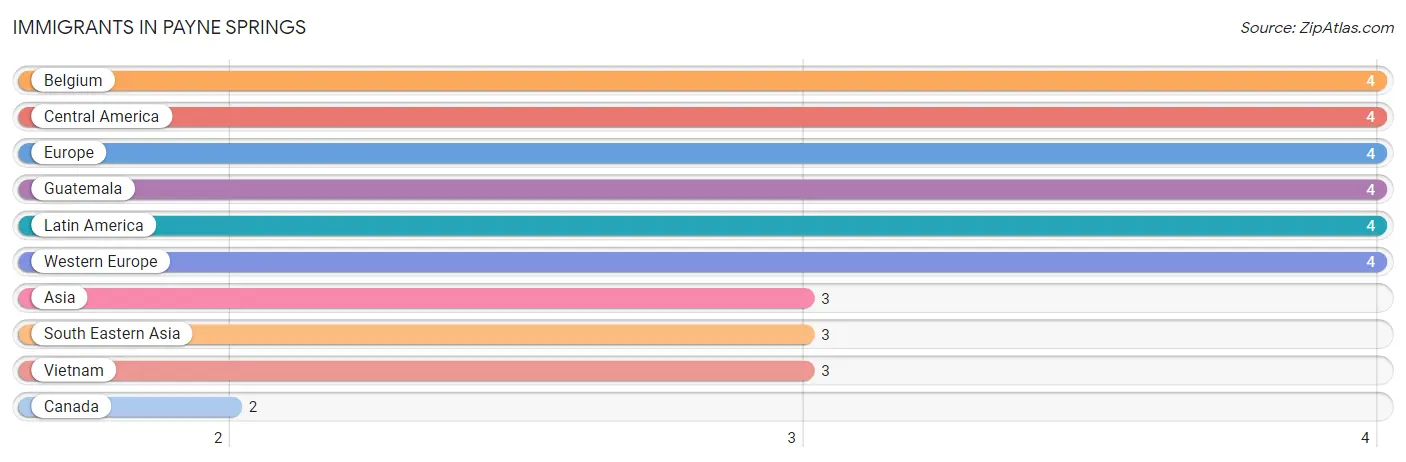
Immigrants in Payne Springs
The most numerous immigrant groups reported in Payne Springs came from Belgium (4 | 0.6%), Central America (4 | 0.6%), Europe (4 | 0.6%), Guatemala (4 | 0.6%), and Latin America (4 | 0.6%), together accounting for 3.3% of all Payne Springs residents.
| Immigration Origin | # Population | % Population |
| Asia | 3 | 0.5% |
| Belgium | 4 | 0.6% |
| Canada | 2 | 0.3% |
| Central America | 4 | 0.6% |
| Europe | 4 | 0.6% |
| Guatemala | 4 | 0.6% |
| Latin America | 4 | 0.6% |
| South Eastern Asia | 3 | 0.5% |
| Vietnam | 3 | 0.5% |
| Western Europe | 4 | 0.6% | View All 10 Rows |
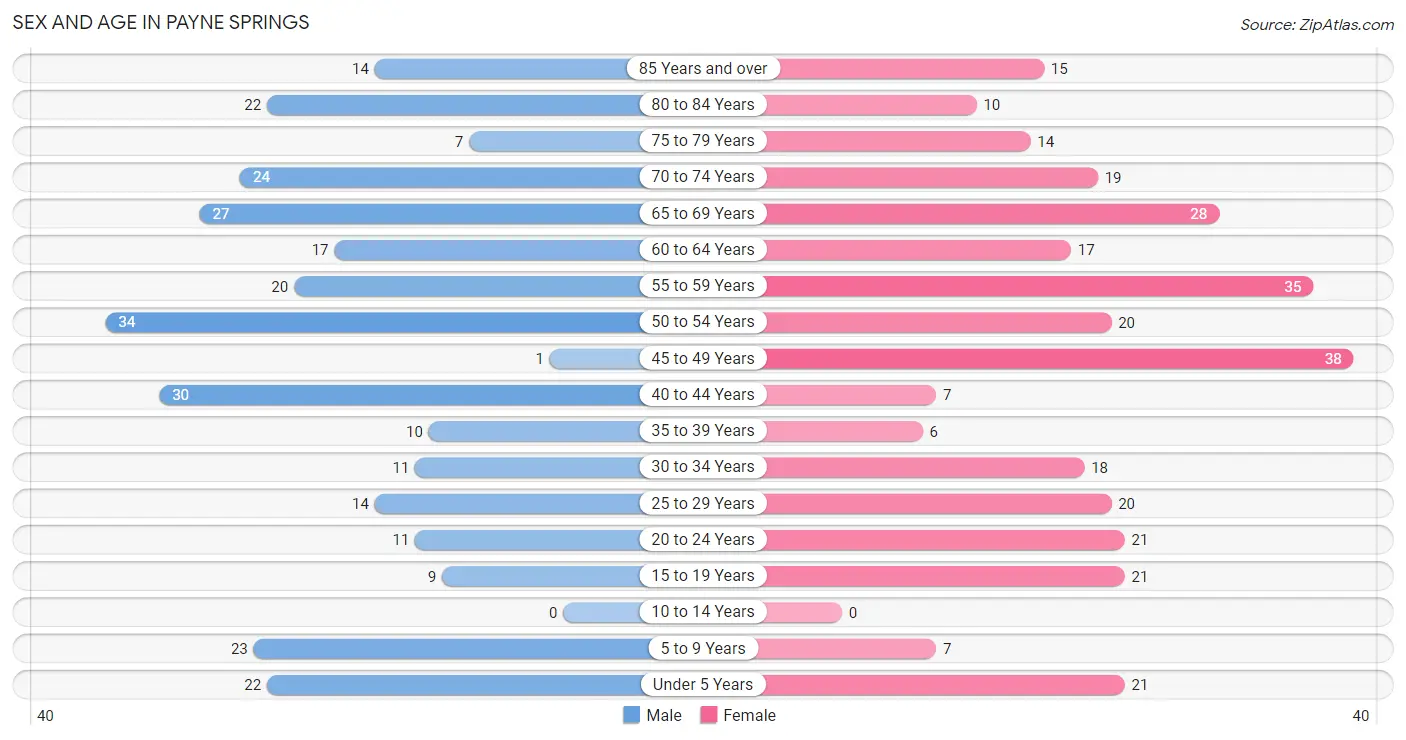
Sex and Age in Payne Springs
Sex and Age in Payne Springs
The most populous age groups in Payne Springs are 50 to 54 Years (34 | 11.5%) for men and 45 to 49 Years (38 | 12.0%) for women.
| Age Bracket | Male | Female |
| Under 5 Years | 22 (7.4%) | 21 (6.6%) |
| 5 to 9 Years | 23 (7.8%) | 7 (2.2%) |
| 10 to 14 Years | 0 (0.0%) | 0 (0.0%) |
| 15 to 19 Years | 9 (3.0%) | 21 (6.6%) |
| 20 to 24 Years | 11 (3.7%) | 21 (6.6%) |
| 25 to 29 Years | 14 (4.7%) | 20 (6.3%) |
| 30 to 34 Years | 11 (3.7%) | 18 (5.7%) |
| 35 to 39 Years | 10 (3.4%) | 6 (1.9%) |
| 40 to 44 Years | 30 (10.1%) | 7 (2.2%) |
| 45 to 49 Years | 1 (0.3%) | 38 (12.0%) |
| 50 to 54 Years | 34 (11.5%) | 20 (6.3%) |
| 55 to 59 Years | 20 (6.8%) | 35 (11.0%) |
| 60 to 64 Years | 17 (5.7%) | 17 (5.4%) |
| 65 to 69 Years | 27 (9.1%) | 28 (8.8%) |
| 70 to 74 Years | 24 (8.1%) | 19 (6.0%) |
| 75 to 79 Years | 7 (2.4%) | 14 (4.4%) |
| 80 to 84 Years | 22 (7.4%) | 10 (3.2%) |
| 85 Years and over | 14 (4.7%) | 15 (4.7%) |
| Total | 296 (100.0%) | 317 (100.0%) |
Families and Households in Payne Springs
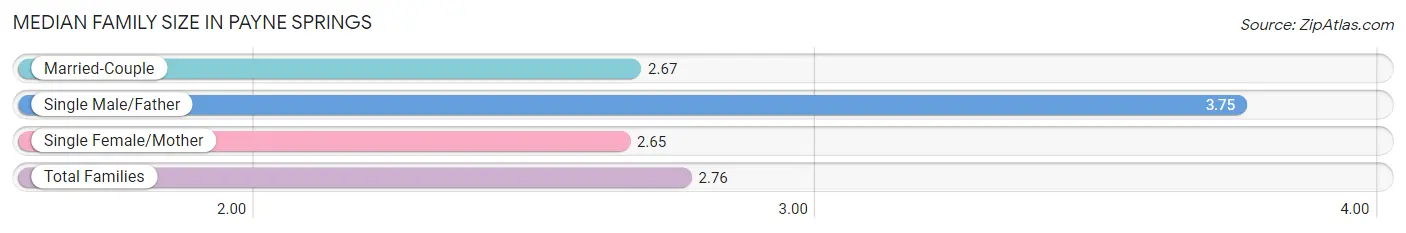
Median Family Size in Payne Springs
The median family size in Payne Springs is 2.76 persons per family, with single male/father families (16 | 9.1%) accounting for the largest median family size of 3.75 persons per family. On the other hand, single female/mother families (43 | 24.4%) represent the smallest median family size with 2.65 persons per family.
| Family Type | # Families | Family Size |
| Married-Couple | 117 (66.5%) | 2.67 |
| Single Male/Father | 16 (9.1%) | 3.75 |
| Single Female/Mother | 43 (24.4%) | 2.65 |
| Total Families | 176 (100.0%) | 2.76 |
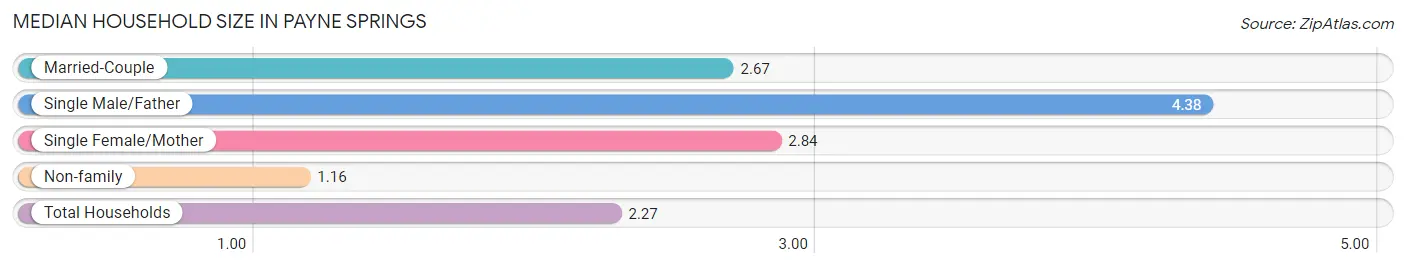
Median Household Size in Payne Springs
The median household size in Payne Springs is 2.27 persons per household, with single male/father households (16 | 5.9%) accounting for the largest median household size of 4.38 persons per household. non-family households (94 | 34.8%) represent the smallest median household size with 1.16 persons per household.
| Household Type | # Households | Household Size |
| Married-Couple | 117 (43.3%) | 2.67 |
| Single Male/Father | 16 (5.9%) | 4.38 |
| Single Female/Mother | 43 (15.9%) | 2.84 |
| Non-family | 94 (34.8%) | 1.16 |
| Total Households | 270 (100.0%) | 2.27 |
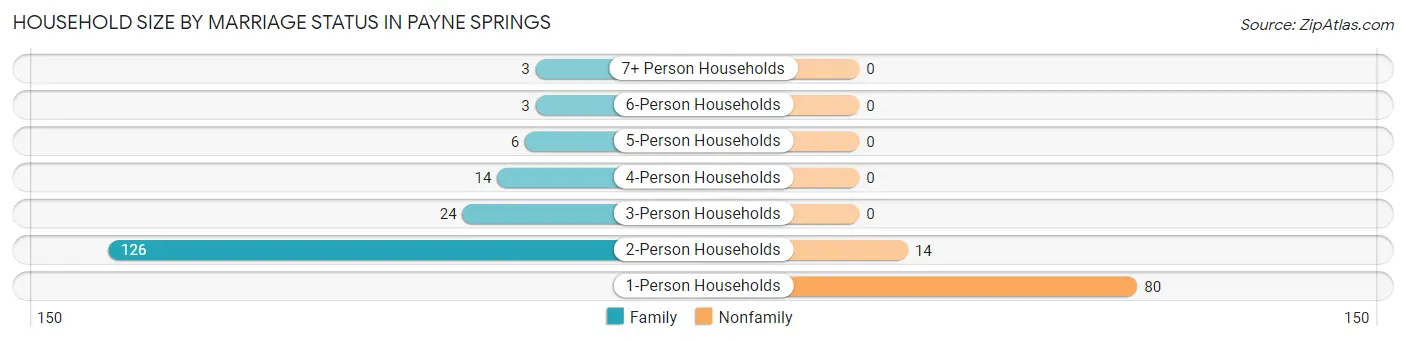
Household Size by Marriage Status in Payne Springs
Out of a total of 270 households in Payne Springs, 176 (65.2%) are family households, while 94 (34.8%) are nonfamily households. The most numerous type of family households are 2-person households, comprising 126, and the most common type of nonfamily households are 1-person households, comprising 80.
| Household Size | Family Households | Nonfamily Households |
| 1-Person Households | - | 80 (29.6%) |
| 2-Person Households | 126 (46.7%) | 14 (5.2%) |
| 3-Person Households | 24 (8.9%) | 0 (0.0%) |
| 4-Person Households | 14 (5.2%) | 0 (0.0%) |
| 5-Person Households | 6 (2.2%) | 0 (0.0%) |
| 6-Person Households | 3 (1.1%) | 0 (0.0%) |
| 7+ Person Households | 3 (1.1%) | 0 (0.0%) |
| Total | 176 (65.2%) | 94 (34.8%) |
Female Fertility in Payne Springs
Fertility by Age in Payne Springs
Average fertility rate in Payne Springs is 61.0 births per 1,000 women. Women in the age bracket of 20 to 34 years have the highest fertility rate with 153.0 births per 1,000 women. Women in the age bracket of 20 to 34 years acount for 100.0% of all women with births.
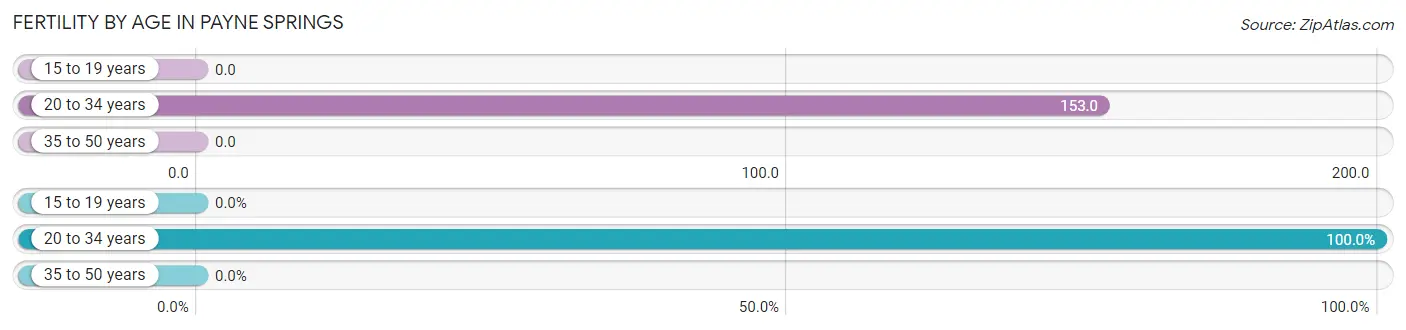
| Age Bracket | Women with Births | Births / 1,000 Women |
| 15 to 19 years | 0 (0.0%) | 0.0 |
| 20 to 34 years | 9 (100.0%) | 153.0 |
| 35 to 50 years | 0 (0.0%) | 0.0 |
| Total | 9 (100.0%) | 61.0 |
Fertility by Age by Marriage Status in Payne Springs
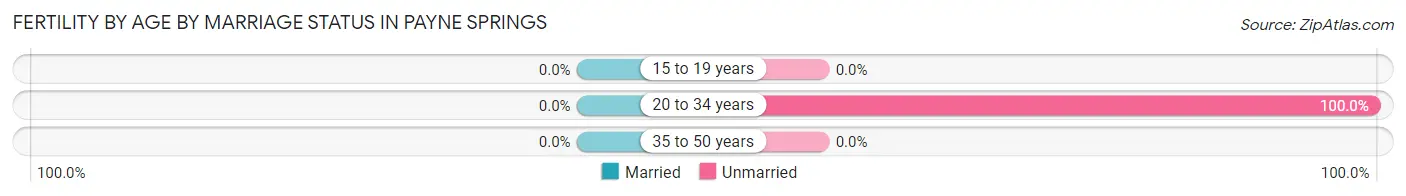
| Age Bracket | Married | Unmarried |
| 15 to 19 years | 0 (0.0%) | 0 (0.0%) |
| 20 to 34 years | 0 (0.0%) | 9 (100.0%) |
| 35 to 50 years | 0 (0.0%) | 0 (0.0%) |
| Total | 0 (0.0%) | 9 (100.0%) |
Fertility by Education in Payne Springs
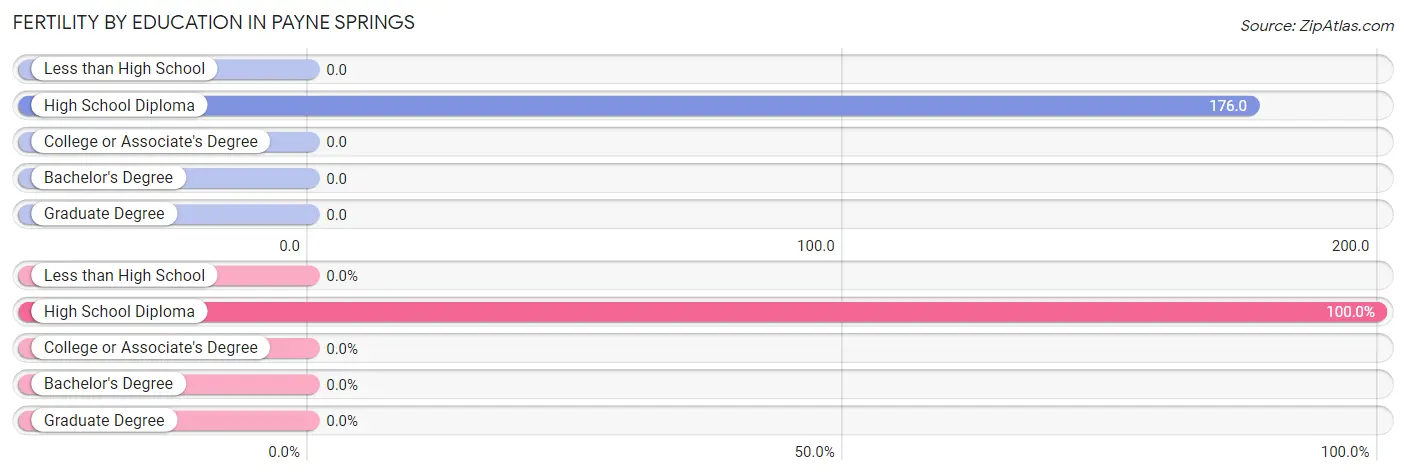
| Educational Attainment | Women with Births | Births / 1,000 Women |
| Less than High School | 0 (0.0%) | 0.0 |
| High School Diploma | 9 (100.0%) | 176.0 |
| College or Associate's Degree | 0 (0.0%) | 0.0 |
| Bachelor's Degree | 0 (0.0%) | 0.0 |
| Graduate Degree | 0 (0.0%) | 0.0 |
| Total | 9 (100.0%) | 61.0 |
Fertility by Education by Marriage Status in Payne Springs
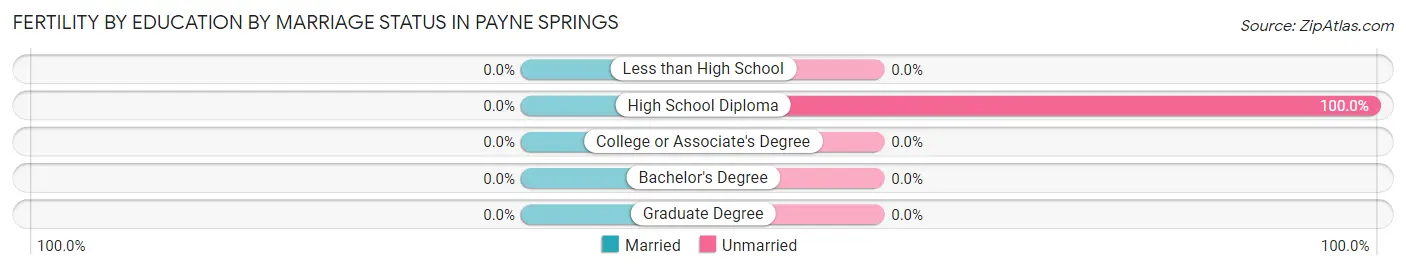
| Educational Attainment | Married | Unmarried |
| Less than High School | 0 (0.0%) | 0 (0.0%) |
| High School Diploma | 0 (0.0%) | 9 (100.0%) |
| College or Associate's Degree | 0 (0.0%) | 0 (0.0%) |
| Bachelor's Degree | 0 (0.0%) | 0 (0.0%) |
| Graduate Degree | 0 (0.0%) | 0 (0.0%) |
| Total | 0 (0.0%) | 9 (100.0%) |
Income in Payne Springs
Income Overview in Payne Springs
Per Capita Income in Payne Springs is $27,781, while median incomes of families and households are $53,750 and $42,500 respectively.
| Characteristic | Number | Measure |
| Per Capita Income | 613 | $27,781 |
| Median Family Income | 176 | $53,750 |
| Mean Family Income | 176 | $63,347 |
| Median Household Income | 270 | $42,500 |
| Mean Household Income | 270 | $58,904 |
| Income Deficit | 176 | $0 |
| Wage / Income Gap (%) | 613 | 36.01% |
| Wage / Income Gap ($) | 613 | 63.99¢ per $1 |
| Gini / Inequality Index | 613 | 0.44 |
Earnings by Sex in Payne Springs
Average Earnings in Payne Springs are $31,667, $39,821 for men and $25,481 for women, a difference of 36.0%.
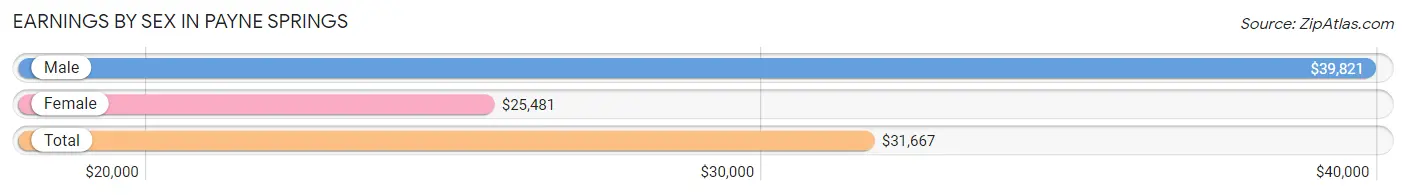
| Sex | Number | Average Earnings |
| Male | 123 (51.2%) | $39,821 |
| Female | 117 (48.7%) | $25,481 |
| Total | 240 (100.0%) | $31,667 |
Earnings by Sex by Income Bracket in Payne Springs
The most common earnings brackets in Payne Springs are $75,000 to $99,999 for men (23 | 18.7%) and $2,500 to $4,999 for women (20 | 17.1%).
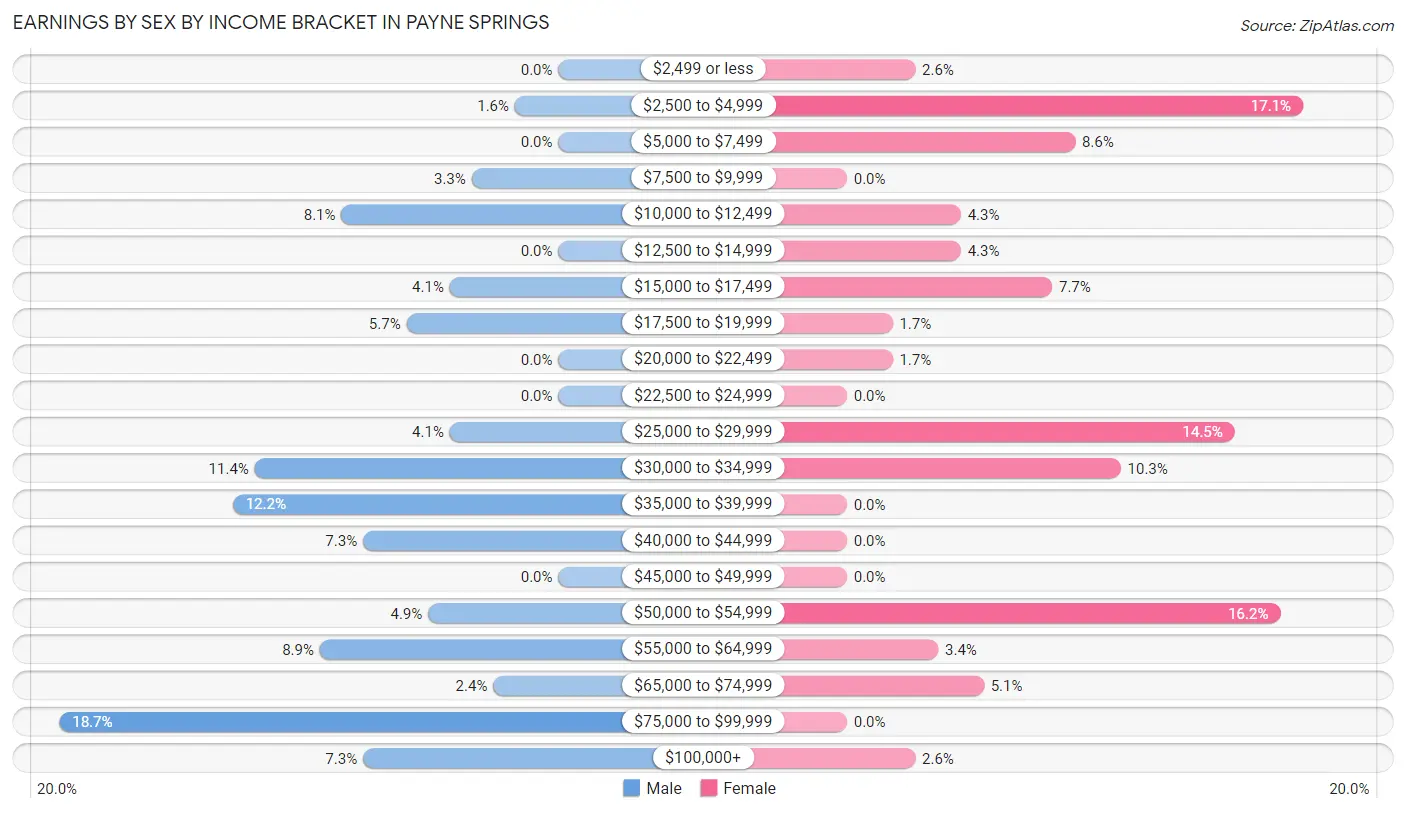
| Income | Male | Female |
| $2,499 or less | 0 (0.0%) | 3 (2.6%) |
| $2,500 to $4,999 | 2 (1.6%) | 20 (17.1%) |
| $5,000 to $7,499 | 0 (0.0%) | 10 (8.6%) |
| $7,500 to $9,999 | 4 (3.3%) | 0 (0.0%) |
| $10,000 to $12,499 | 10 (8.1%) | 5 (4.3%) |
| $12,500 to $14,999 | 0 (0.0%) | 5 (4.3%) |
| $15,000 to $17,499 | 5 (4.1%) | 9 (7.7%) |
| $17,500 to $19,999 | 7 (5.7%) | 2 (1.7%) |
| $20,000 to $22,499 | 0 (0.0%) | 2 (1.7%) |
| $22,500 to $24,999 | 0 (0.0%) | 0 (0.0%) |
| $25,000 to $29,999 | 5 (4.1%) | 17 (14.5%) |
| $30,000 to $34,999 | 14 (11.4%) | 12 (10.3%) |
| $35,000 to $39,999 | 15 (12.2%) | 0 (0.0%) |
| $40,000 to $44,999 | 9 (7.3%) | 0 (0.0%) |
| $45,000 to $49,999 | 0 (0.0%) | 0 (0.0%) |
| $50,000 to $54,999 | 6 (4.9%) | 19 (16.2%) |
| $55,000 to $64,999 | 11 (8.9%) | 4 (3.4%) |
| $65,000 to $74,999 | 3 (2.4%) | 6 (5.1%) |
| $75,000 to $99,999 | 23 (18.7%) | 0 (0.0%) |
| $100,000+ | 9 (7.3%) | 3 (2.6%) |
| Total | 123 (100.0%) | 117 (100.0%) |
Earnings by Sex by Educational Attainment in Payne Springs
Average earnings in Payne Springs are $40,750 for men and $27,404 for women, a difference of 32.8%. Men with an educational attainment of less than high school enjoy the highest average annual earnings of $50,500, while those with college or associate's degree education earn the least with $37,031. Women with an educational attainment of bachelor's degree earn the most with the average annual earnings of $50,357, while those with bachelor's degree education have the smallest earnings of $50,357.
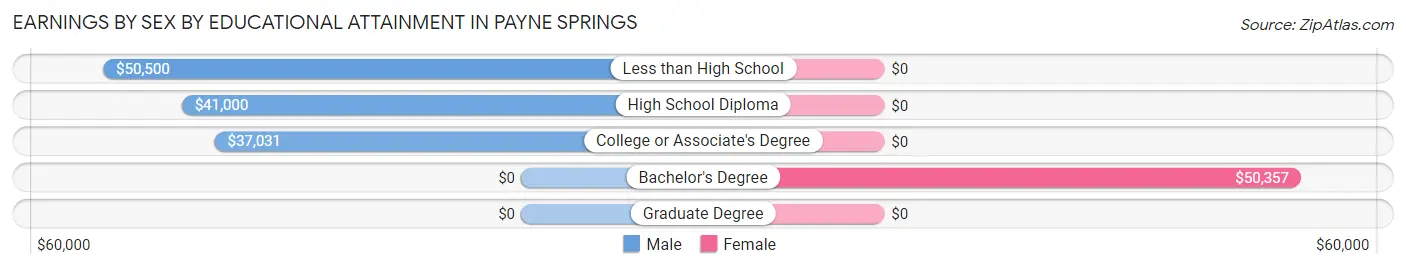
| Educational Attainment | Male Income | Female Income |
| Less than High School | $50,500 | $0 |
| High School Diploma | $41,000 | $0 |
| College or Associate's Degree | $37,031 | $0 |
| Bachelor's Degree | - | - |
| Graduate Degree | - | - |
| Total | $40,750 | $27,404 |
Family Income in Payne Springs
Family Income Brackets in Payne Springs
According to the Payne Springs family income data, there are 34 families falling into the $75,000 to $99,999 income range, which is the most common income bracket and makes up 19.3% of all families.
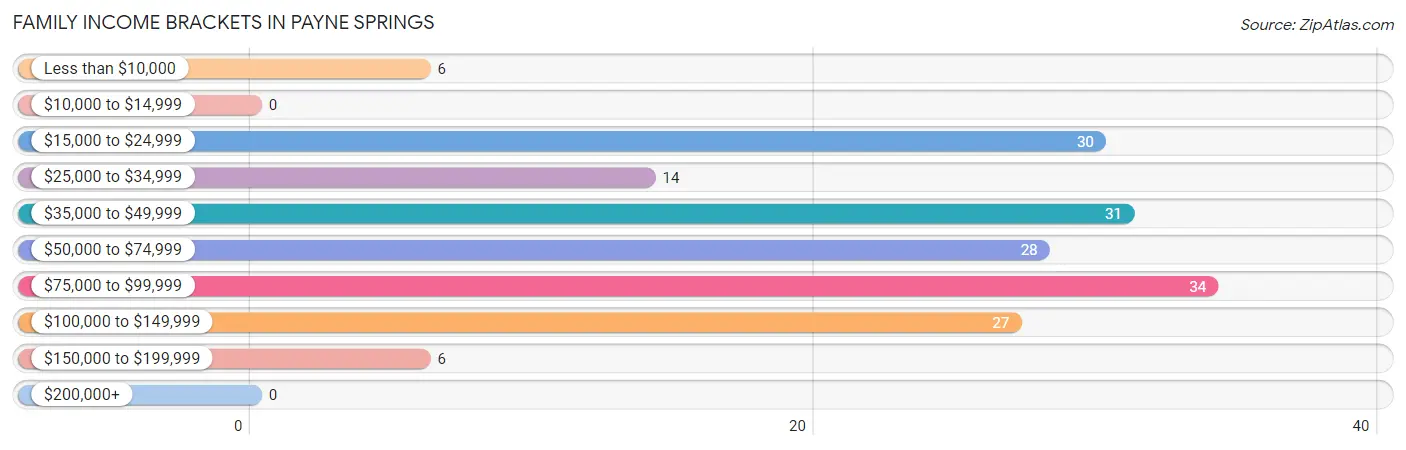
| Income Bracket | # Families | % Families |
| Less than $10,000 | 6 | 3.4% |
| $10,000 to $14,999 | 0 | 0.0% |
| $15,000 to $24,999 | 30 | 17.0% |
| $25,000 to $34,999 | 14 | 8.0% |
| $35,000 to $49,999 | 31 | 17.6% |
| $50,000 to $74,999 | 28 | 15.9% |
| $75,000 to $99,999 | 34 | 19.3% |
| $100,000 to $149,999 | 27 | 15.3% |
| $150,000 to $199,999 | 6 | 3.4% |
| $200,000+ | 0 | 0.0% |
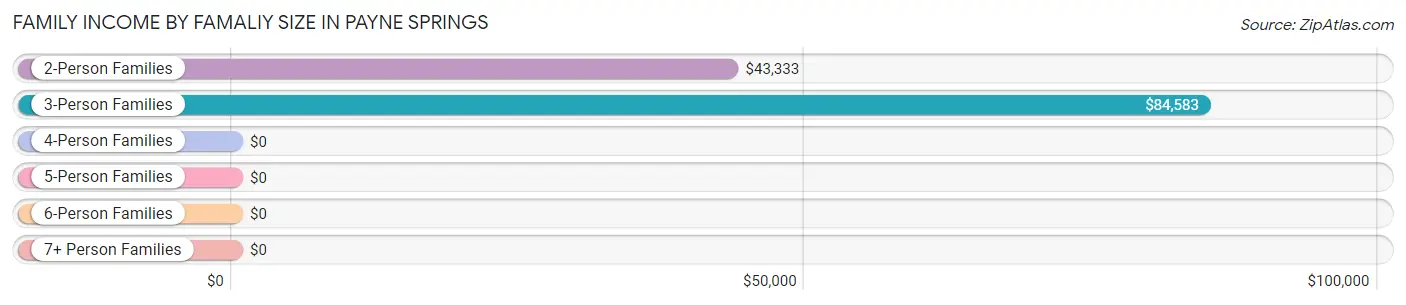
Family Income by Famaliy Size in Payne Springs
3-person families (25 | 14.2%) account for the highest median family income in Payne Springs with $84,583 per family, while 3-person families (25 | 14.2%) have the highest median income of $28,194 per family member.
| Income Bracket | # Families | Median Income |
| 2-Person Families | 132 (75.0%) | $43,333 |
| 3-Person Families | 25 (14.2%) | $84,583 |
| 4-Person Families | 7 (4.0%) | $0 |
| 5-Person Families | 6 (3.4%) | $0 |
| 6-Person Families | 3 (1.7%) | $0 |
| 7+ Person Families | 3 (1.7%) | $0 |
| Total | 176 (100.0%) | $53,750 |
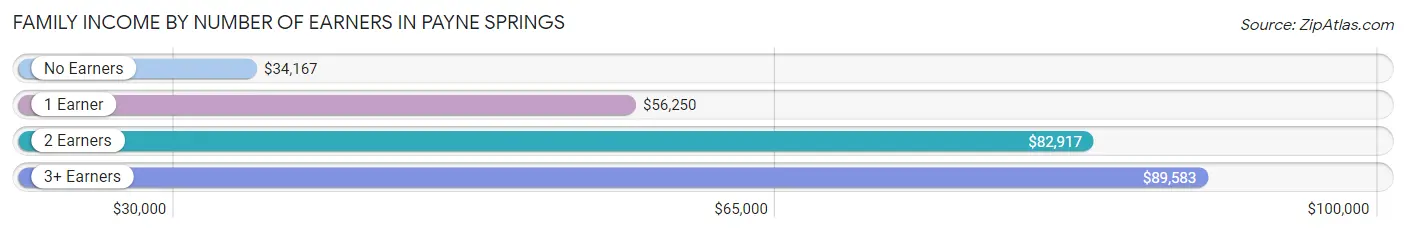
Family Income by Number of Earners in Payne Springs
The median family income in Payne Springs is $53,750, with families comprising 3+ earners (15) having the highest median family income of $89,583, while families with no earners (72) have the lowest median family income of $34,167, accounting for 8.5% and 40.9% of families, respectively.
| Number of Earners | # Families | Median Income |
| No Earners | 72 (40.9%) | $34,167 |
| 1 Earner | 58 (33.0%) | $56,250 |
| 2 Earners | 31 (17.6%) | $82,917 |
| 3+ Earners | 15 (8.5%) | $89,583 |
| Total | 176 (100.0%) | $53,750 |
Household Income in Payne Springs
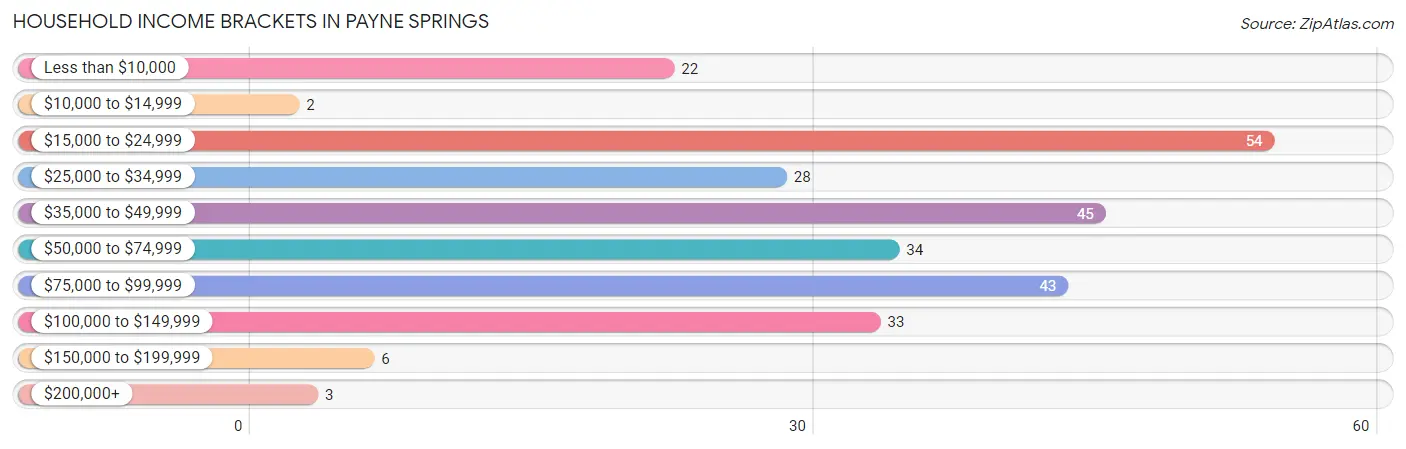
Household Income Brackets in Payne Springs
With 54 households falling in the category, the $15,000 to $24,999 income range is the most frequent in Payne Springs, accounting for 20.0% of all households. In contrast, only 2 households (0.7%) fall into the $10,000 to $14,999 income bracket, making it the least populous group.
| Income Bracket | # Households | % Households |
| Less than $10,000 | 22 | 8.1% |
| $10,000 to $14,999 | 2 | 0.7% |
| $15,000 to $24,999 | 54 | 20.0% |
| $25,000 to $34,999 | 28 | 10.4% |
| $35,000 to $49,999 | 45 | 16.7% |
| $50,000 to $74,999 | 34 | 12.6% |
| $75,000 to $99,999 | 43 | 15.9% |
| $100,000 to $149,999 | 33 | 12.2% |
| $150,000 to $199,999 | 6 | 2.2% |
| $200,000+ | 3 | 1.1% |
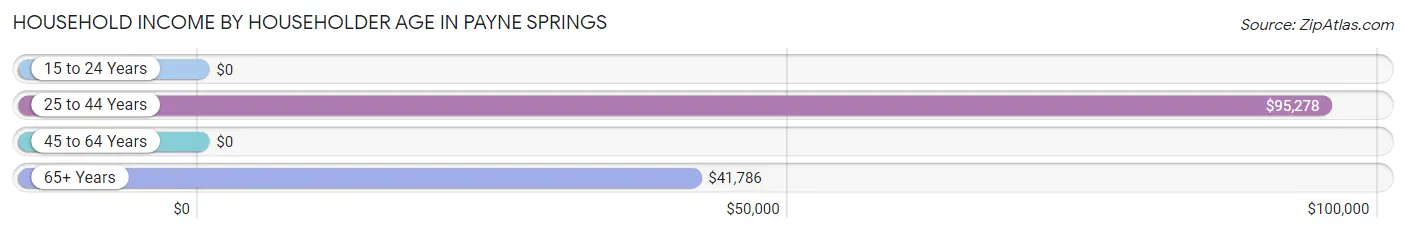
Household Income by Householder Age in Payne Springs
The median household income in Payne Springs is $42,500, with the highest median household income of $95,278 found in the 25 to 44 years age bracket for the primary householder. A total of 58 households (21.5%) fall into this category. Meanwhile, the 15 to 24 years age bracket for the primary householder has the lowest median household income of $0, with 8 households (3.0%) in this group.
| Income Bracket | # Households | Median Income |
| 15 to 24 Years | 8 (3.0%) | $0 |
| 25 to 44 Years | 58 (21.5%) | $95,278 |
| 45 to 64 Years | 86 (31.9%) | $0 |
| 65+ Years | 118 (43.7%) | $41,786 |
| Total | 270 (100.0%) | $42,500 |
Poverty in Payne Springs
Income Below Poverty by Sex and Age in Payne Springs
With 13.9% poverty level for males and 17.7% for females among the residents of Payne Springs, 75 year old and over males and 45 to 54 year old females are the most vulnerable to poverty, with 17 males (39.5%) and 21 females (36.2%) in their respective age groups living below the poverty level.
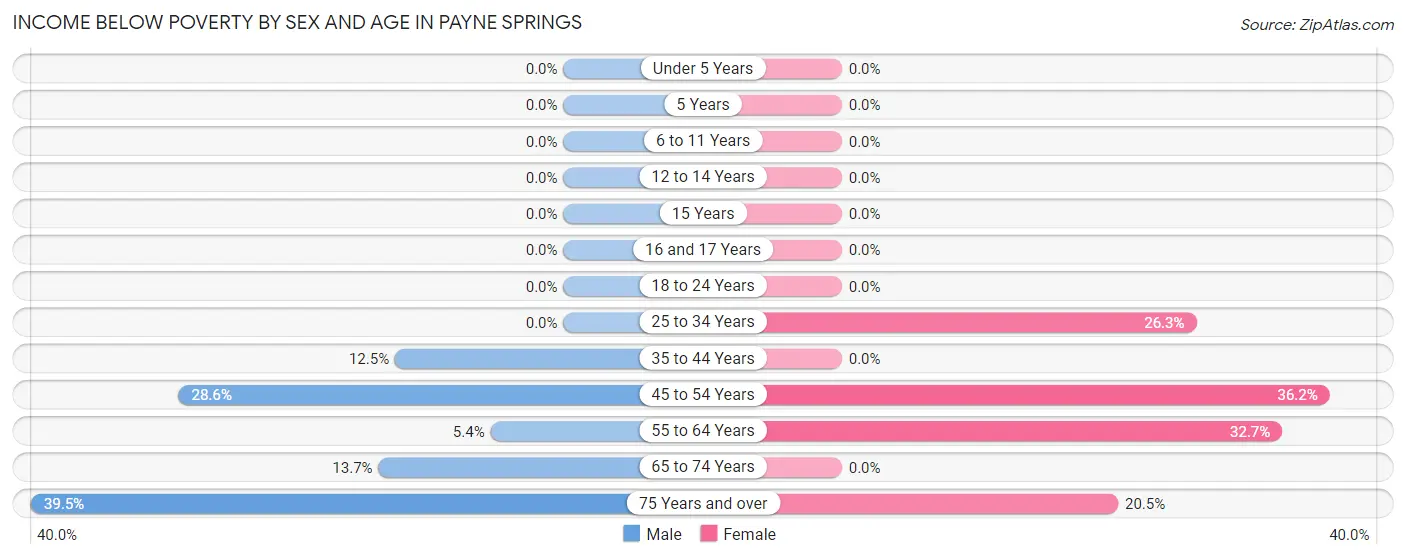
| Age Bracket | Male | Female |
| Under 5 Years | 0 (0.0%) | 0 (0.0%) |
| 5 Years | 0 (0.0%) | 0 (0.0%) |
| 6 to 11 Years | 0 (0.0%) | 0 (0.0%) |
| 12 to 14 Years | 0 (0.0%) | 0 (0.0%) |
| 15 Years | 0 (0.0%) | 0 (0.0%) |
| 16 and 17 Years | 0 (0.0%) | 0 (0.0%) |
| 18 to 24 Years | 0 (0.0%) | 0 (0.0%) |
| 25 to 34 Years | 0 (0.0%) | 10 (26.3%) |
| 35 to 44 Years | 5 (12.5%) | 0 (0.0%) |
| 45 to 54 Years | 10 (28.6%) | 21 (36.2%) |
| 55 to 64 Years | 2 (5.4%) | 17 (32.7%) |
| 65 to 74 Years | 7 (13.7%) | 0 (0.0%) |
| 75 Years and over | 17 (39.5%) | 8 (20.5%) |
| Total | 41 (13.9%) | 56 (17.7%) |
Income Above Poverty by Sex and Age in Payne Springs
According to the poverty statistics in Payne Springs, males aged under 5 years and females aged under 5 years are the age groups that are most secure financially, with 100.0% of males and 100.0% of females in these age groups living above the poverty line.
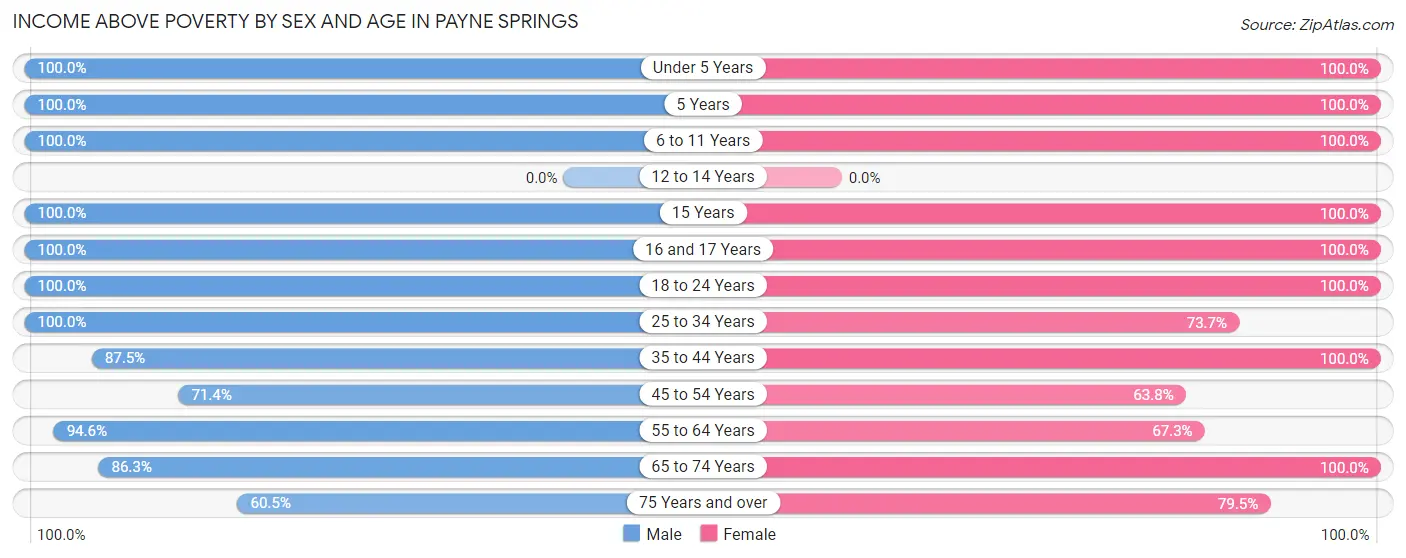
| Age Bracket | Male | Female |
| Under 5 Years | 22 (100.0%) | 21 (100.0%) |
| 5 Years | 1 (100.0%) | 2 (100.0%) |
| 6 to 11 Years | 22 (100.0%) | 5 (100.0%) |
| 12 to 14 Years | 0 (0.0%) | 0 (0.0%) |
| 15 Years | 1 (100.0%) | 7 (100.0%) |
| 16 and 17 Years | 2 (100.0%) | 4 (100.0%) |
| 18 to 24 Years | 17 (100.0%) | 31 (100.0%) |
| 25 to 34 Years | 25 (100.0%) | 28 (73.7%) |
| 35 to 44 Years | 35 (87.5%) | 13 (100.0%) |
| 45 to 54 Years | 25 (71.4%) | 37 (63.8%) |
| 55 to 64 Years | 35 (94.6%) | 35 (67.3%) |
| 65 to 74 Years | 44 (86.3%) | 47 (100.0%) |
| 75 Years and over | 26 (60.5%) | 31 (79.5%) |
| Total | 255 (86.2%) | 261 (82.3%) |
Income Below Poverty Among Married-Couple Families in Payne Springs
The poverty statistics for married-couple families in Payne Springs show that 17.9% or 21 of the total 117 families live below the poverty line. Families with no children have the highest poverty rate of 21.0%, comprising of 21 families. On the other hand, families with 1 or 2 children have the lowest poverty rate of 0.0%, which includes 0 families.
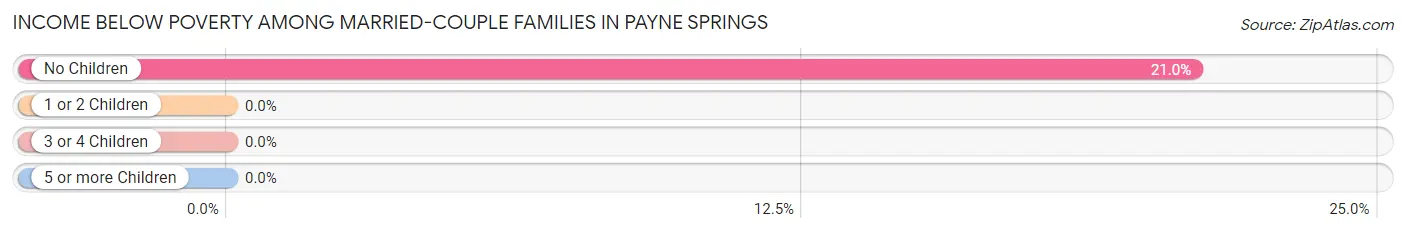
| Children | Above Poverty | Below Poverty |
| No Children | 79 (79.0%) | 21 (21.0%) |
| 1 or 2 Children | 7 (100.0%) | 0 (0.0%) |
| 3 or 4 Children | 10 (100.0%) | 0 (0.0%) |
| 5 or more Children | 0 (0.0%) | 0 (0.0%) |
| Total | 96 (82.1%) | 21 (17.9%) |
Income Below Poverty Among Single-Parent Households in Payne Springs
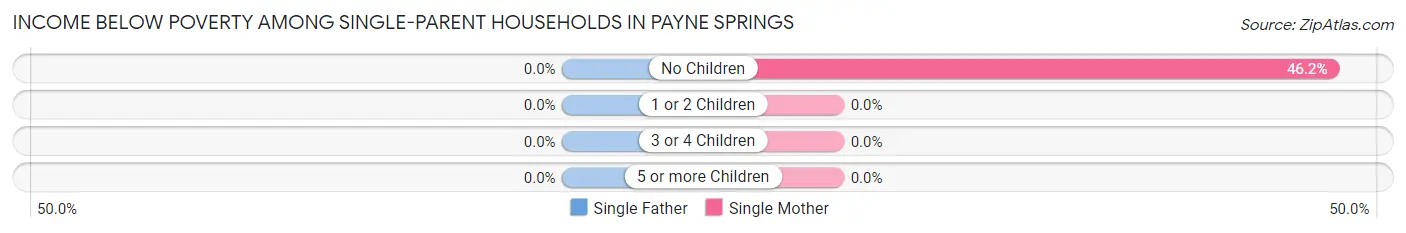
| Children | Single Father | Single Mother |
| No Children | 0 (0.0%) | 12 (46.2%) |
| 1 or 2 Children | 0 (0.0%) | 0 (0.0%) |
| 3 or 4 Children | 0 (0.0%) | 0 (0.0%) |
| 5 or more Children | 0 (0.0%) | 0 (0.0%) |
| Total | 0 (0.0%) | 12 (27.9%) |
Income Below Poverty Among Married-Couple vs Single-Parent Households in Payne Springs
The poverty data for Payne Springs shows that 21 of the married-couple family households (17.9%) and 12 of the single-parent households (20.3%) are living below the poverty level. Within the married-couple family households, those with no children have the highest poverty rate, with 21 households (21.0%) falling below the poverty line. Among the single-parent households, those with no children have the highest poverty rate, with 12 household (34.3%) living below poverty.
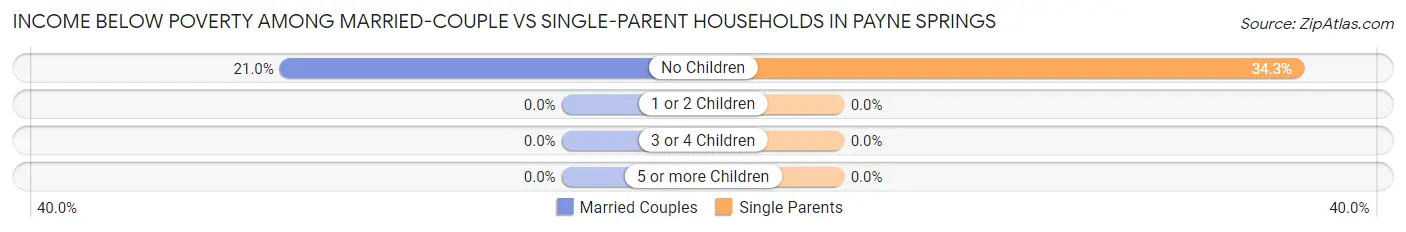
| Children | Married-Couple Families | Single-Parent Households |
| No Children | 21 (21.0%) | 12 (34.3%) |
| 1 or 2 Children | 0 (0.0%) | 0 (0.0%) |
| 3 or 4 Children | 0 (0.0%) | 0 (0.0%) |
| 5 or more Children | 0 (0.0%) | 0 (0.0%) |
| Total | 21 (17.9%) | 12 (20.3%) |
Employment Characteristics in Payne Springs
Employment by Class of Employer in Payne Springs
Among the 225 employed individuals in Payne Springs, private company employees (148 | 65.8%), self-employed (not incorporated) (33 | 14.7%), and not-for-profit organizations (19 | 8.4%) make up the most common classes of employment.
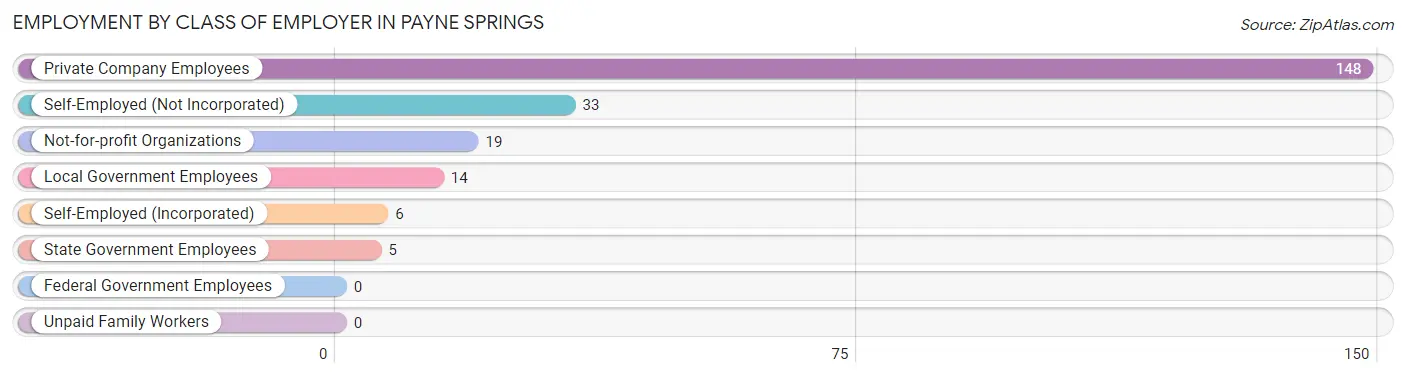
| Employer Class | # Employees | % Employees |
| Private Company Employees | 148 | 65.8% |
| Self-Employed (Incorporated) | 6 | 2.7% |
| Self-Employed (Not Incorporated) | 33 | 14.7% |
| Not-for-profit Organizations | 19 | 8.4% |
| Local Government Employees | 14 | 6.2% |
| State Government Employees | 5 | 2.2% |
| Federal Government Employees | 0 | 0.0% |
| Unpaid Family Workers | 0 | 0.0% |
| Total | 225 | 100.0% |
Employment Status by Age in Payne Springs
According to the labor force statistics for Payne Springs, out of the total population over 16 years of age (532), 42.9% or 228 individuals are in the labor force, with 1.3% or 3 of them unemployed. The age group with the highest labor force participation rate is 25 to 29 years, with 100.0% or 34 individuals in the labor force. Within the labor force, the 75 years and over age range has the highest percentage of unemployed individuals, with 20.0% or 2 of them being unemployed.
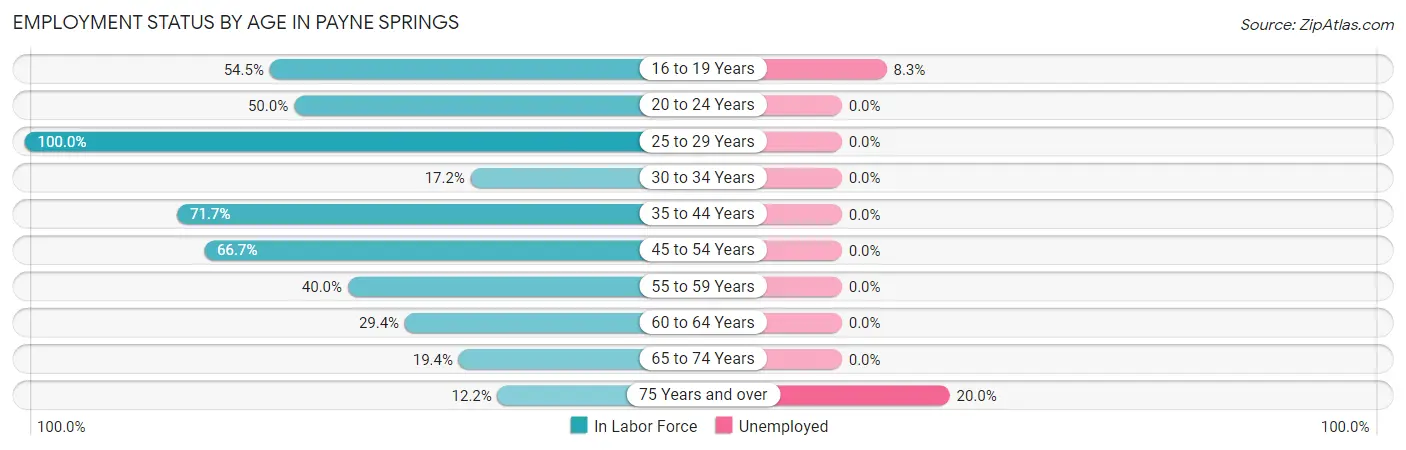
| Age Bracket | In Labor Force | Unemployed |
| 16 to 19 Years | 12 (54.5%) | 1 (8.3%) |
| 20 to 24 Years | 16 (50.0%) | 0 (0.0%) |
| 25 to 29 Years | 34 (100.0%) | 0 (0.0%) |
| 30 to 34 Years | 5 (17.2%) | 0 (0.0%) |
| 35 to 44 Years | 38 (71.7%) | 0 (0.0%) |
| 45 to 54 Years | 62 (66.7%) | 0 (0.0%) |
| 55 to 59 Years | 22 (40.0%) | 0 (0.0%) |
| 60 to 64 Years | 10 (29.4%) | 0 (0.0%) |
| 65 to 74 Years | 19 (19.4%) | 0 (0.0%) |
| 75 Years and over | 10 (12.2%) | 2 (20.0%) |
| Total | 228 (42.9%) | 3 (1.3%) |
Employment Status by Educational Attainment in Payne Springs
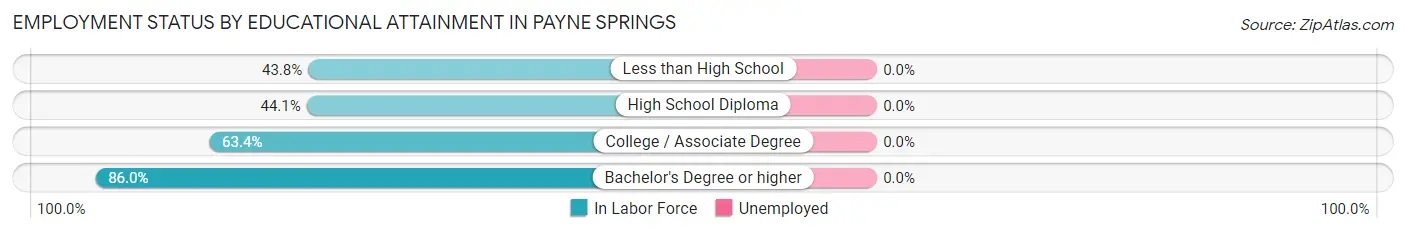
| Educational Attainment | In Labor Force | Unemployed |
| Less than High School | 14 (43.8%) | 0 (0.0%) |
| High School Diploma | 49 (44.1%) | 0 (0.0%) |
| College / Associate Degree | 71 (63.4%) | 0 (0.0%) |
| Bachelor's Degree or higher | 37 (86.0%) | 0 (0.0%) |
| Total | 171 (57.4%) | 0 (0.0%) |
Employment Occupations by Sex in Payne Springs
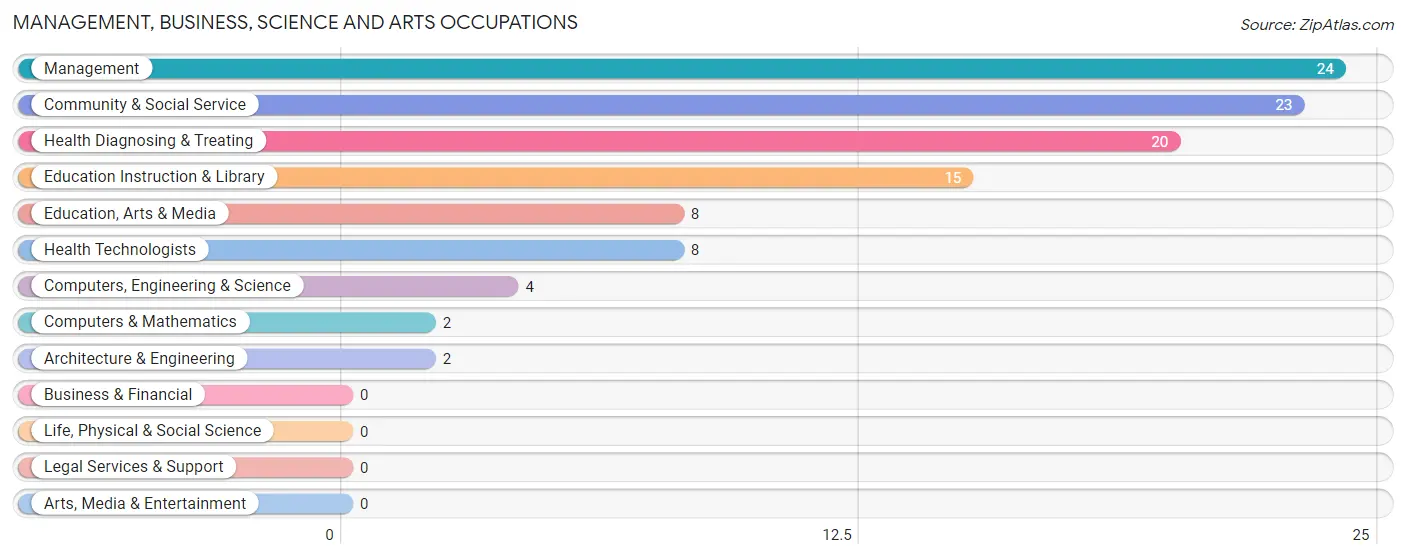
Management, Business, Science and Arts Occupations
The most common Management, Business, Science and Arts occupations in Payne Springs are Management (24 | 10.7%), Community & Social Service (23 | 10.2%), Health Diagnosing & Treating (20 | 8.9%), Education Instruction & Library (15 | 6.7%), and Education, Arts & Media (8 | 3.6%).
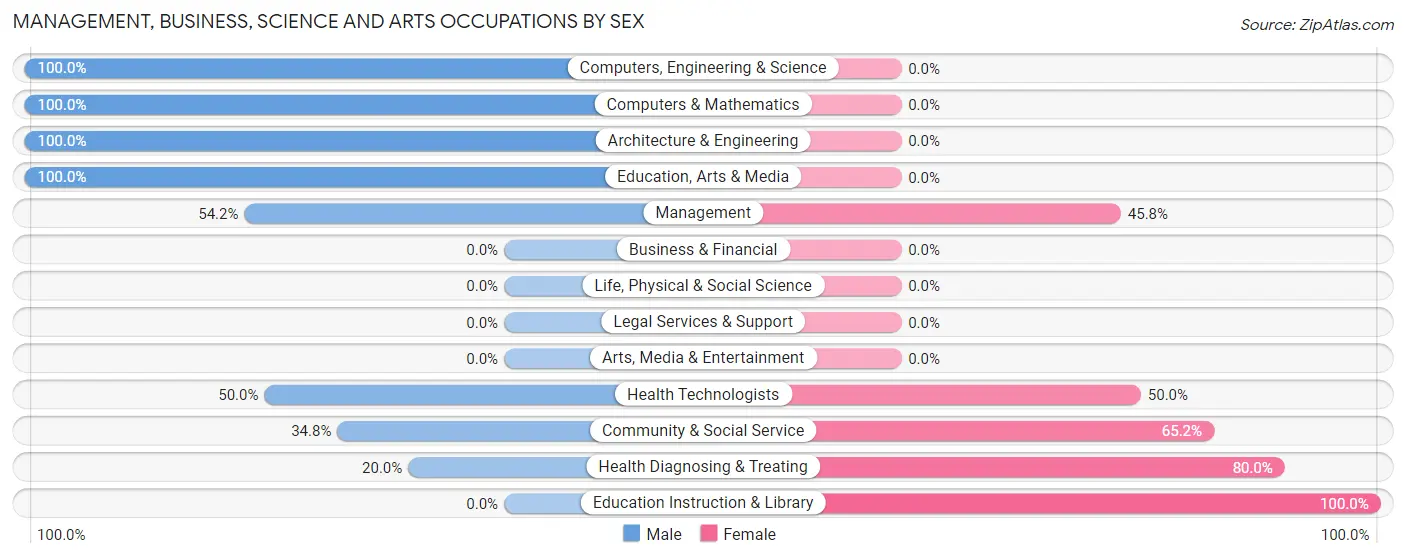
Management, Business, Science and Arts Occupations by Sex
Within the Management, Business, Science and Arts occupations in Payne Springs, the most male-oriented occupations are Computers, Engineering & Science (100.0%), Computers & Mathematics (100.0%), and Architecture & Engineering (100.0%), while the most female-oriented occupations are Education Instruction & Library (100.0%), Health Diagnosing & Treating (80.0%), and Community & Social Service (65.2%).
| Occupation | Male | Female |
| Management | 13 (54.2%) | 11 (45.8%) |
| Business & Financial | 0 (0.0%) | 0 (0.0%) |
| Computers, Engineering & Science | 4 (100.0%) | 0 (0.0%) |
| Computers & Mathematics | 2 (100.0%) | 0 (0.0%) |
| Architecture & Engineering | 2 (100.0%) | 0 (0.0%) |
| Life, Physical & Social Science | 0 (0.0%) | 0 (0.0%) |
| Community & Social Service | 8 (34.8%) | 15 (65.2%) |
| Education, Arts & Media | 8 (100.0%) | 0 (0.0%) |
| Legal Services & Support | 0 (0.0%) | 0 (0.0%) |
| Education Instruction & Library | 0 (0.0%) | 15 (100.0%) |
| Arts, Media & Entertainment | 0 (0.0%) | 0 (0.0%) |
| Health Diagnosing & Treating | 4 (20.0%) | 16 (80.0%) |
| Health Technologists | 4 (50.0%) | 4 (50.0%) |
| Total (Category) | 29 (40.8%) | 42 (59.2%) |
| Total (Overall) | 114 (50.7%) | 111 (49.3%) |
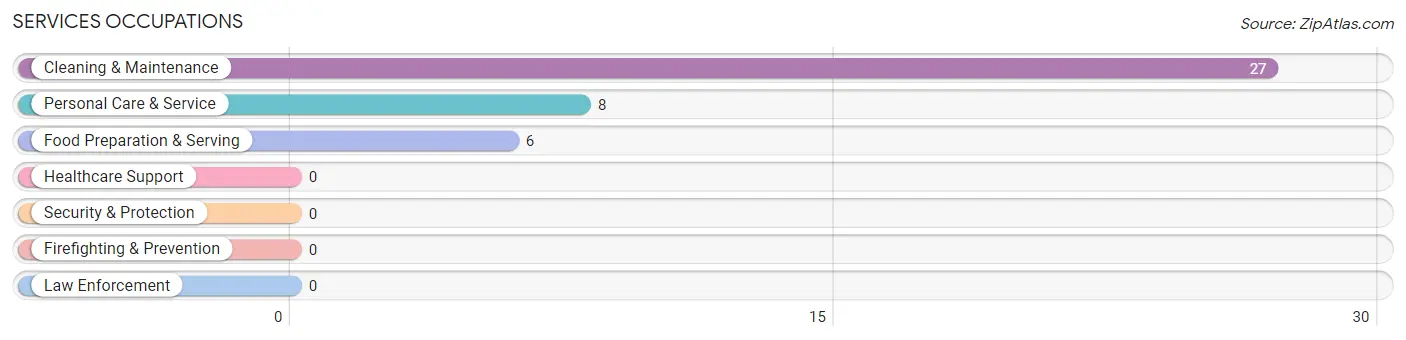
Services Occupations
The most common Services occupations in Payne Springs are Cleaning & Maintenance (27 | 12.0%), Personal Care & Service (8 | 3.6%), and Food Preparation & Serving (6 | 2.7%).
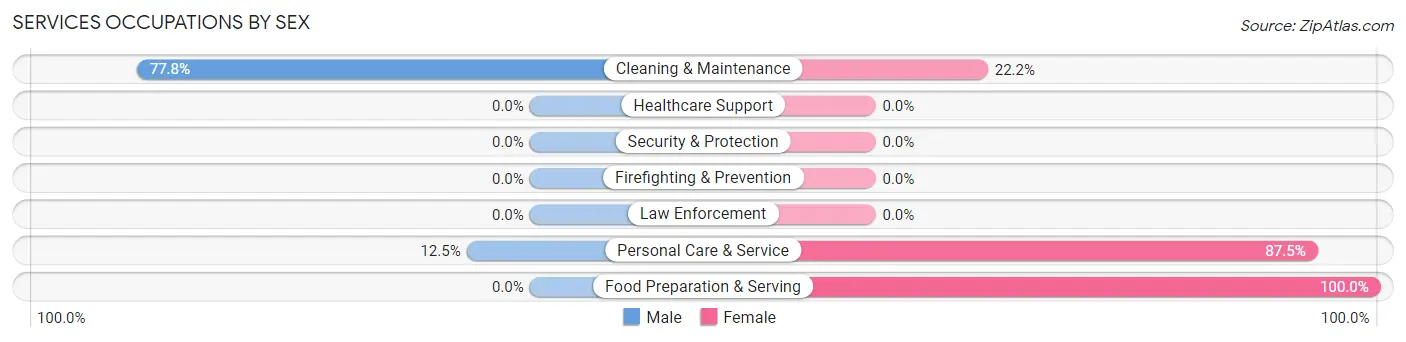
Services Occupations by Sex
Within the Services occupations in Payne Springs, the most male-oriented occupations are Cleaning & Maintenance (77.8%), and Personal Care & Service (12.5%), while the most female-oriented occupations are Food Preparation & Serving (100.0%), Personal Care & Service (87.5%), and Cleaning & Maintenance (22.2%).
| Occupation | Male | Female |
| Healthcare Support | 0 (0.0%) | 0 (0.0%) |
| Security & Protection | 0 (0.0%) | 0 (0.0%) |
| Firefighting & Prevention | 0 (0.0%) | 0 (0.0%) |
| Law Enforcement | 0 (0.0%) | 0 (0.0%) |
| Food Preparation & Serving | 0 (0.0%) | 6 (100.0%) |
| Cleaning & Maintenance | 21 (77.8%) | 6 (22.2%) |
| Personal Care & Service | 1 (12.5%) | 7 (87.5%) |
| Total (Category) | 22 (53.7%) | 19 (46.3%) |
| Total (Overall) | 114 (50.7%) | 111 (49.3%) |
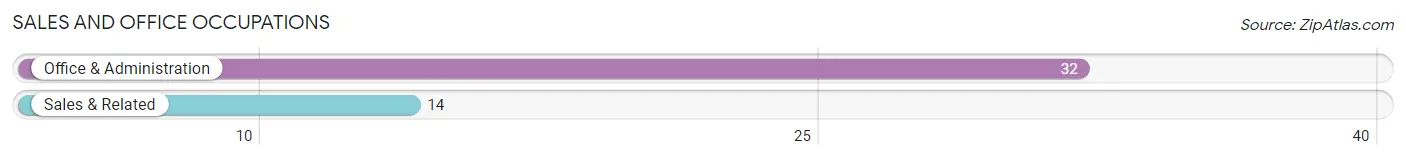
Sales and Office Occupations
The most common Sales and Office occupations in Payne Springs are Office & Administration (32 | 14.2%), and Sales & Related (14 | 6.2%).
Sales and Office Occupations by Sex
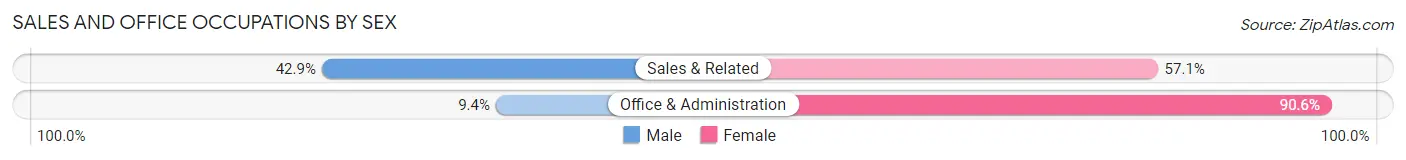
| Occupation | Male | Female |
| Sales & Related | 6 (42.9%) | 8 (57.1%) |
| Office & Administration | 3 (9.4%) | 29 (90.6%) |
| Total (Category) | 9 (19.6%) | 37 (80.4%) |
| Total (Overall) | 114 (50.7%) | 111 (49.3%) |
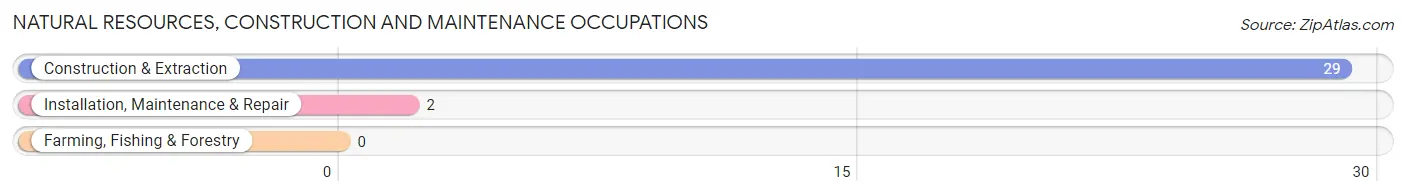
Natural Resources, Construction and Maintenance Occupations
The most common Natural Resources, Construction and Maintenance occupations in Payne Springs are Construction & Extraction (29 | 12.9%), and Installation, Maintenance & Repair (2 | 0.9%).
Natural Resources, Construction and Maintenance Occupations by Sex
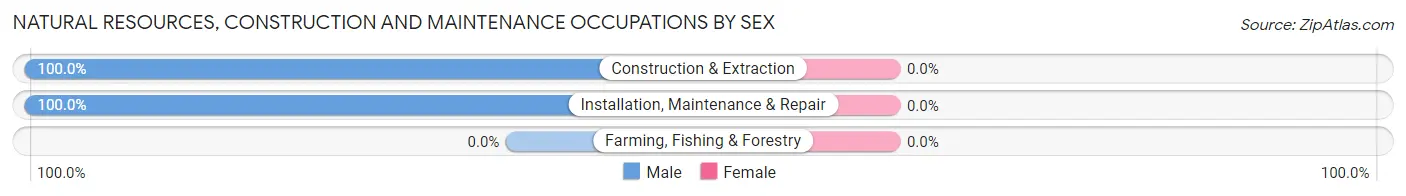
| Occupation | Male | Female |
| Farming, Fishing & Forestry | 0 (0.0%) | 0 (0.0%) |
| Construction & Extraction | 29 (100.0%) | 0 (0.0%) |
| Installation, Maintenance & Repair | 2 (100.0%) | 0 (0.0%) |
| Total (Category) | 31 (100.0%) | 0 (0.0%) |
| Total (Overall) | 114 (50.7%) | 111 (49.3%) |
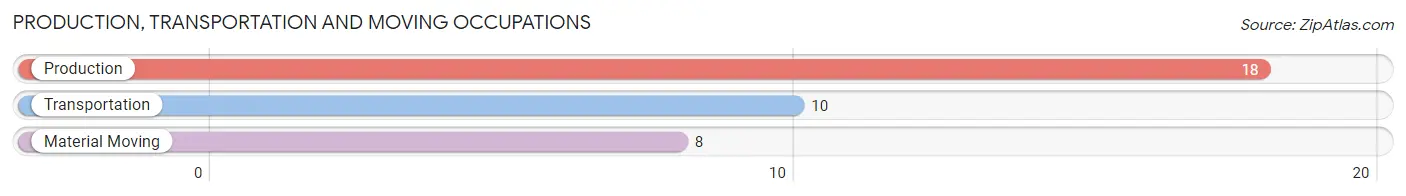
Production, Transportation and Moving Occupations
The most common Production, Transportation and Moving occupations in Payne Springs are Production (18 | 8.0%), Transportation (10 | 4.4%), and Material Moving (8 | 3.6%).
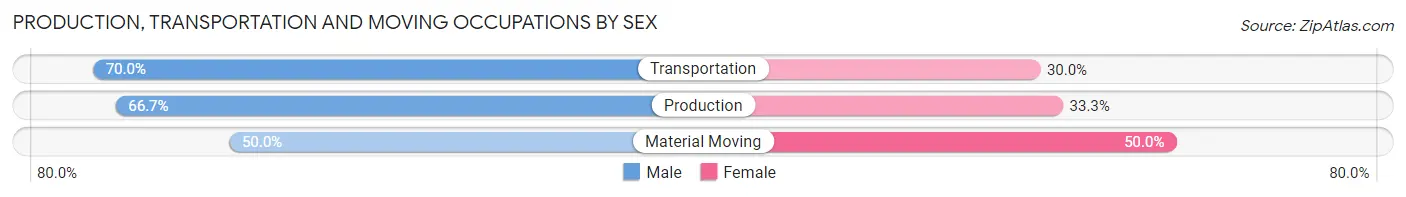
Production, Transportation and Moving Occupations by Sex
| Occupation | Male | Female |
| Production | 12 (66.7%) | 6 (33.3%) |
| Transportation | 7 (70.0%) | 3 (30.0%) |
| Material Moving | 4 (50.0%) | 4 (50.0%) |
| Total (Category) | 23 (63.9%) | 13 (36.1%) |
| Total (Overall) | 114 (50.7%) | 111 (49.3%) |
Employment Industries by Sex in Payne Springs
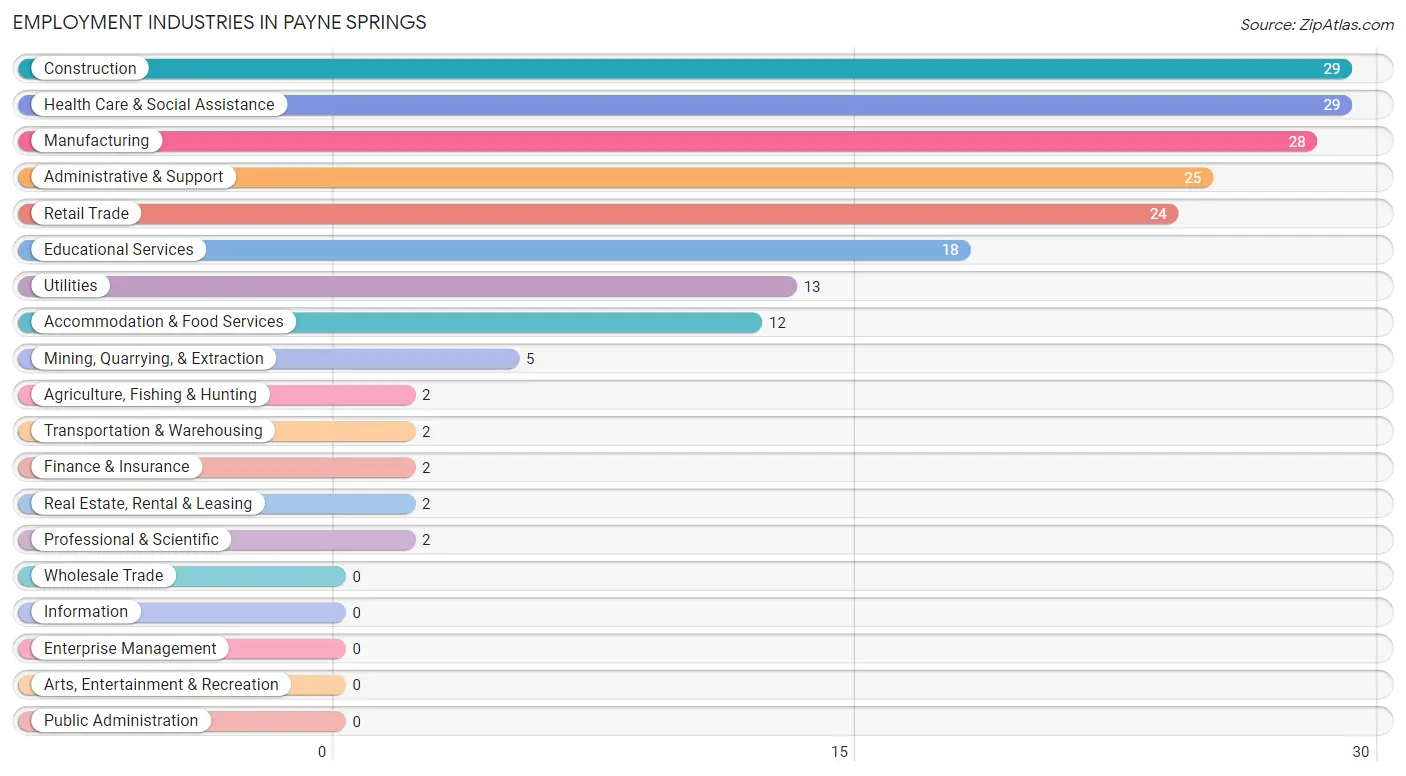
Employment Industries in Payne Springs
The major employment industries in Payne Springs include Construction (29 | 12.9%), Health Care & Social Assistance (29 | 12.9%), Manufacturing (28 | 12.4%), Administrative & Support (25 | 11.1%), and Retail Trade (24 | 10.7%).
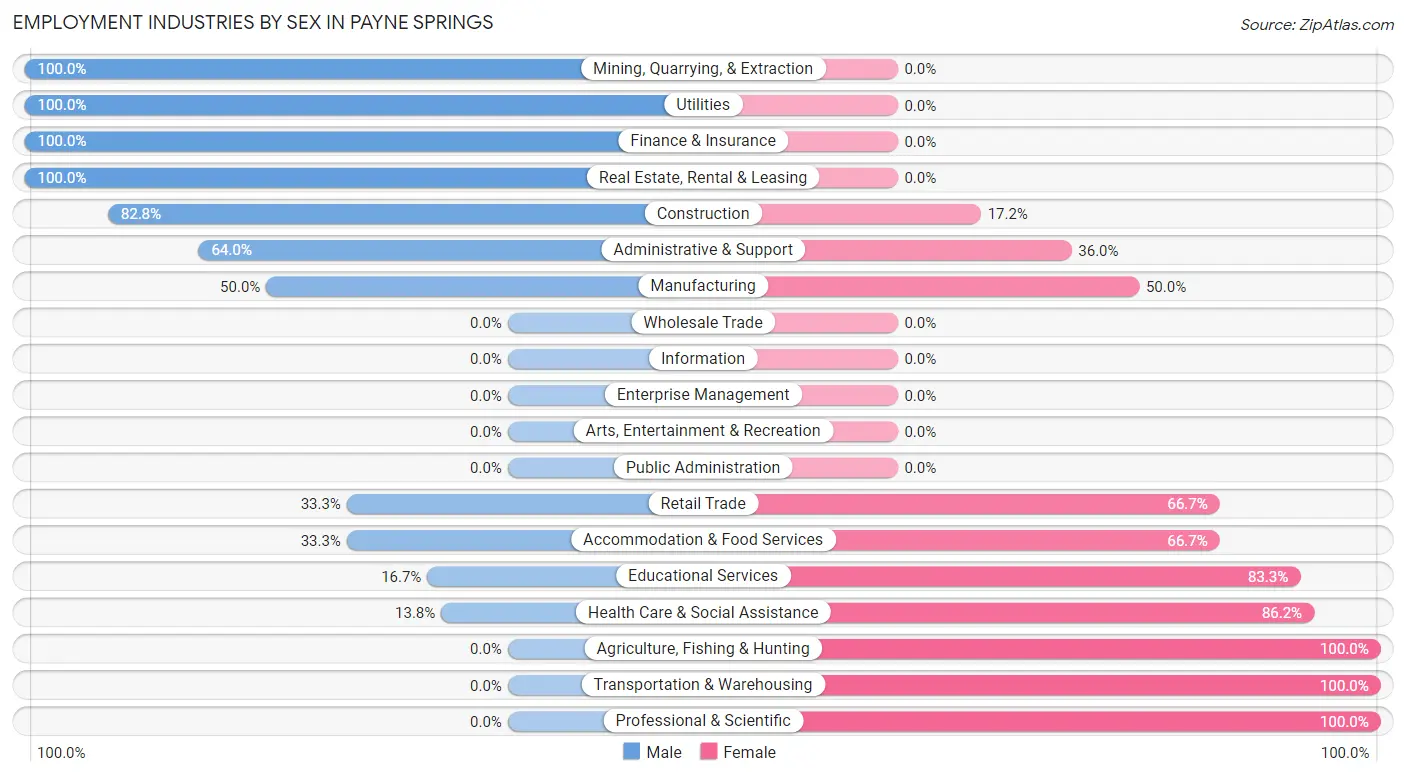
Employment Industries by Sex in Payne Springs
The Payne Springs industries that see more men than women are Mining, Quarrying, & Extraction (100.0%), Utilities (100.0%), and Finance & Insurance (100.0%), whereas the industries that tend to have a higher number of women are Agriculture, Fishing & Hunting (100.0%), Transportation & Warehousing (100.0%), and Professional & Scientific (100.0%).
| Industry | Male | Female |
| Agriculture, Fishing & Hunting | 0 (0.0%) | 2 (100.0%) |
| Mining, Quarrying, & Extraction | 5 (100.0%) | 0 (0.0%) |
| Construction | 24 (82.8%) | 5 (17.2%) |
| Manufacturing | 14 (50.0%) | 14 (50.0%) |
| Wholesale Trade | 0 (0.0%) | 0 (0.0%) |
| Retail Trade | 8 (33.3%) | 16 (66.7%) |
| Transportation & Warehousing | 0 (0.0%) | 2 (100.0%) |
| Utilities | 13 (100.0%) | 0 (0.0%) |
| Information | 0 (0.0%) | 0 (0.0%) |
| Finance & Insurance | 2 (100.0%) | 0 (0.0%) |
| Real Estate, Rental & Leasing | 2 (100.0%) | 0 (0.0%) |
| Professional & Scientific | 0 (0.0%) | 2 (100.0%) |
| Enterprise Management | 0 (0.0%) | 0 (0.0%) |
| Administrative & Support | 16 (64.0%) | 9 (36.0%) |
| Educational Services | 3 (16.7%) | 15 (83.3%) |
| Health Care & Social Assistance | 4 (13.8%) | 25 (86.2%) |
| Arts, Entertainment & Recreation | 0 (0.0%) | 0 (0.0%) |
| Accommodation & Food Services | 4 (33.3%) | 8 (66.7%) |
| Public Administration | 0 (0.0%) | 0 (0.0%) |
| Total | 114 (50.7%) | 111 (49.3%) |
Education in Payne Springs
School Enrollment in Payne Springs
The most common levels of schooling among the 71 students in Payne Springs are college / undergraduate (26 | 36.6%), elementary school (25 | 35.2%), and high school (16 | 22.5%).
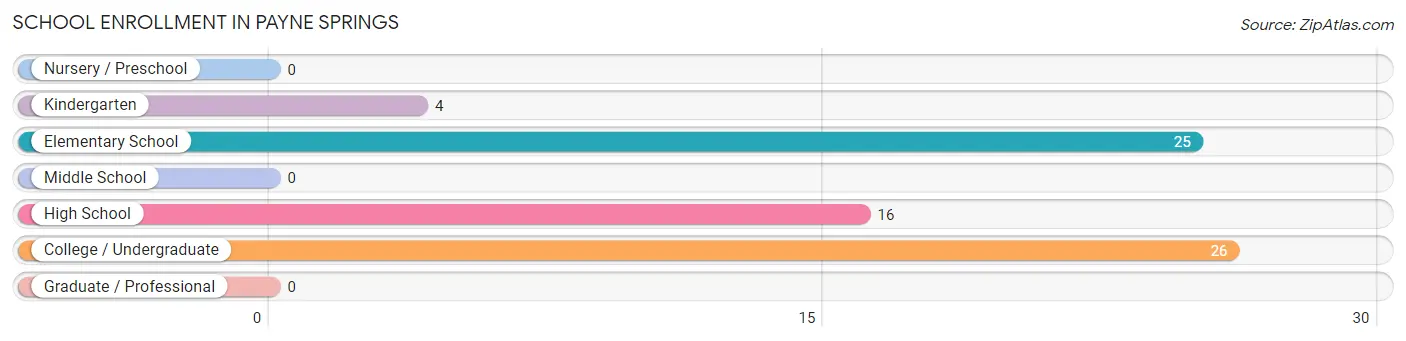
| School Level | # Students | % Students |
| Nursery / Preschool | 0 | 0.0% |
| Kindergarten | 4 | 5.6% |
| Elementary School | 25 | 35.2% |
| Middle School | 0 | 0.0% |
| High School | 16 | 22.5% |
| College / Undergraduate | 26 | 36.6% |
| Graduate / Professional | 0 | 0.0% |
| Total | 71 | 100.0% |
School Enrollment by Age by Funding Source in Payne Springs
Out of a total of 71 students who are enrolled in schools in Payne Springs, 5 (7.0%) attend a private institution, while the remaining 66 (93.0%) are enrolled in public schools. The age group of 35 years and over has the highest likelihood of being enrolled in private schools, with 5 (100.0% in the age bracket) enrolled. Conversely, the age group of 5 to 9 year old has the lowest likelihood of being enrolled in a private school, with 29 (100.0% in the age bracket) attending a public institution.
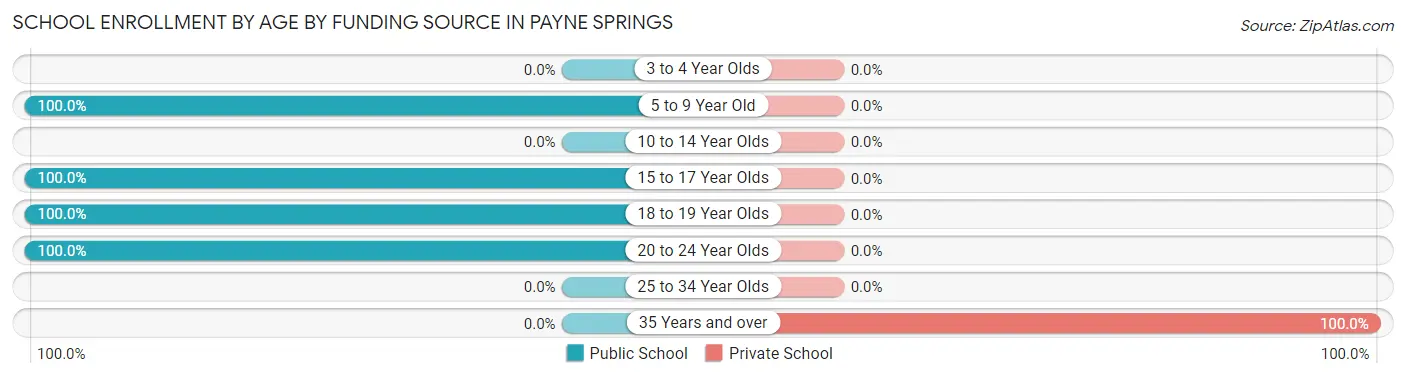
| Age Bracket | Public School | Private School |
| 3 to 4 Year Olds | 0 (0.0%) | 0 (0.0%) |
| 5 to 9 Year Old | 29 (100.0%) | 0 (0.0%) |
| 10 to 14 Year Olds | 0 (0.0%) | 0 (0.0%) |
| 15 to 17 Year Olds | 12 (100.0%) | 0 (0.0%) |
| 18 to 19 Year Olds | 4 (100.0%) | 0 (0.0%) |
| 20 to 24 Year Olds | 21 (100.0%) | 0 (0.0%) |
| 25 to 34 Year Olds | 0 (0.0%) | 0 (0.0%) |
| 35 Years and over | 0 (0.0%) | 5 (100.0%) |
| Total | 66 (93.0%) | 5 (7.0%) |
Educational Attainment by Field of Study in Payne Springs
Business (18 | 27.3%), education (12 | 18.2%), engineering (10 | 15.1%), science & technology (9 | 13.6%), and visual & performing arts (8 | 12.1%) are the most common fields of study among 66 individuals in Payne Springs who have obtained a bachelor's degree or higher.
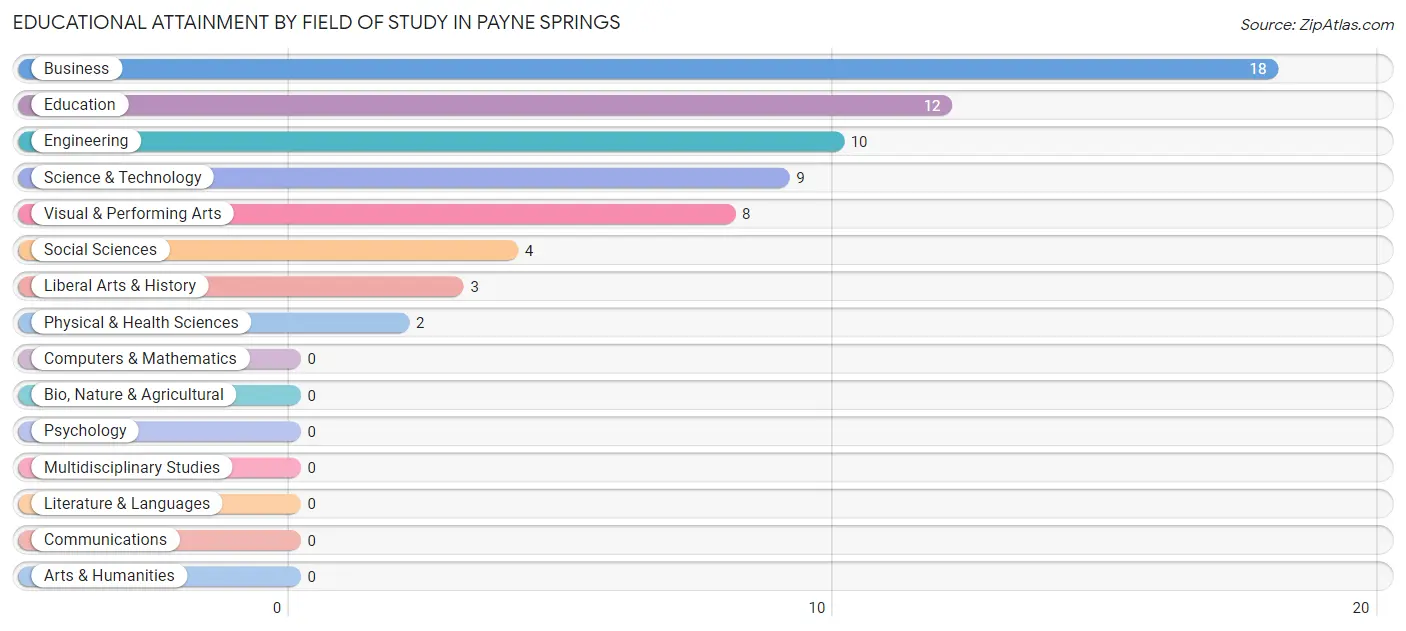
| Field of Study | # Graduates | % Graduates |
| Computers & Mathematics | 0 | 0.0% |
| Bio, Nature & Agricultural | 0 | 0.0% |
| Physical & Health Sciences | 2 | 3.0% |
| Psychology | 0 | 0.0% |
| Social Sciences | 4 | 6.1% |
| Engineering | 10 | 15.1% |
| Multidisciplinary Studies | 0 | 0.0% |
| Science & Technology | 9 | 13.6% |
| Business | 18 | 27.3% |
| Education | 12 | 18.2% |
| Literature & Languages | 0 | 0.0% |
| Liberal Arts & History | 3 | 4.5% |
| Visual & Performing Arts | 8 | 12.1% |
| Communications | 0 | 0.0% |
| Arts & Humanities | 0 | 0.0% |
| Total | 66 | 100.0% |
Transportation & Commute in Payne Springs
Vehicle Availability by Sex in Payne Springs
The most prevalent vehicle ownership categories in Payne Springs are males with 2 vehicles (70, accounting for 61.4%) and females with 2 vehicles (37, making up 63.1%).
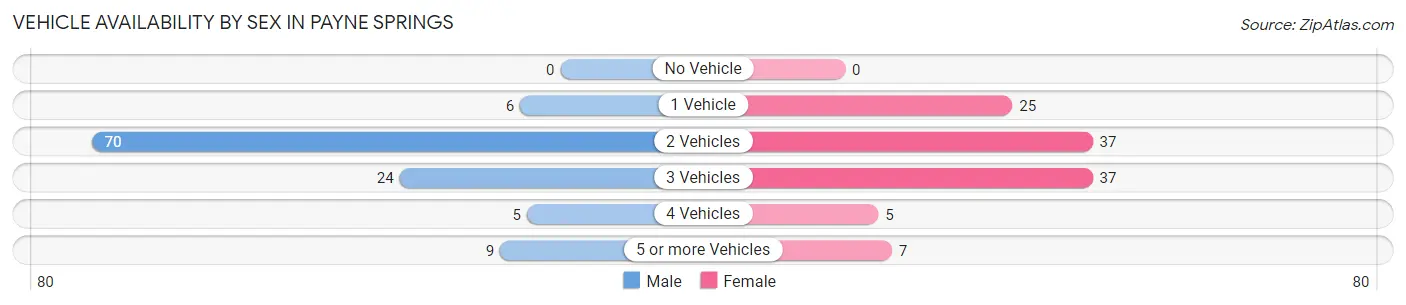
| Vehicles Available | Male | Female |
| No Vehicle | 0 (0.0%) | 0 (0.0%) |
| 1 Vehicle | 6 (5.3%) | 25 (22.5%) |
| 2 Vehicles | 70 (61.4%) | 37 (33.3%) |
| 3 Vehicles | 24 (21.0%) | 37 (33.3%) |
| 4 Vehicles | 5 (4.4%) | 5 (4.5%) |
| 5 or more Vehicles | 9 (7.9%) | 7 (6.3%) |
| Total | 114 (100.0%) | 111 (100.0%) |
Commute Time in Payne Springs
The most frequently occuring commute durations in Payne Springs are 10 to 14 minutes (50 commuters, 22.5%), 15 to 19 minutes (45 commuters, 20.3%), and 25 to 29 minutes (25 commuters, 11.3%).
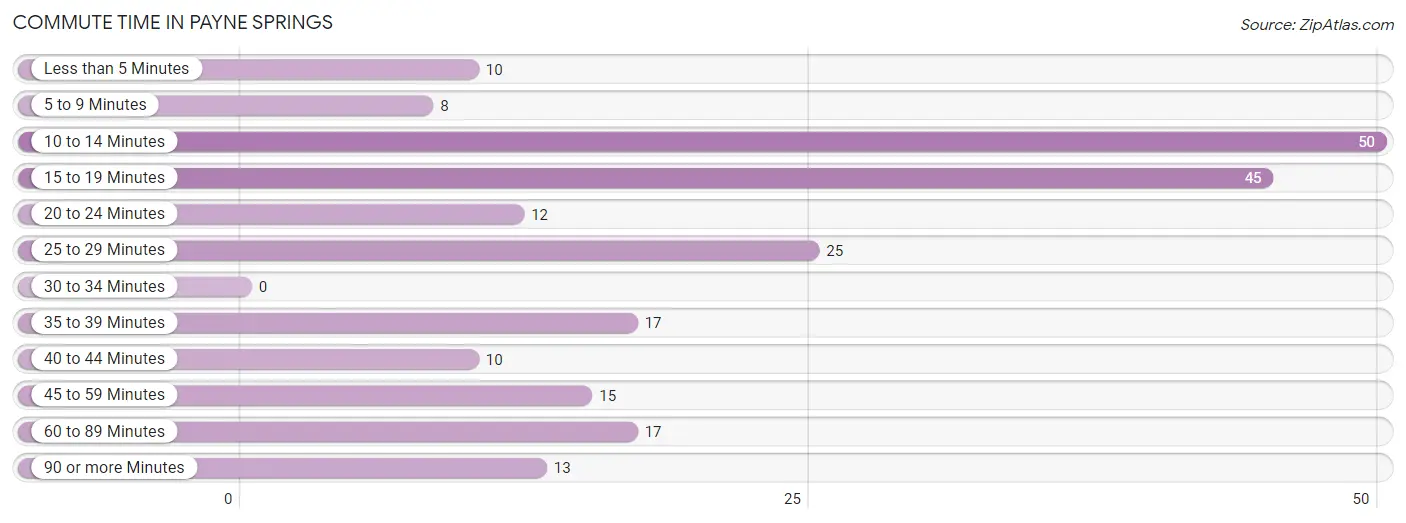
| Commute Time | # Commuters | % Commuters |
| Less than 5 Minutes | 10 | 4.5% |
| 5 to 9 Minutes | 8 | 3.6% |
| 10 to 14 Minutes | 50 | 22.5% |
| 15 to 19 Minutes | 45 | 20.3% |
| 20 to 24 Minutes | 12 | 5.4% |
| 25 to 29 Minutes | 25 | 11.3% |
| 30 to 34 Minutes | 0 | 0.0% |
| 35 to 39 Minutes | 17 | 7.7% |
| 40 to 44 Minutes | 10 | 4.5% |
| 45 to 59 Minutes | 15 | 6.8% |
| 60 to 89 Minutes | 17 | 7.7% |
| 90 or more Minutes | 13 | 5.9% |
Commute Time by Sex in Payne Springs
The most common commute times in Payne Springs are 15 to 19 minutes (32 commuters, 28.3%) for males and 10 to 14 minutes (31 commuters, 28.4%) for females.
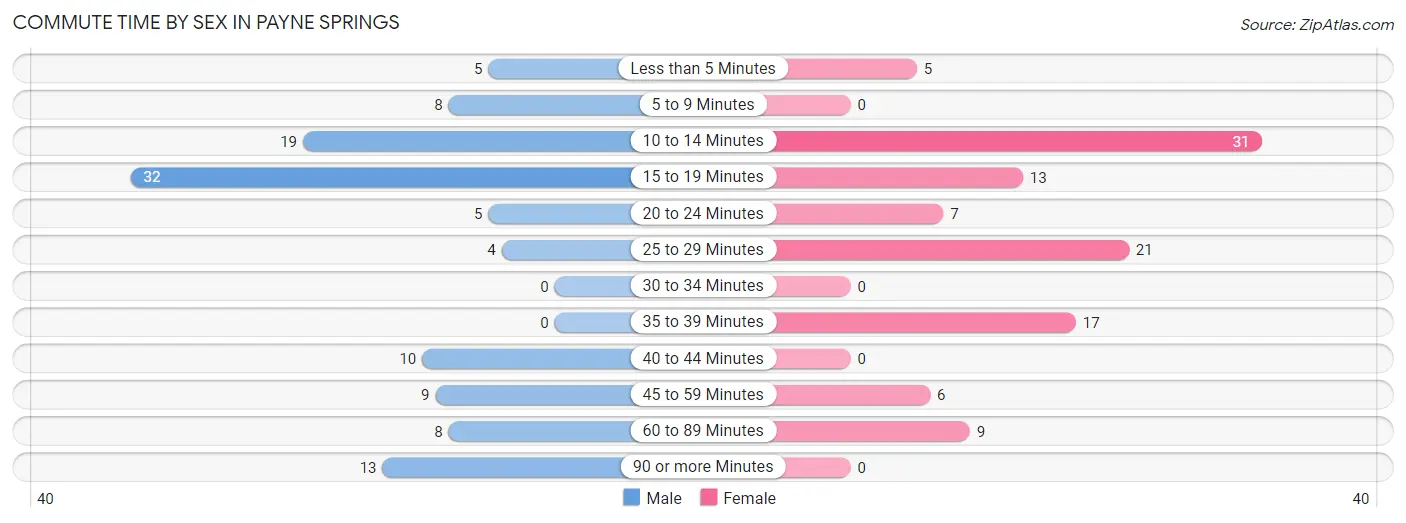
| Commute Time | Male | Female |
| Less than 5 Minutes | 5 (4.4%) | 5 (4.6%) |
| 5 to 9 Minutes | 8 (7.1%) | 0 (0.0%) |
| 10 to 14 Minutes | 19 (16.8%) | 31 (28.4%) |
| 15 to 19 Minutes | 32 (28.3%) | 13 (11.9%) |
| 20 to 24 Minutes | 5 (4.4%) | 7 (6.4%) |
| 25 to 29 Minutes | 4 (3.5%) | 21 (19.3%) |
| 30 to 34 Minutes | 0 (0.0%) | 0 (0.0%) |
| 35 to 39 Minutes | 0 (0.0%) | 17 (15.6%) |
| 40 to 44 Minutes | 10 (8.8%) | 0 (0.0%) |
| 45 to 59 Minutes | 9 (8.0%) | 6 (5.5%) |
| 60 to 89 Minutes | 8 (7.1%) | 9 (8.3%) |
| 90 or more Minutes | 13 (11.5%) | 0 (0.0%) |
Time of Departure to Work by Sex in Payne Springs
The most frequent times of departure to work in Payne Springs are 6:00 AM to 6:29 AM (21, 18.6%) for males and 7:00 AM to 7:29 AM (21, 19.3%) for females.
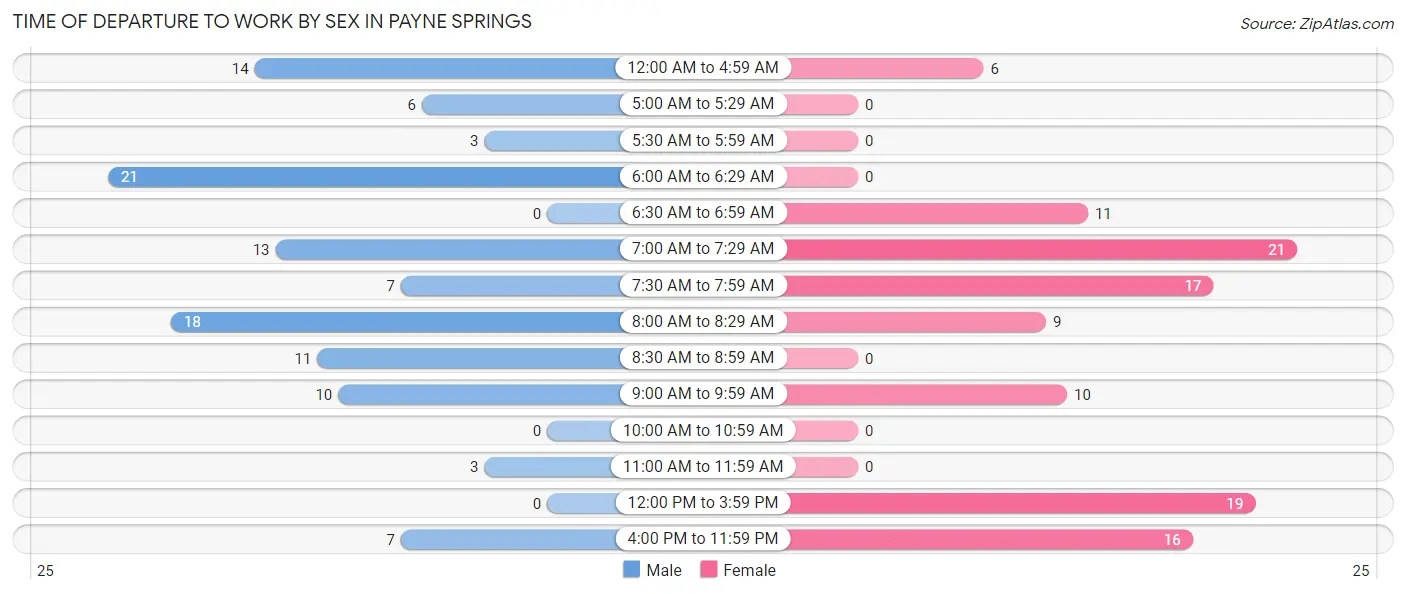
| Time of Departure | Male | Female |
| 12:00 AM to 4:59 AM | 14 (12.4%) | 6 (5.5%) |
| 5:00 AM to 5:29 AM | 6 (5.3%) | 0 (0.0%) |
| 5:30 AM to 5:59 AM | 3 (2.6%) | 0 (0.0%) |
| 6:00 AM to 6:29 AM | 21 (18.6%) | 0 (0.0%) |
| 6:30 AM to 6:59 AM | 0 (0.0%) | 11 (10.1%) |
| 7:00 AM to 7:29 AM | 13 (11.5%) | 21 (19.3%) |
| 7:30 AM to 7:59 AM | 7 (6.2%) | 17 (15.6%) |
| 8:00 AM to 8:29 AM | 18 (15.9%) | 9 (8.3%) |
| 8:30 AM to 8:59 AM | 11 (9.7%) | 0 (0.0%) |
| 9:00 AM to 9:59 AM | 10 (8.8%) | 10 (9.2%) |
| 10:00 AM to 10:59 AM | 0 (0.0%) | 0 (0.0%) |
| 11:00 AM to 11:59 AM | 3 (2.6%) | 0 (0.0%) |
| 12:00 PM to 3:59 PM | 0 (0.0%) | 19 (17.4%) |
| 4:00 PM to 11:59 PM | 7 (6.2%) | 16 (14.7%) |
| Total | 113 (100.0%) | 109 (100.0%) |
Housing Occupancy in Payne Springs
Occupancy by Ownership in Payne Springs
Of the total 270 dwellings in Payne Springs, owner-occupied units account for 227 (84.1%), while renter-occupied units make up 43 (15.9%).
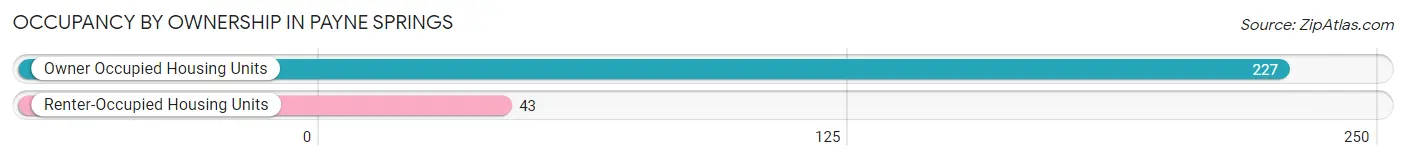
| Occupancy | # Housing Units | % Housing Units |
| Owner Occupied Housing Units | 227 | 84.1% |
| Renter-Occupied Housing Units | 43 | 15.9% |
| Total Occupied Housing Units | 270 | 100.0% |
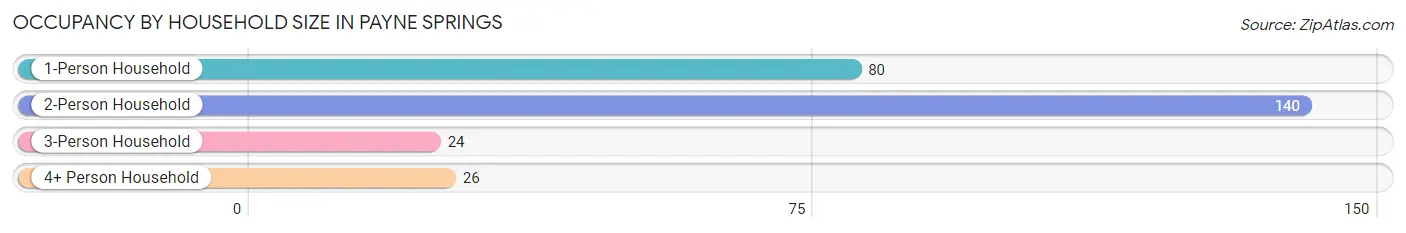
Occupancy by Household Size in Payne Springs
| Household Size | # Housing Units | % Housing Units |
| 1-Person Household | 80 | 29.6% |
| 2-Person Household | 140 | 51.8% |
| 3-Person Household | 24 | 8.9% |
| 4+ Person Household | 26 | 9.6% |
| Total Housing Units | 270 | 100.0% |
Occupancy by Ownership by Household Size in Payne Springs
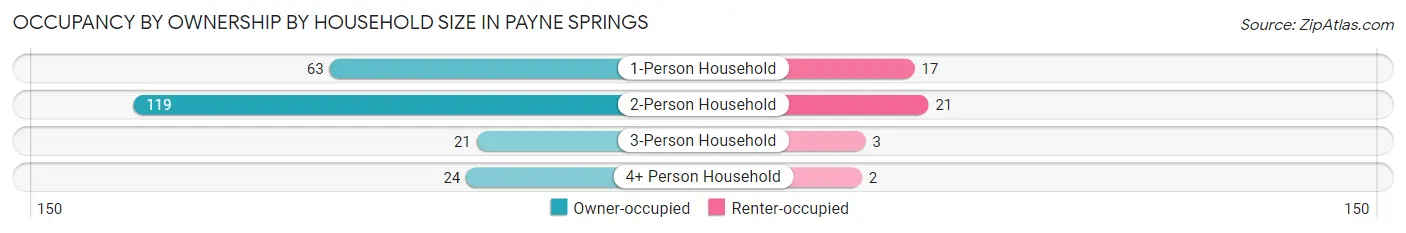
| Household Size | Owner-occupied | Renter-occupied |
| 1-Person Household | 63 (78.7%) | 17 (21.2%) |
| 2-Person Household | 119 (85.0%) | 21 (15.0%) |
| 3-Person Household | 21 (87.5%) | 3 (12.5%) |
| 4+ Person Household | 24 (92.3%) | 2 (7.7%) |
| Total Housing Units | 227 (84.1%) | 43 (15.9%) |
Occupancy by Educational Attainment in Payne Springs
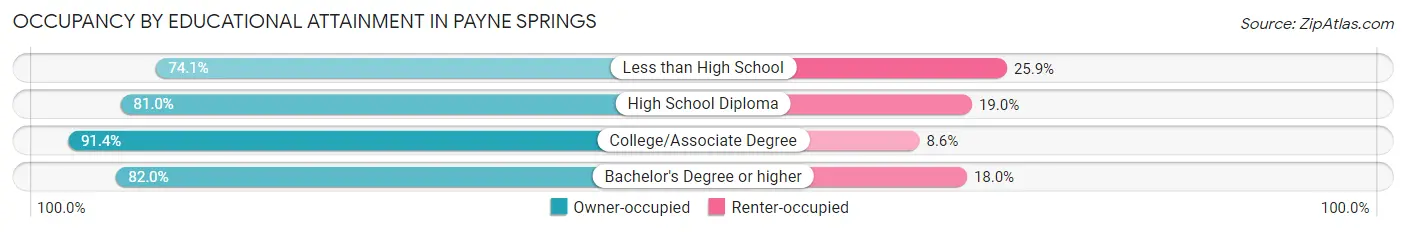
| Household Size | Owner-occupied | Renter-occupied |
| Less than High School | 20 (74.1%) | 7 (25.9%) |
| High School Diploma | 81 (81.0%) | 19 (19.0%) |
| College/Associate Degree | 85 (91.4%) | 8 (8.6%) |
| Bachelor's Degree or higher | 41 (82.0%) | 9 (18.0%) |
Occupancy by Age of Householder in Payne Springs
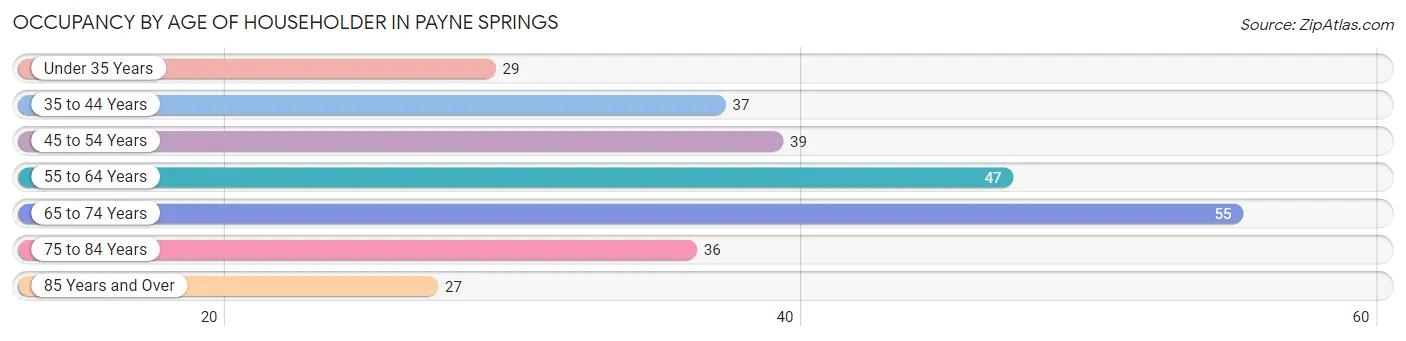
| Age Bracket | # Households | % Households |
| Under 35 Years | 29 | 10.7% |
| 35 to 44 Years | 37 | 13.7% |
| 45 to 54 Years | 39 | 14.4% |
| 55 to 64 Years | 47 | 17.4% |
| 65 to 74 Years | 55 | 20.4% |
| 75 to 84 Years | 36 | 13.3% |
| 85 Years and Over | 27 | 10.0% |
| Total | 270 | 100.0% |
Housing Finances in Payne Springs
Median Income by Occupancy in Payne Springs
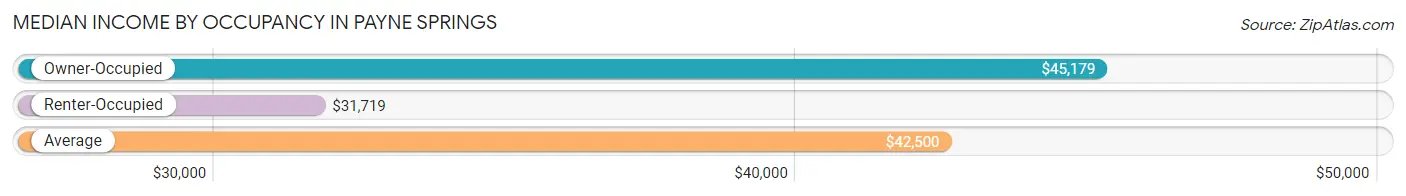
| Occupancy Type | # Households | Median Income |
| Owner-Occupied | 227 (84.1%) | $45,179 |
| Renter-Occupied | 43 (15.9%) | $31,719 |
| Average | 270 (100.0%) | $42,500 |
Occupancy by Householder Income Bracket in Payne Springs
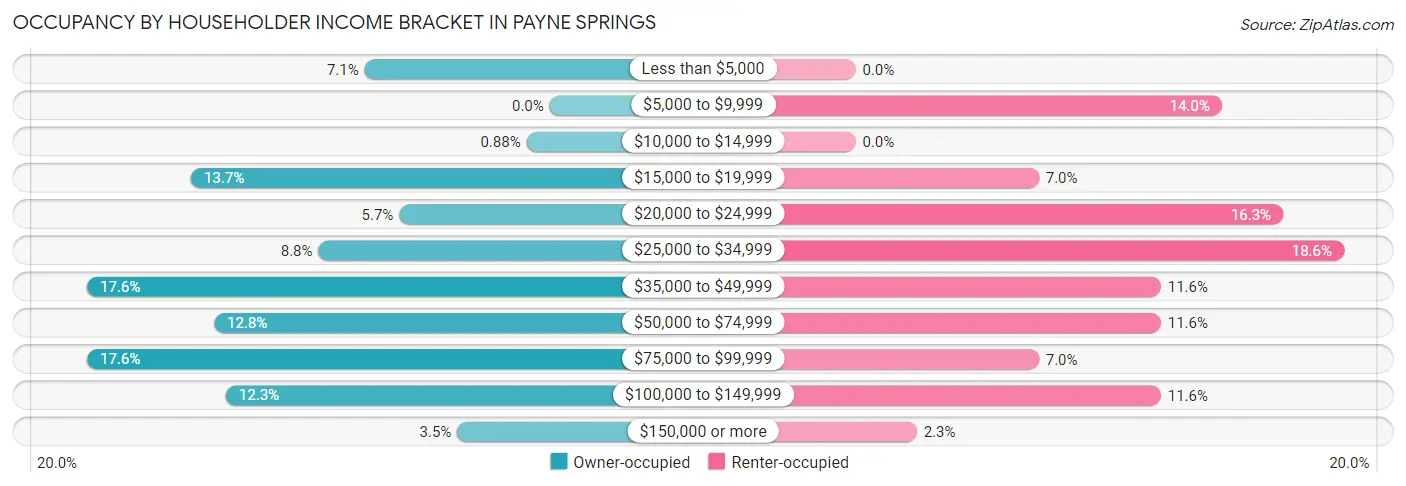
| Income Bracket | Owner-occupied | Renter-occupied |
| Less than $5,000 | 16 (7.0%) | 0 (0.0%) |
| $5,000 to $9,999 | 0 (0.0%) | 6 (14.0%) |
| $10,000 to $14,999 | 2 (0.9%) | 0 (0.0%) |
| $15,000 to $19,999 | 31 (13.7%) | 3 (7.0%) |
| $20,000 to $24,999 | 13 (5.7%) | 7 (16.3%) |
| $25,000 to $34,999 | 20 (8.8%) | 8 (18.6%) |
| $35,000 to $49,999 | 40 (17.6%) | 5 (11.6%) |
| $50,000 to $74,999 | 29 (12.8%) | 5 (11.6%) |
| $75,000 to $99,999 | 40 (17.6%) | 3 (7.0%) |
| $100,000 to $149,999 | 28 (12.3%) | 5 (11.6%) |
| $150,000 or more | 8 (3.5%) | 1 (2.3%) |
| Total | 227 (100.0%) | 43 (100.0%) |
Monthly Housing Cost Tiers in Payne Springs
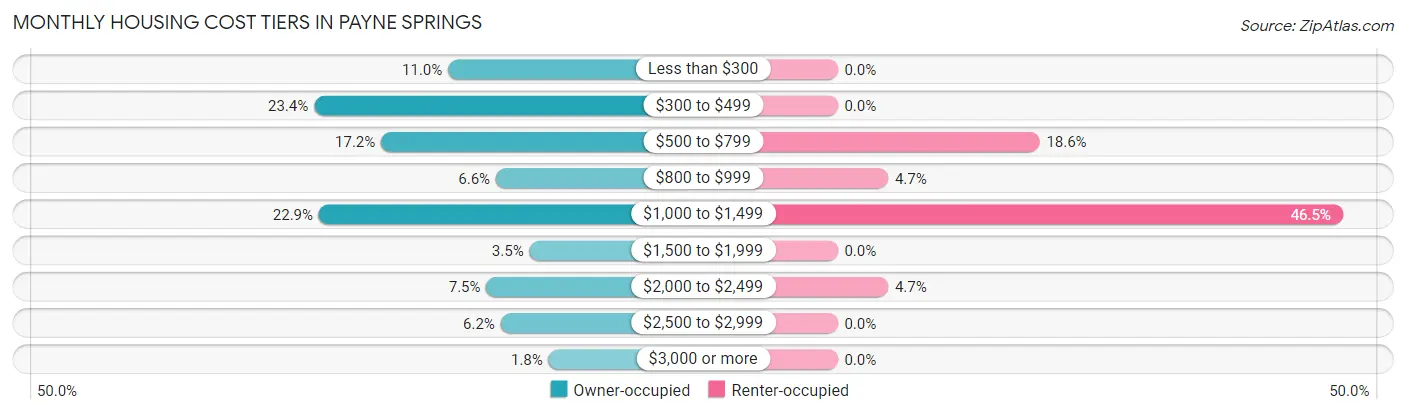
| Monthly Cost | Owner-occupied | Renter-occupied |
| Less than $300 | 25 (11.0%) | 0 (0.0%) |
| $300 to $499 | 53 (23.4%) | 0 (0.0%) |
| $500 to $799 | 39 (17.2%) | 8 (18.6%) |
| $800 to $999 | 15 (6.6%) | 2 (4.6%) |
| $1,000 to $1,499 | 52 (22.9%) | 20 (46.5%) |
| $1,500 to $1,999 | 8 (3.5%) | 0 (0.0%) |
| $2,000 to $2,499 | 17 (7.5%) | 2 (4.6%) |
| $2,500 to $2,999 | 14 (6.2%) | 0 (0.0%) |
| $3,000 or more | 4 (1.8%) | 0 (0.0%) |
| Total | 227 (100.0%) | 43 (100.0%) |
Physical Housing Characteristics in Payne Springs
Housing Structures in Payne Springs
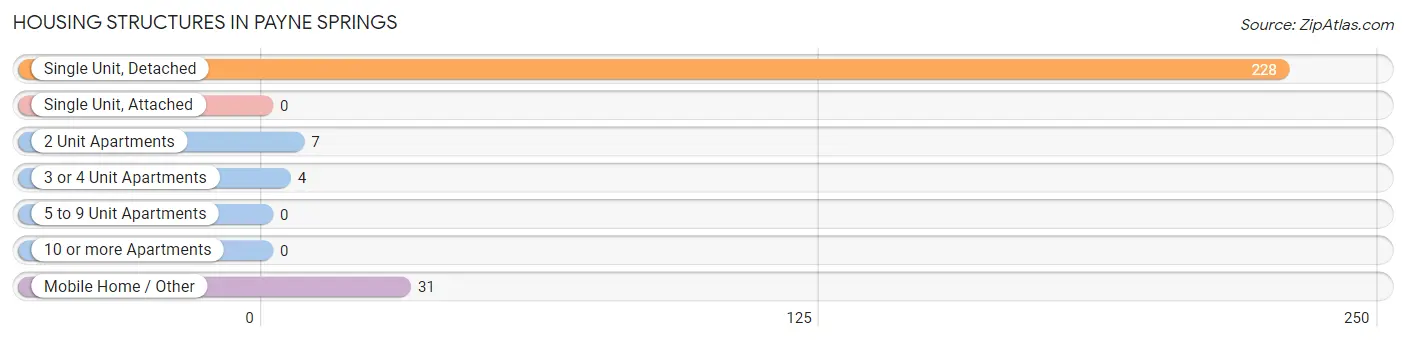
| Structure Type | # Housing Units | % Housing Units |
| Single Unit, Detached | 228 | 84.4% |
| Single Unit, Attached | 0 | 0.0% |
| 2 Unit Apartments | 7 | 2.6% |
| 3 or 4 Unit Apartments | 4 | 1.5% |
| 5 to 9 Unit Apartments | 0 | 0.0% |
| 10 or more Apartments | 0 | 0.0% |
| Mobile Home / Other | 31 | 11.5% |
| Total | 270 | 100.0% |
Housing Structures by Occupancy in Payne Springs
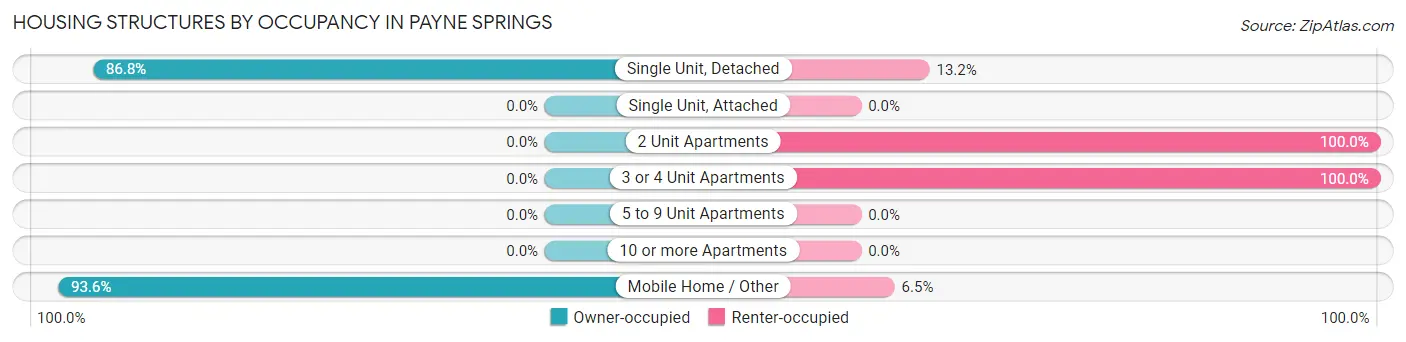
| Structure Type | Owner-occupied | Renter-occupied |
| Single Unit, Detached | 198 (86.8%) | 30 (13.2%) |
| Single Unit, Attached | 0 (0.0%) | 0 (0.0%) |
| 2 Unit Apartments | 0 (0.0%) | 7 (100.0%) |
| 3 or 4 Unit Apartments | 0 (0.0%) | 4 (100.0%) |
| 5 to 9 Unit Apartments | 0 (0.0%) | 0 (0.0%) |
| 10 or more Apartments | 0 (0.0%) | 0 (0.0%) |
| Mobile Home / Other | 29 (93.5%) | 2 (6.5%) |
| Total | 227 (84.1%) | 43 (15.9%) |
Housing Structures by Number of Rooms in Payne Springs
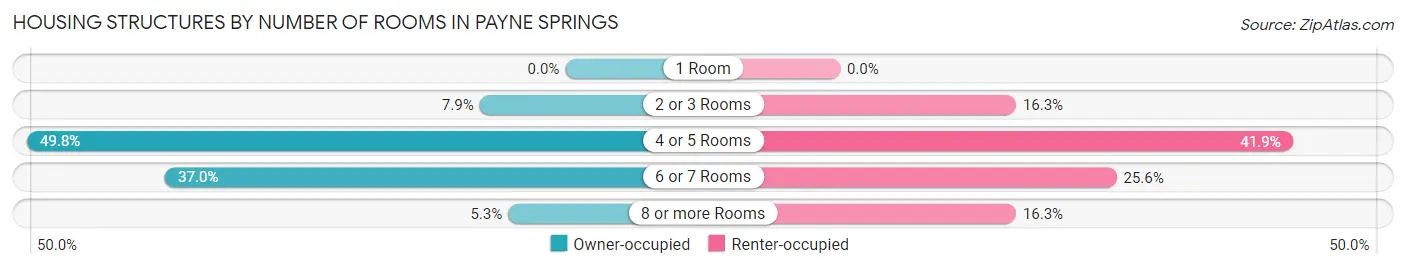
| Number of Rooms | Owner-occupied | Renter-occupied |
| 1 Room | 0 (0.0%) | 0 (0.0%) |
| 2 or 3 Rooms | 18 (7.9%) | 7 (16.3%) |
| 4 or 5 Rooms | 113 (49.8%) | 18 (41.9%) |
| 6 or 7 Rooms | 84 (37.0%) | 11 (25.6%) |
| 8 or more Rooms | 12 (5.3%) | 7 (16.3%) |
| Total | 227 (100.0%) | 43 (100.0%) |
Housing Structure by Heating Type in Payne Springs
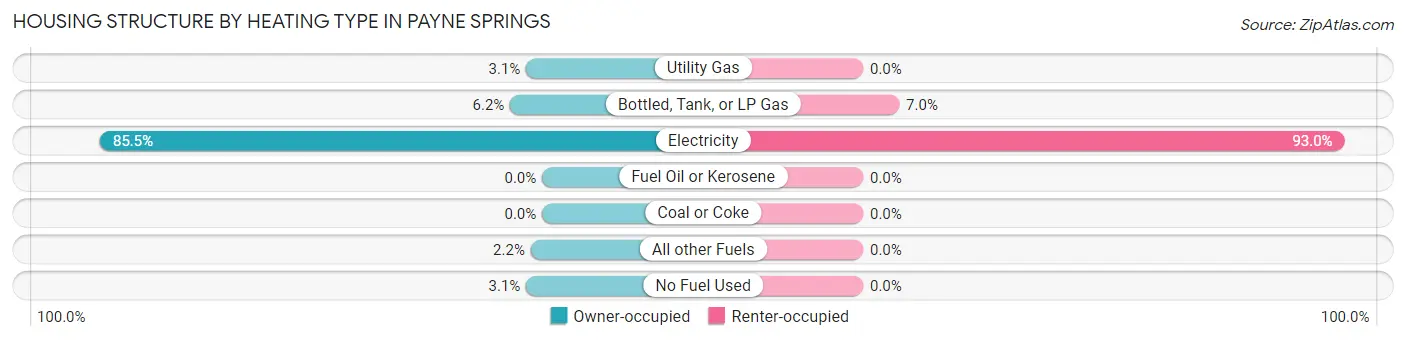
| Heating Type | Owner-occupied | Renter-occupied |
| Utility Gas | 7 (3.1%) | 0 (0.0%) |
| Bottled, Tank, or LP Gas | 14 (6.2%) | 3 (7.0%) |
| Electricity | 194 (85.5%) | 40 (93.0%) |
| Fuel Oil or Kerosene | 0 (0.0%) | 0 (0.0%) |
| Coal or Coke | 0 (0.0%) | 0 (0.0%) |
| All other Fuels | 5 (2.2%) | 0 (0.0%) |
| No Fuel Used | 7 (3.1%) | 0 (0.0%) |
| Total | 227 (100.0%) | 43 (100.0%) |
Household Vehicle Usage in Payne Springs
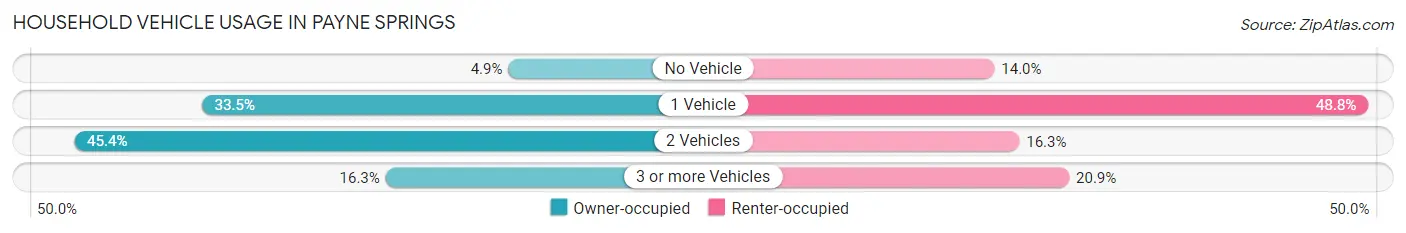
| Vehicles per Household | Owner-occupied | Renter-occupied |
| No Vehicle | 11 (4.9%) | 6 (14.0%) |
| 1 Vehicle | 76 (33.5%) | 21 (48.8%) |
| 2 Vehicles | 103 (45.4%) | 7 (16.3%) |
| 3 or more Vehicles | 37 (16.3%) | 9 (20.9%) |
| Total | 227 (100.0%) | 43 (100.0%) |
Real Estate & Mortgages in Payne Springs
Real Estate and Mortgage Overview in Payne Springs
| Characteristic | Without Mortgage | With Mortgage |
| Housing Units | 134 | 93 |
| Median Property Value | $93,300 | $194,300 |
| Median Household Income | $31,389 | $6 |
| Monthly Housing Costs | $461 | $4 |
| Real Estate Taxes | $1,015 | $3 |
Property Value by Mortgage Status in Payne Springs
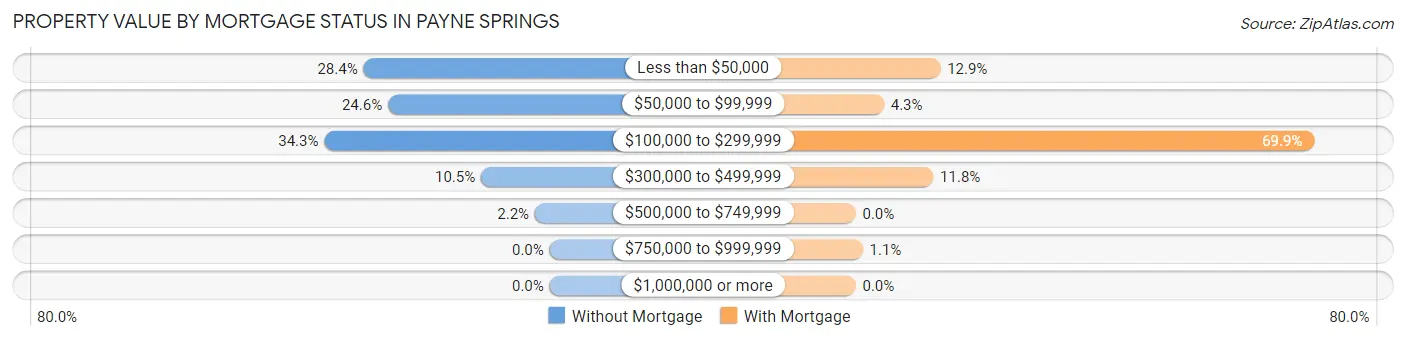
| Property Value | Without Mortgage | With Mortgage |
| Less than $50,000 | 38 (28.4%) | 12 (12.9%) |
| $50,000 to $99,999 | 33 (24.6%) | 4 (4.3%) |
| $100,000 to $299,999 | 46 (34.3%) | 65 (69.9%) |
| $300,000 to $499,999 | 14 (10.4%) | 11 (11.8%) |
| $500,000 to $749,999 | 3 (2.2%) | 0 (0.0%) |
| $750,000 to $999,999 | 0 (0.0%) | 1 (1.1%) |
| $1,000,000 or more | 0 (0.0%) | 0 (0.0%) |
| Total | 134 (100.0%) | 93 (100.0%) |
Household Income by Mortgage Status in Payne Springs
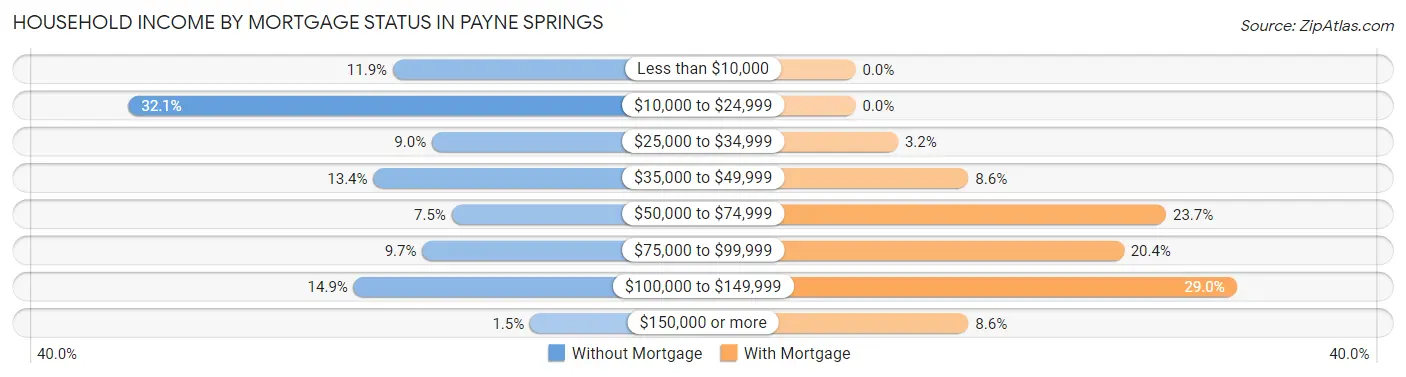
| Household Income | Without Mortgage | With Mortgage |
| Less than $10,000 | 16 (11.9%) | 0 (0.0%) |
| $10,000 to $24,999 | 43 (32.1%) | 0 (0.0%) |
| $25,000 to $34,999 | 12 (9.0%) | 3 (3.2%) |
| $35,000 to $49,999 | 18 (13.4%) | 8 (8.6%) |
| $50,000 to $74,999 | 10 (7.5%) | 22 (23.7%) |
| $75,000 to $99,999 | 13 (9.7%) | 19 (20.4%) |
| $100,000 to $149,999 | 20 (14.9%) | 27 (29.0%) |
| $150,000 or more | 2 (1.5%) | 8 (8.6%) |
| Total | 134 (100.0%) | 93 (100.0%) |
Property Value to Household Income Ratio in Payne Springs
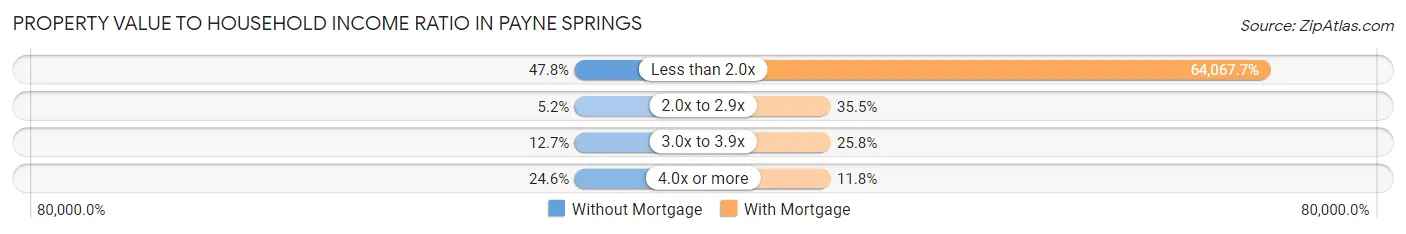
| Value-to-Income Ratio | Without Mortgage | With Mortgage |
| Less than 2.0x | 64 (47.8%) | 59,583 (64,067.7%) |
| 2.0x to 2.9x | 7 (5.2%) | 33 (35.5%) |
| 3.0x to 3.9x | 17 (12.7%) | 24 (25.8%) |
| 4.0x or more | 33 (24.6%) | 11 (11.8%) |
| Total | 134 (100.0%) | 93 (100.0%) |
Real Estate Taxes by Mortgage Status in Payne Springs
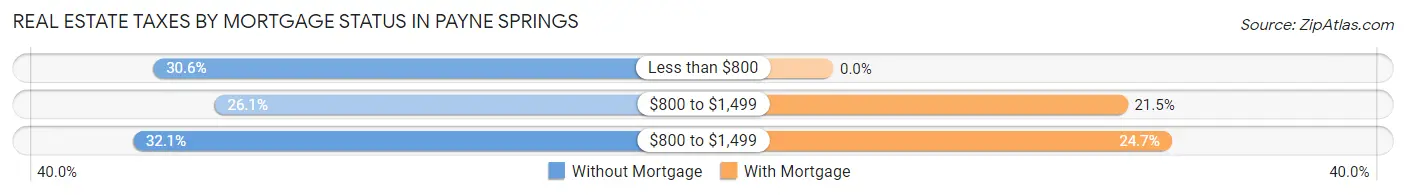
| Property Taxes | Without Mortgage | With Mortgage |
| Less than $800 | 41 (30.6%) | 0 (0.0%) |
| $800 to $1,499 | 35 (26.1%) | 20 (21.5%) |
| $800 to $1,499 | 43 (32.1%) | 23 (24.7%) |
| Total | 134 (100.0%) | 93 (100.0%) |
Health & Disability in Payne Springs
Health Insurance Coverage by Age in Payne Springs
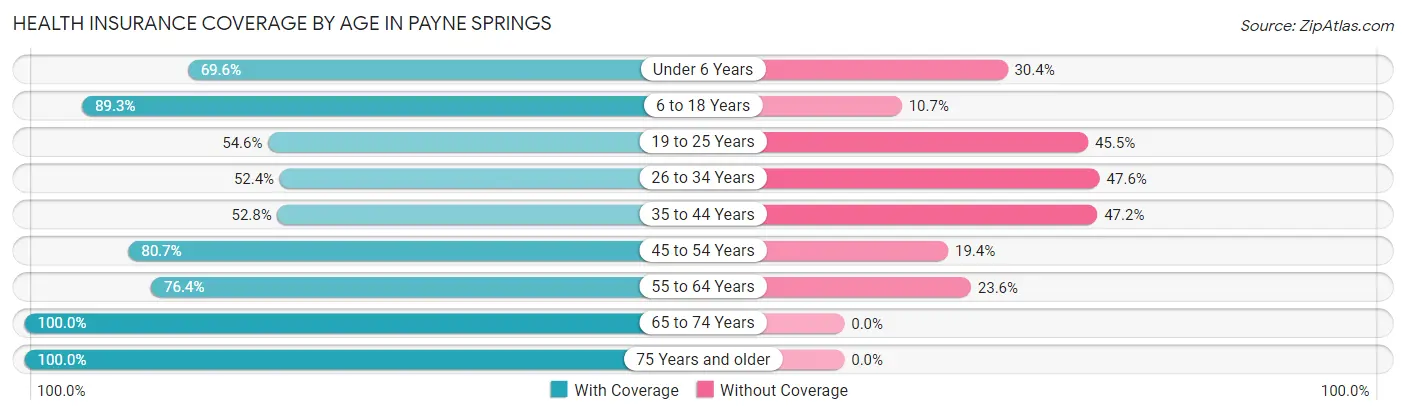
| Age Bracket | With Coverage | Without Coverage |
| Under 6 Years | 32 (69.6%) | 14 (30.4%) |
| 6 to 18 Years | 50 (89.3%) | 6 (10.7%) |
| 19 to 25 Years | 18 (54.5%) | 15 (45.5%) |
| 26 to 34 Years | 33 (52.4%) | 30 (47.6%) |
| 35 to 44 Years | 28 (52.8%) | 25 (47.2%) |
| 45 to 54 Years | 75 (80.6%) | 18 (19.4%) |
| 55 to 64 Years | 68 (76.4%) | 21 (23.6%) |
| 65 to 74 Years | 98 (100.0%) | 0 (0.0%) |
| 75 Years and older | 82 (100.0%) | 0 (0.0%) |
| Total | 484 (79.0%) | 129 (21.0%) |
Health Insurance Coverage by Citizenship Status in Payne Springs
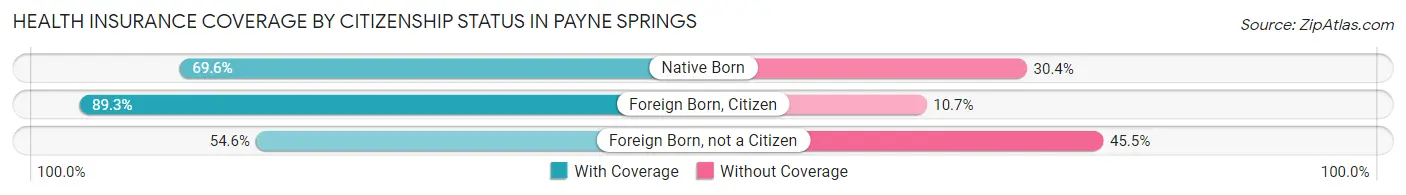
| Citizenship Status | With Coverage | Without Coverage |
| Native Born | 32 (69.6%) | 14 (30.4%) |
| Foreign Born, Citizen | 50 (89.3%) | 6 (10.7%) |
| Foreign Born, not a Citizen | 18 (54.5%) | 15 (45.5%) |
Health Insurance Coverage by Household Income in Payne Springs
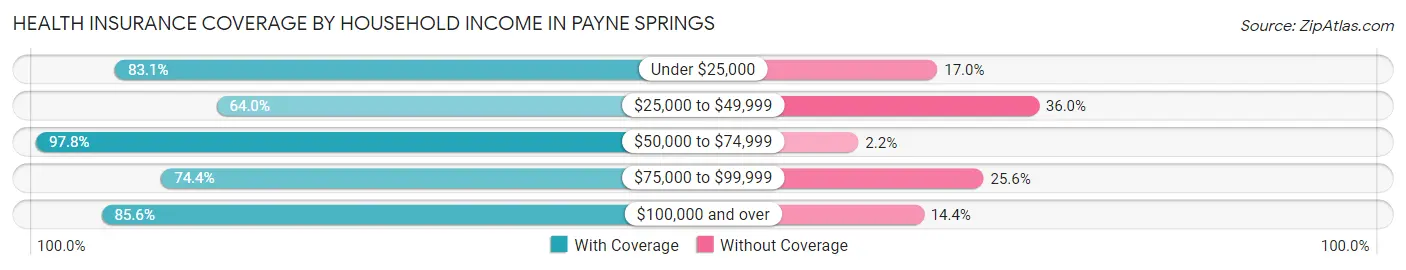
| Household Income | With Coverage | Without Coverage |
| Under $25,000 | 98 (83.1%) | 20 (17.0%) |
| $25,000 to $49,999 | 105 (64.0%) | 59 (36.0%) |
| $50,000 to $74,999 | 90 (97.8%) | 2 (2.2%) |
| $75,000 to $99,999 | 90 (74.4%) | 31 (25.6%) |
| $100,000 and over | 101 (85.6%) | 17 (14.4%) |
Public vs Private Health Insurance Coverage by Age in Payne Springs
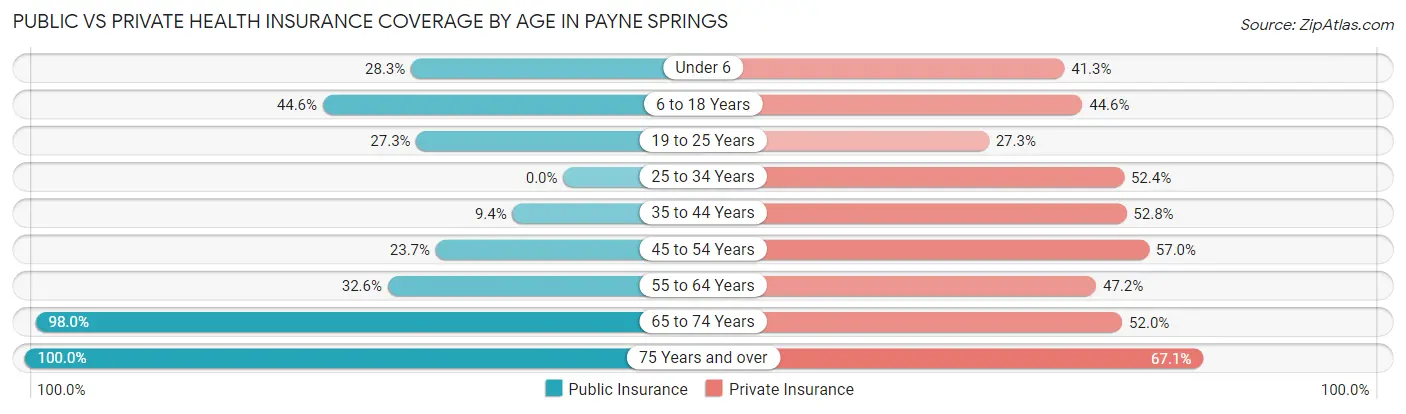
| Age Bracket | Public Insurance | Private Insurance |
| Under 6 | 13 (28.3%) | 19 (41.3%) |
| 6 to 18 Years | 25 (44.6%) | 25 (44.6%) |
| 19 to 25 Years | 9 (27.3%) | 9 (27.3%) |
| 25 to 34 Years | 0 (0.0%) | 33 (52.4%) |
| 35 to 44 Years | 5 (9.4%) | 28 (52.8%) |
| 45 to 54 Years | 22 (23.7%) | 53 (57.0%) |
| 55 to 64 Years | 29 (32.6%) | 42 (47.2%) |
| 65 to 74 Years | 96 (98.0%) | 51 (52.0%) |
| 75 Years and over | 82 (100.0%) | 55 (67.1%) |
| Total | 281 (45.8%) | 315 (51.4%) |
Disability Status by Sex by Age in Payne Springs
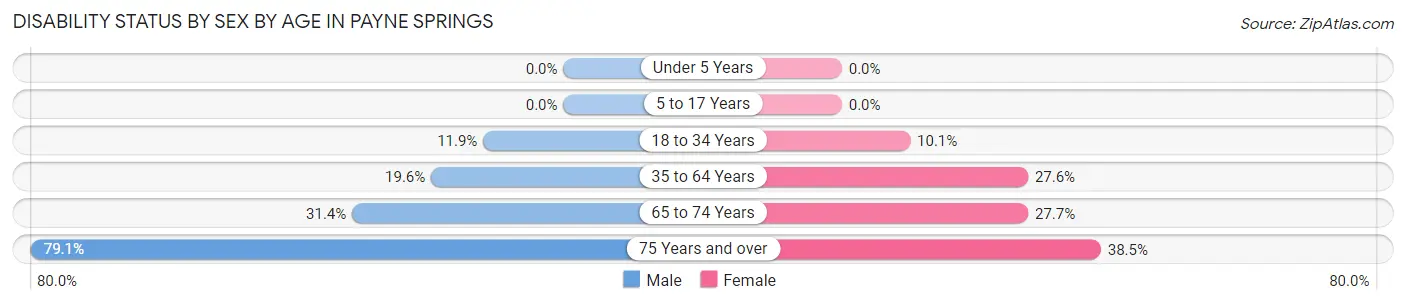
| Age Bracket | Male | Female |
| Under 5 Years | 0 (0.0%) | 0 (0.0%) |
| 5 to 17 Years | 0 (0.0%) | 0 (0.0%) |
| 18 to 34 Years | 5 (11.9%) | 7 (10.1%) |
| 35 to 64 Years | 22 (19.6%) | 34 (27.6%) |
| 65 to 74 Years | 16 (31.4%) | 13 (27.7%) |
| 75 Years and over | 34 (79.1%) | 15 (38.5%) |
Disability Class by Sex by Age in Payne Springs
Disability Class: Hearing Difficulty
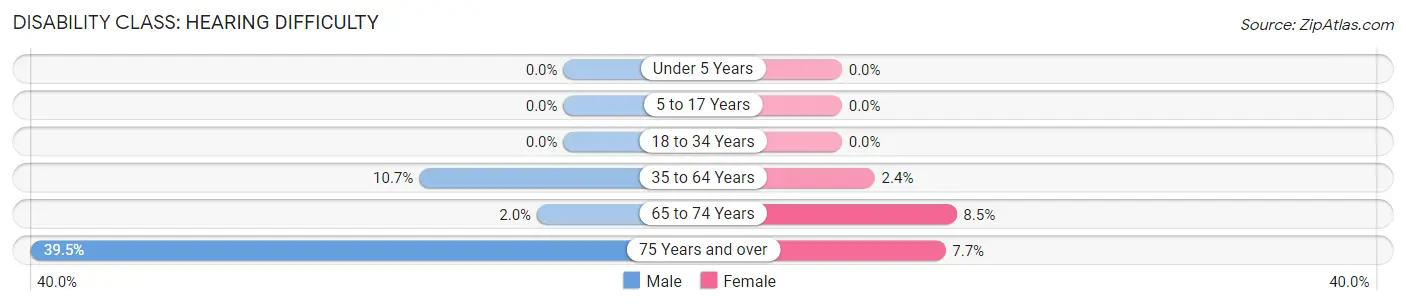
| Age Bracket | Male | Female |
| Under 5 Years | 0 (0.0%) | 0 (0.0%) |
| 5 to 17 Years | 0 (0.0%) | 0 (0.0%) |
| 18 to 34 Years | 0 (0.0%) | 0 (0.0%) |
| 35 to 64 Years | 12 (10.7%) | 3 (2.4%) |
| 65 to 74 Years | 1 (2.0%) | 4 (8.5%) |
| 75 Years and over | 17 (39.5%) | 3 (7.7%) |
Disability Class: Vision Difficulty
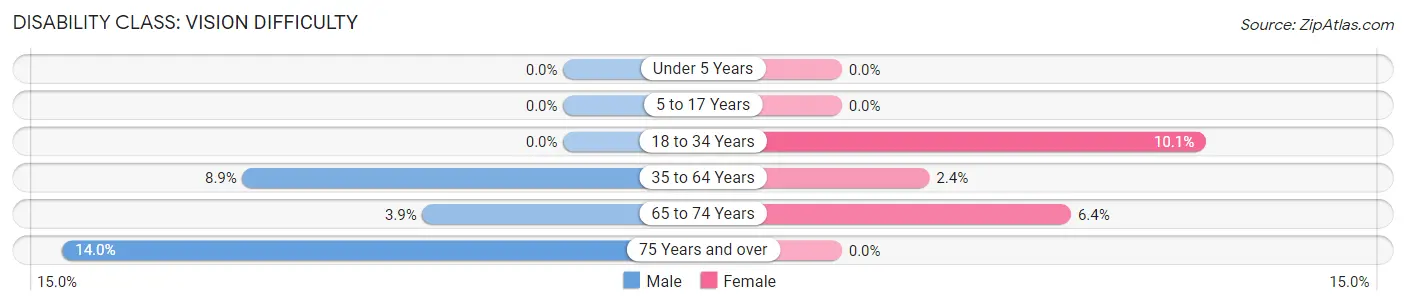
| Age Bracket | Male | Female |
| Under 5 Years | 0 (0.0%) | 0 (0.0%) |
| 5 to 17 Years | 0 (0.0%) | 0 (0.0%) |
| 18 to 34 Years | 0 (0.0%) | 7 (10.1%) |
| 35 to 64 Years | 10 (8.9%) | 3 (2.4%) |
| 65 to 74 Years | 2 (3.9%) | 3 (6.4%) |
| 75 Years and over | 6 (14.0%) | 0 (0.0%) |
Disability Class: Cognitive Difficulty
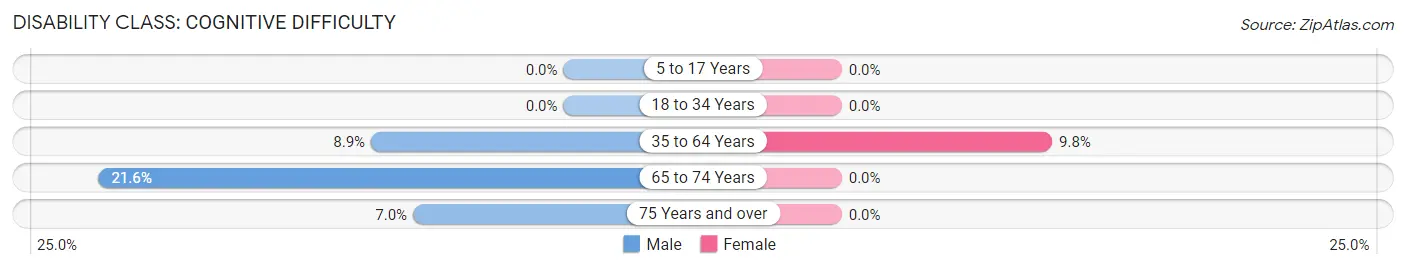
| Age Bracket | Male | Female |
| 5 to 17 Years | 0 (0.0%) | 0 (0.0%) |
| 18 to 34 Years | 0 (0.0%) | 0 (0.0%) |
| 35 to 64 Years | 10 (8.9%) | 12 (9.8%) |
| 65 to 74 Years | 11 (21.6%) | 0 (0.0%) |
| 75 Years and over | 3 (7.0%) | 0 (0.0%) |
Disability Class: Ambulatory Difficulty
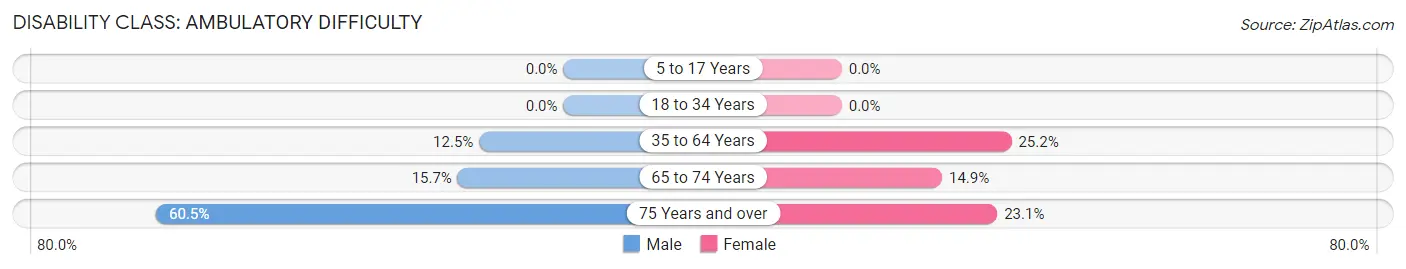
| Age Bracket | Male | Female |
| 5 to 17 Years | 0 (0.0%) | 0 (0.0%) |
| 18 to 34 Years | 0 (0.0%) | 0 (0.0%) |
| 35 to 64 Years | 14 (12.5%) | 31 (25.2%) |
| 65 to 74 Years | 8 (15.7%) | 7 (14.9%) |
| 75 Years and over | 26 (60.5%) | 9 (23.1%) |
Disability Class: Self-Care Difficulty
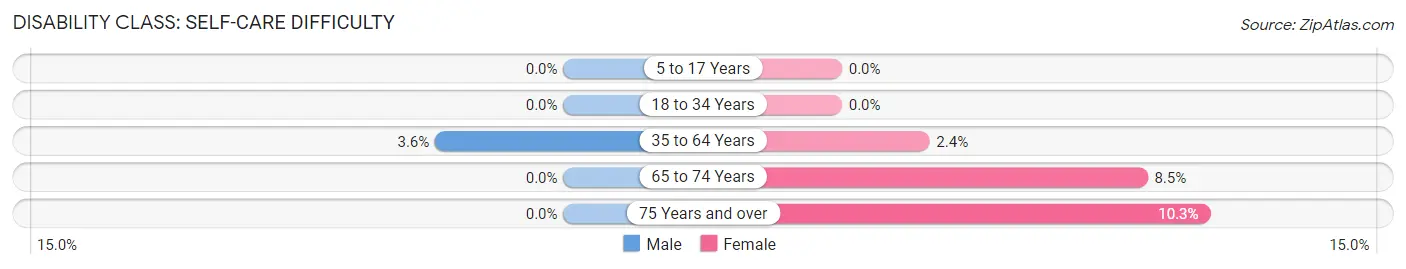
| Age Bracket | Male | Female |
| 5 to 17 Years | 0 (0.0%) | 0 (0.0%) |
| 18 to 34 Years | 0 (0.0%) | 0 (0.0%) |
| 35 to 64 Years | 4 (3.6%) | 3 (2.4%) |
| 65 to 74 Years | 0 (0.0%) | 4 (8.5%) |
| 75 Years and over | 0 (0.0%) | 4 (10.3%) |
Technology Access in Payne Springs
Computing Device Access in Payne Springs
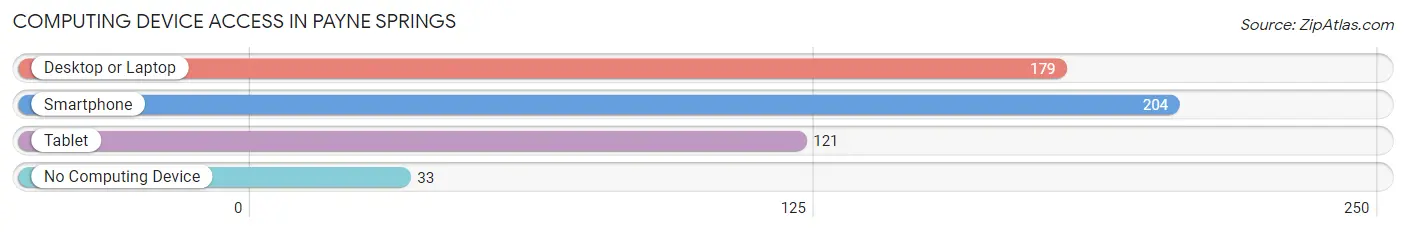
| Device Type | # Households | % Households |
| Desktop or Laptop | 179 | 66.3% |
| Smartphone | 204 | 75.6% |
| Tablet | 121 | 44.8% |
| No Computing Device | 33 | 12.2% |
| Total | 270 | 100.0% |
Internet Access in Payne Springs
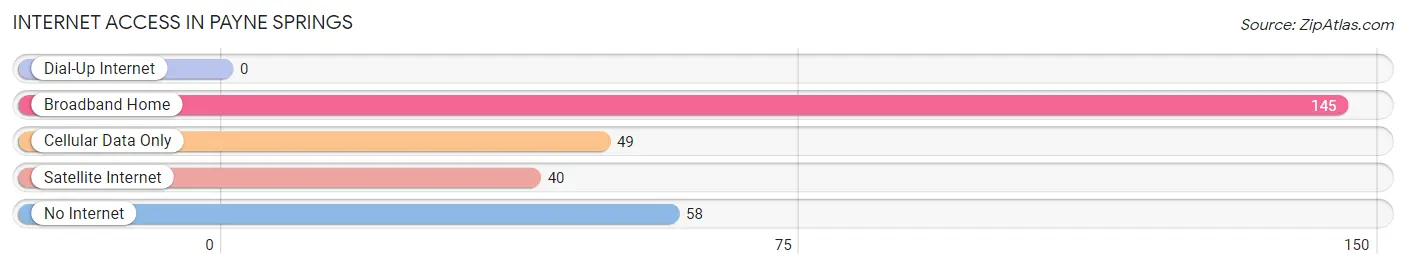
| Internet Type | # Households | % Households |
| Dial-Up Internet | 0 | 0.0% |
| Broadband Home | 145 | 53.7% |
| Cellular Data Only | 49 | 18.1% |
| Satellite Internet | 40 | 14.8% |
| No Internet | 58 | 21.5% |
| Total | 270 | 100.0% |
Payne Springs Summary
Payne Springs is a small town located in Henderson County, Texas, United States. It is situated on the eastern shore of Cedar Creek Lake, about 25 miles southeast of Dallas. The population was 1,093 at the 2010 census.
History
Payne Springs was founded in 1845 by William Payne, a settler from Tennessee. He purchased land from the Republic of Texas and established a cotton plantation. The town was named after him.
In 1872, the Houston and Texas Central Railway was built through the area, connecting Payne Springs to Dallas and other cities. This allowed the town to become a trading center for the surrounding area.
In the early 1900s, Payne Springs was a popular resort destination. It had a hotel, a dance hall, and a casino. The town also had a cotton gin, a blacksmith shop, and a general store.
Geography
Payne Springs is located at 32°51'25" North, 96°17'45" West (32.856944, -96.295833). It is situated on the eastern shore of Cedar Creek Lake, about 25 miles southeast of Dallas.
The town has a total area of 1 2 square miles all of it land
Economy
The economy of Payne Springs is largely based on tourism. The town is a popular destination for fishing, boating, and other outdoor activities. There are several marinas and boat ramps in the area.
The town also has several restaurants bars and other businesses catering to tourists
Demographics
As of the 2010 census, there were 1,093 people, 441 households, and 298 families residing in Payne Springs. The population density was 908.3 people per square mile. The racial makeup of the town was 94.2% White, 0.7% African American, 0.2% Native American, 0.2% Asian, 0.1% Pacific Islander, 2.7% from other races, and 1.9% from two or more races. Hispanic or Latino of any race were 5.3% of the population.
The median income for a household in Payne Springs was $37,500, and the median income for a family was $45,000. Males had a median income of $31,250 versus $25,000 for females. The per capita income for the town was $17,845. About 8.3% of families and 11.2% of the population were below the poverty line, including 15.2% of those under age 18 and 8.3% of those age 65 or over.
Common Questions
What is the Total Population of Payne Springs?
Total Population of Payne Springs is 613.
What is the Total Male Population of Payne Springs?
Total Male Population of Payne Springs is 296.
What is the Total Female Population of Payne Springs?
Total Female Population of Payne Springs is 317.
What is the Ratio of Males per 100 Females in Payne Springs?
There are 93.38 Males per 100 Females in Payne Springs.
What is the Ratio of Females per 100 Males in Payne Springs?
There are 107.09 Females per 100 Males in Payne Springs.
What is the Median Population Age in Payne Springs?
Median Population Age in Payne Springs is 51.0 Years.
What is the Average Family Size in Payne Springs
Average Family Size in Payne Springs is 2.8 People.
What is the Average Household Size in Payne Springs
Average Household Size in Payne Springs is 2.3 People.
What is Per Capita Income in Payne Springs?
Per Capita income in Payne Springs is $27,781.
What is the Median Family Income in Payne Springs?
Median Family Income in Payne Springs is $53,750.
What is the Median Household income in Payne Springs?
Median Household Income in Payne Springs is $42,500.
What is Income or Wage Gap in Payne Springs?
Income or Wage Gap in Payne Springs is 36.0%.
Women in Payne Springs earn 64.0 cents for every dollar earned by a man.
What is Inequality or Gini Index in Payne Springs?
Inequality or Gini Index in Payne Springs is 0.44.
How Large is the Labor Force in Payne Springs?
There are 228 People in the Labor Forcein in Payne Springs.
What is the Percentage of People in the Labor Force in Payne Springs?
42.9% of People are in the Labor Force in Payne Springs.
What is the Unemployment Rate in Payne Springs?
Unemployment Rate in Payne Springs is 1.3%.