Sherwood Shores, TX
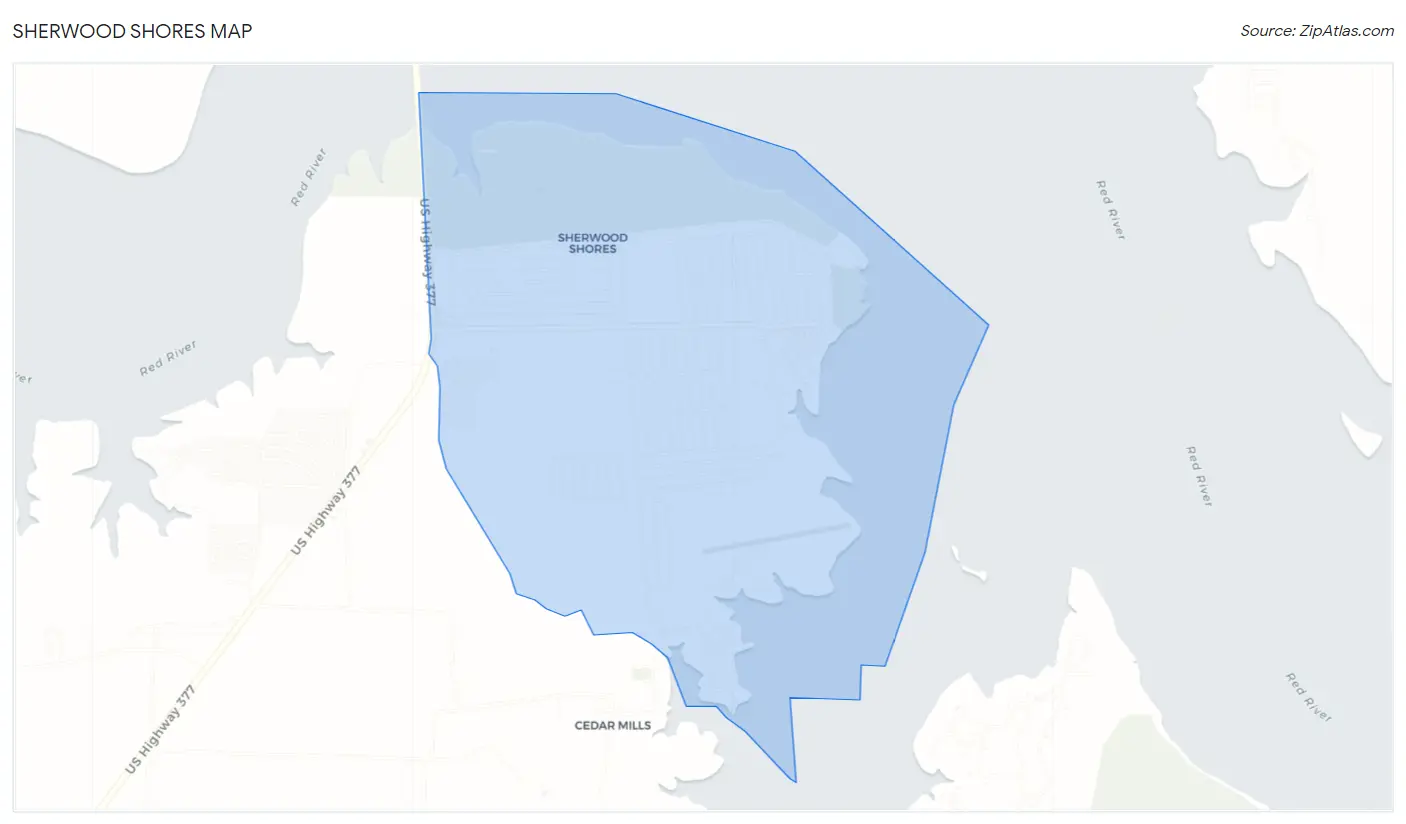
Sherwood Shores Map
Sherwood Shores Overview
880
TOTAL POPULATION
487
MALE POPULATION
393
FEMALE POPULATION
123.92
MALES / 100 FEMALES
80.70
FEMALES / 100 MALES
61.7
MEDIAN AGE
2.4
AVG FAMILY SIZE
1.8
AVG HOUSEHOLD SIZE
$37,232
PER CAPITA INCOME
$65,938
AVG FAMILY INCOME
$31,250
AVG HOUSEHOLD INCOME
12.2%
WAGE / INCOME GAP [ % ]
87.8¢/ $1
WAGE / INCOME GAP [ $ ]
0.55
INEQUALITY / GINI INDEX
376
LABOR FORCE [ PEOPLE ]
45.6%
PERCENT IN LABOR FORCE
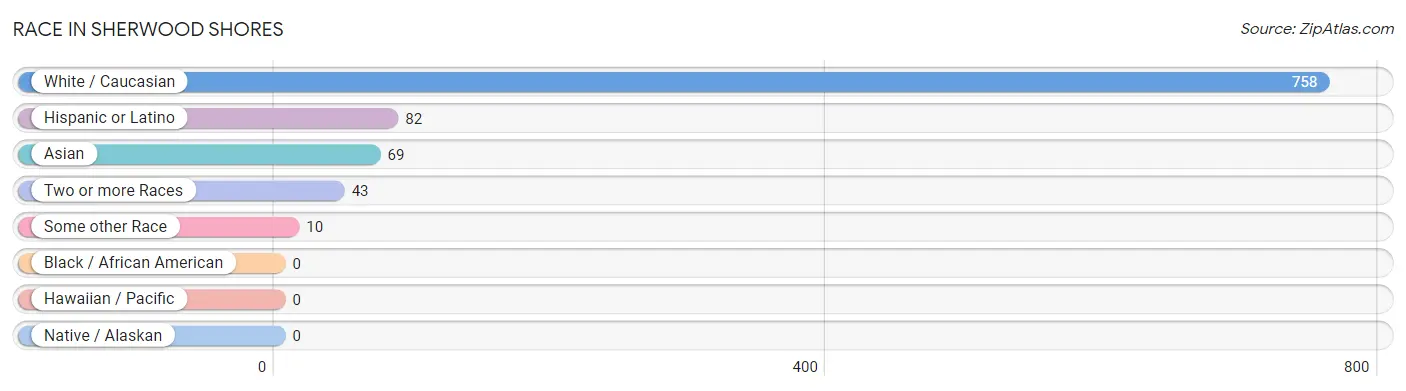
Race in Sherwood Shores
The most populous races in Sherwood Shores are White / Caucasian (758 | 86.1%), Hispanic or Latino (82 | 9.3%), and Asian (69 | 7.8%).
| Race | # Population | % Population |
| Asian | 69 | 7.8% |
| Black / African American | 0 | 0.0% |
| Hawaiian / Pacific | 0 | 0.0% |
| Hispanic or Latino | 82 | 9.3% |
| Native / Alaskan | 0 | 0.0% |
| White / Caucasian | 758 | 86.1% |
| Two or more Races | 43 | 4.9% |
| Some other Race | 10 | 1.1% |
| Total | 880 | 100.0% |
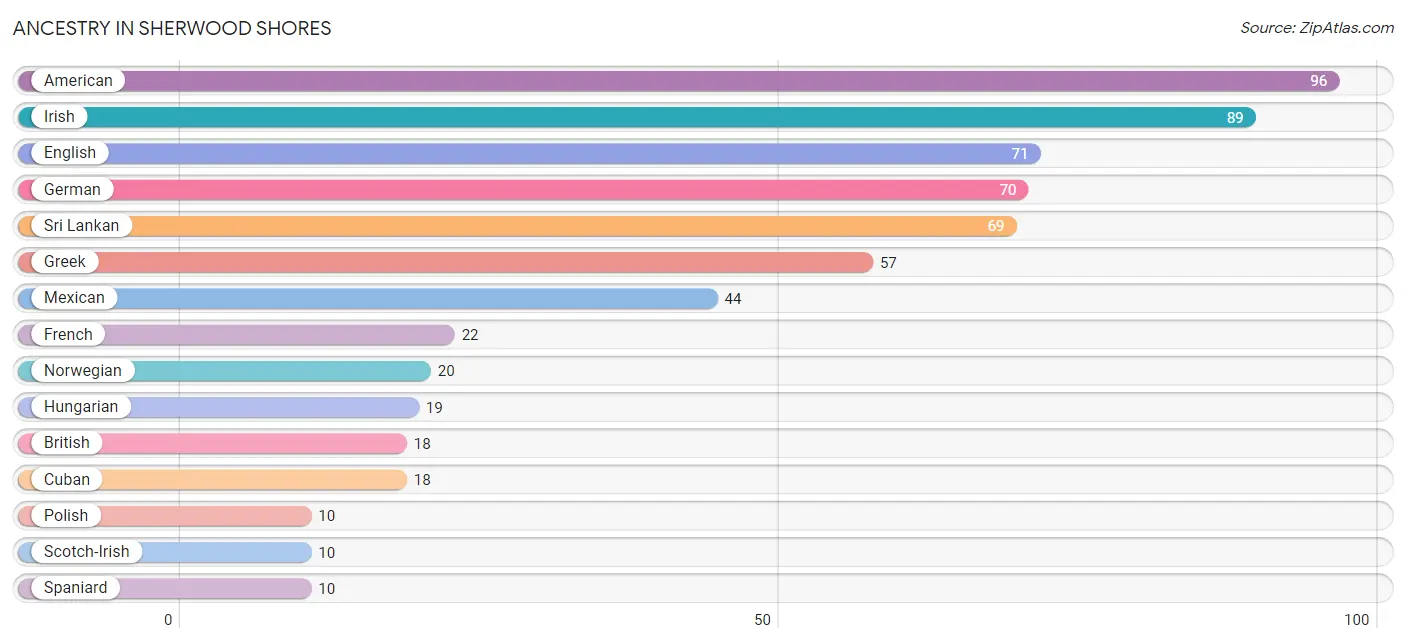
Ancestry in Sherwood Shores
The most populous ancestries reported in Sherwood Shores are American (96 | 10.9%), Irish (89 | 10.1%), English (71 | 8.1%), German (70 | 8.0%), and Sri Lankan (69 | 7.8%), together accounting for 44.9% of all Sherwood Shores residents.
| Ancestry | # Population | % Population |
| American | 96 | 10.9% |
| British | 18 | 2.1% |
| Cuban | 18 | 2.1% |
| English | 71 | 8.1% |
| European | 9 | 1.0% |
| French | 22 | 2.5% |
| German | 70 | 8.0% |
| Greek | 57 | 6.5% |
| Hungarian | 19 | 2.2% |
| Indian (Asian) | 9 | 1.0% |
| Irish | 89 | 10.1% |
| Mexican | 44 | 5.0% |
| Norwegian | 20 | 2.3% |
| Polish | 10 | 1.1% |
| Scotch-Irish | 10 | 1.1% |
| Scottish | 9 | 1.0% |
| Spaniard | 10 | 1.1% |
| Spanish | 10 | 1.1% |
| Sri Lankan | 69 | 7.8% |
| Swedish | 10 | 1.1% |
| Welsh | 9 | 1.0% | View All 21 Rows |
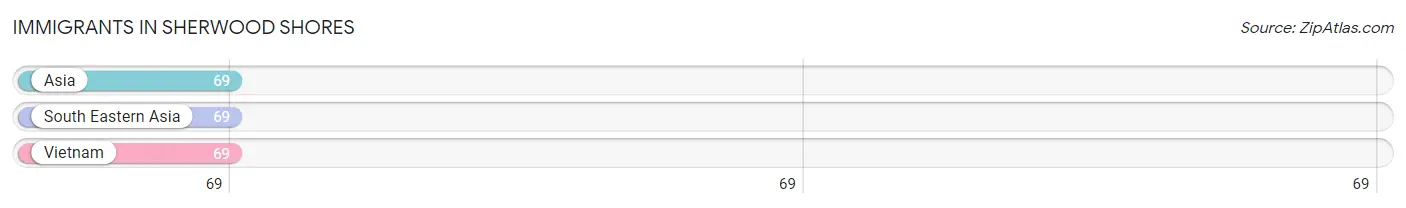
Immigrants in Sherwood Shores
The most numerous immigrant groups reported in Sherwood Shores came from Asia (69 | 7.8%), South Eastern Asia (69 | 7.8%), and Vietnam (69 | 7.8%), together accounting for 23.5% of all Sherwood Shores residents.
| Immigration Origin | # Population | % Population |
| Asia | 69 | 7.8% |
| South Eastern Asia | 69 | 7.8% |
| Vietnam | 69 | 7.8% | View All 3 Rows |
Sex and Age in Sherwood Shores
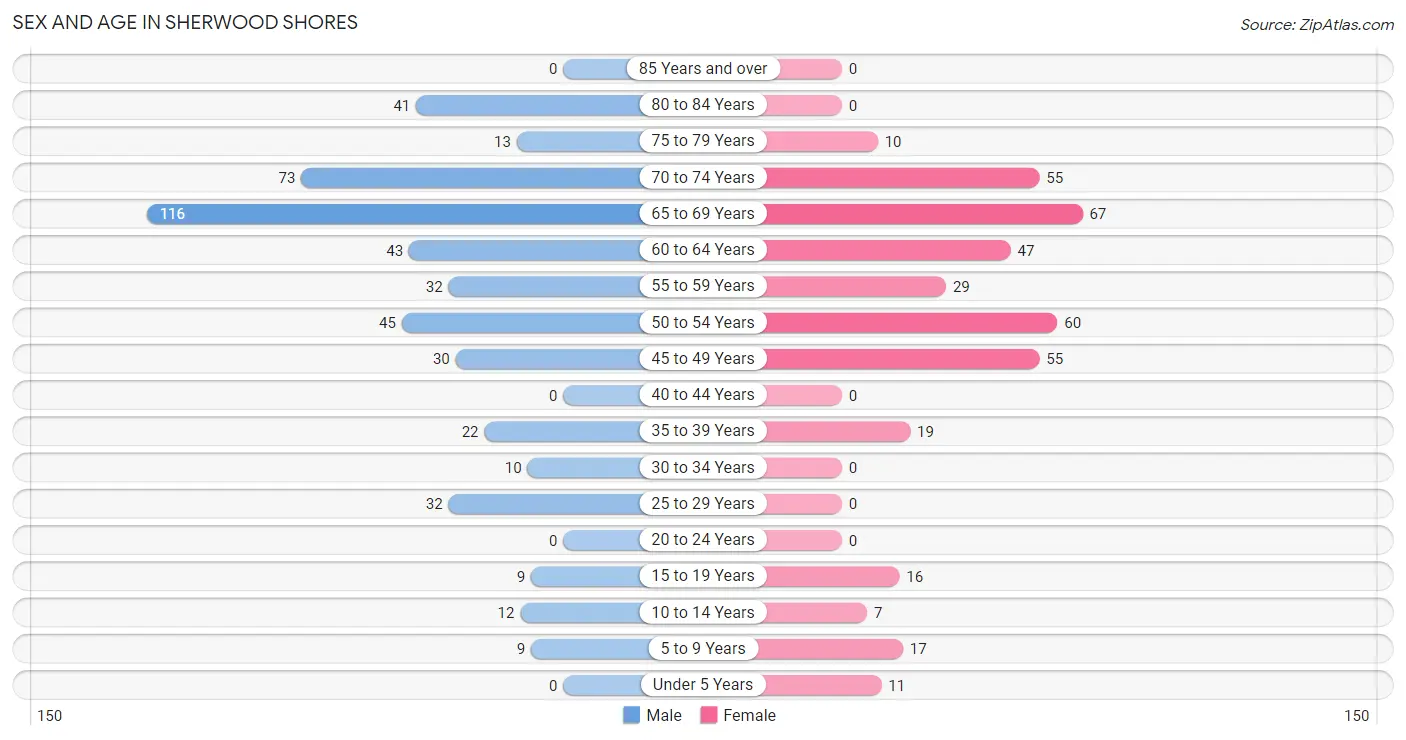
Sex and Age in Sherwood Shores
The most populous age groups in Sherwood Shores are 65 to 69 Years (116 | 23.8%) for men and 65 to 69 Years (67 | 17.1%) for women.
| Age Bracket | Male | Female |
| Under 5 Years | 0 (0.0%) | 11 (2.8%) |
| 5 to 9 Years | 9 (1.8%) | 17 (4.3%) |
| 10 to 14 Years | 12 (2.5%) | 7 (1.8%) |
| 15 to 19 Years | 9 (1.8%) | 16 (4.1%) |
| 20 to 24 Years | 0 (0.0%) | 0 (0.0%) |
| 25 to 29 Years | 32 (6.6%) | 0 (0.0%) |
| 30 to 34 Years | 10 (2.1%) | 0 (0.0%) |
| 35 to 39 Years | 22 (4.5%) | 19 (4.8%) |
| 40 to 44 Years | 0 (0.0%) | 0 (0.0%) |
| 45 to 49 Years | 30 (6.2%) | 55 (14.0%) |
| 50 to 54 Years | 45 (9.2%) | 60 (15.3%) |
| 55 to 59 Years | 32 (6.6%) | 29 (7.4%) |
| 60 to 64 Years | 43 (8.8%) | 47 (12.0%) |
| 65 to 69 Years | 116 (23.8%) | 67 (17.1%) |
| 70 to 74 Years | 73 (15.0%) | 55 (14.0%) |
| 75 to 79 Years | 13 (2.7%) | 10 (2.5%) |
| 80 to 84 Years | 41 (8.4%) | 0 (0.0%) |
| 85 Years and over | 0 (0.0%) | 0 (0.0%) |
| Total | 487 (100.0%) | 393 (100.0%) |
Families and Households in Sherwood Shores
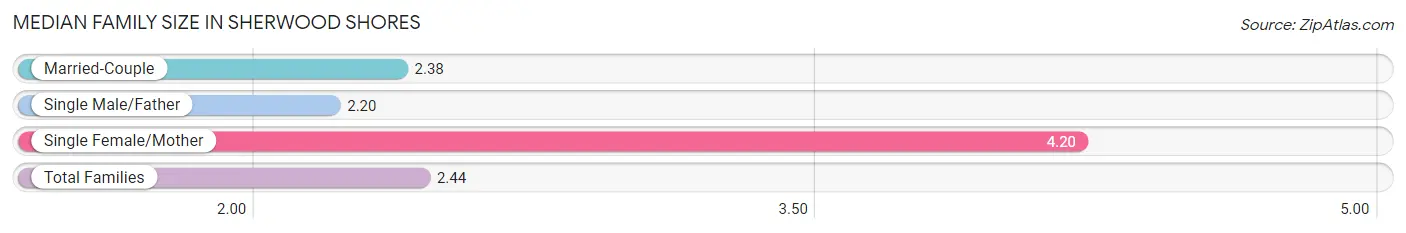
Median Family Size in Sherwood Shores
The median family size in Sherwood Shores is 2.44 persons per family, with single female/mother families (10 | 4.0%) accounting for the largest median family size of 4.2 persons per family. On the other hand, single male/father families (20 | 8.0%) represent the smallest median family size with 2.20 persons per family.
| Family Type | # Families | Family Size |
| Married-Couple | 219 (87.9%) | 2.38 |
| Single Male/Father | 20 (8.0%) | 2.20 |
| Single Female/Mother | 10 (4.0%) | 4.20 |
| Total Families | 249 (100.0%) | 2.44 |
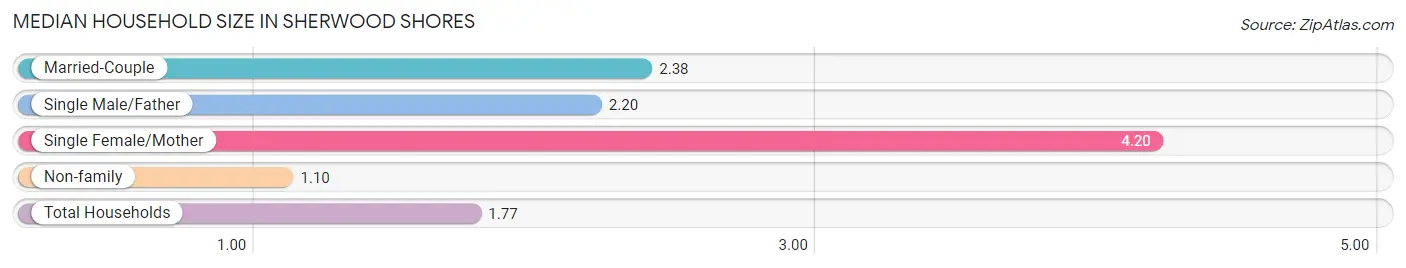
Median Household Size in Sherwood Shores
The median household size in Sherwood Shores is 1.77 persons per household, with single female/mother households (10 | 2.0%) accounting for the largest median household size of 4.2 persons per household. non-family households (248 | 49.9%) represent the smallest median household size with 1.10 persons per household.
| Household Type | # Households | Household Size |
| Married-Couple | 219 (44.1%) | 2.38 |
| Single Male/Father | 20 (4.0%) | 2.20 |
| Single Female/Mother | 10 (2.0%) | 4.20 |
| Non-family | 248 (49.9%) | 1.10 |
| Total Households | 497 (100.0%) | 1.77 |
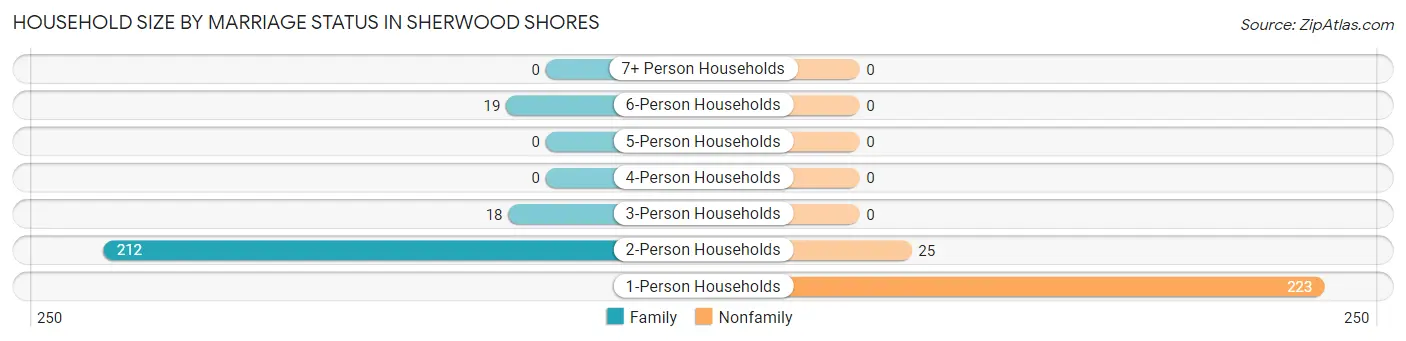
Household Size by Marriage Status in Sherwood Shores
Out of a total of 497 households in Sherwood Shores, 249 (50.1%) are family households, while 248 (49.9%) are nonfamily households. The most numerous type of family households are 2-person households, comprising 212, and the most common type of nonfamily households are 1-person households, comprising 223.
| Household Size | Family Households | Nonfamily Households |
| 1-Person Households | - | 223 (44.9%) |
| 2-Person Households | 212 (42.7%) | 25 (5.0%) |
| 3-Person Households | 18 (3.6%) | 0 (0.0%) |
| 4-Person Households | 0 (0.0%) | 0 (0.0%) |
| 5-Person Households | 0 (0.0%) | 0 (0.0%) |
| 6-Person Households | 19 (3.8%) | 0 (0.0%) |
| 7+ Person Households | 0 (0.0%) | 0 (0.0%) |
| Total | 249 (50.1%) | 248 (49.9%) |
Female Fertility in Sherwood Shores
Fertility by Age in Sherwood Shores
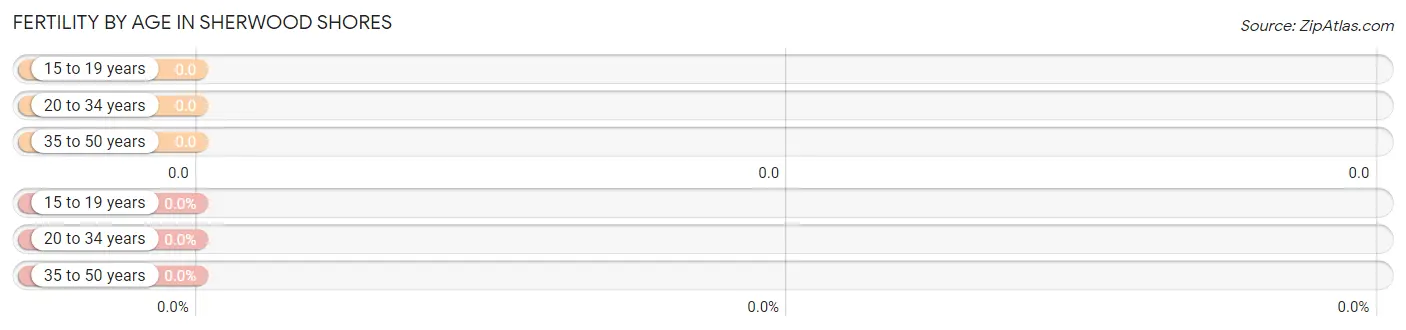
| Age Bracket | Women with Births | Births / 1,000 Women |
| 15 to 19 years | 0 (0.0%) | 0.0 |
| 20 to 34 years | 0 (0.0%) | 0.0 |
| 35 to 50 years | 0 (0.0%) | 0.0 |
| Total | 0 (0.0%) | 0.0 |
Fertility by Age by Marriage Status in Sherwood Shores
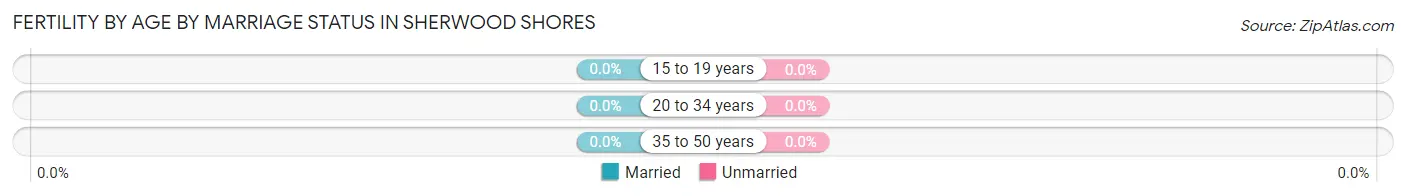
| Age Bracket | Married | Unmarried |
| 15 to 19 years | 0 (0.0%) | 0 (0.0%) |
| 20 to 34 years | 0 (0.0%) | 0 (0.0%) |
| 35 to 50 years | 0 (0.0%) | 0 (0.0%) |
| Total | 0 (0.0%) | 0 (0.0%) |
Fertility by Education in Sherwood Shores
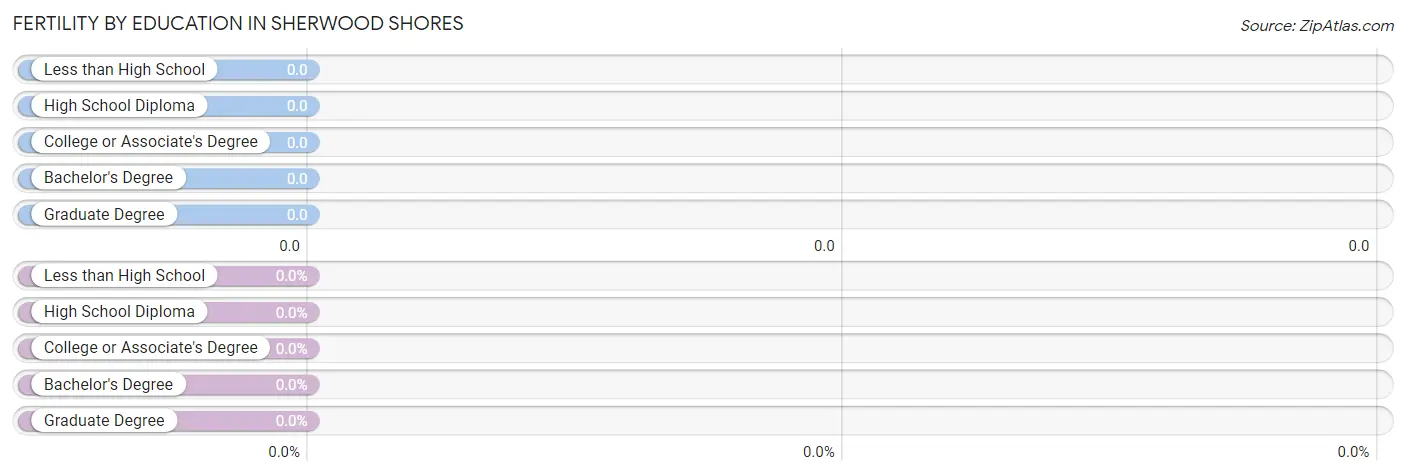
| Educational Attainment | Women with Births | Births / 1,000 Women |
| Less than High School | 0 (0.0%) | 0.0 |
| High School Diploma | 0 (0.0%) | 0.0 |
| College or Associate's Degree | 0 (0.0%) | 0.0 |
| Bachelor's Degree | 0 (0.0%) | 0.0 |
| Graduate Degree | 0 (0.0%) | 0.0 |
| Total | 0 (0.0%) | 0.0 |
Fertility by Education by Marriage Status in Sherwood Shores
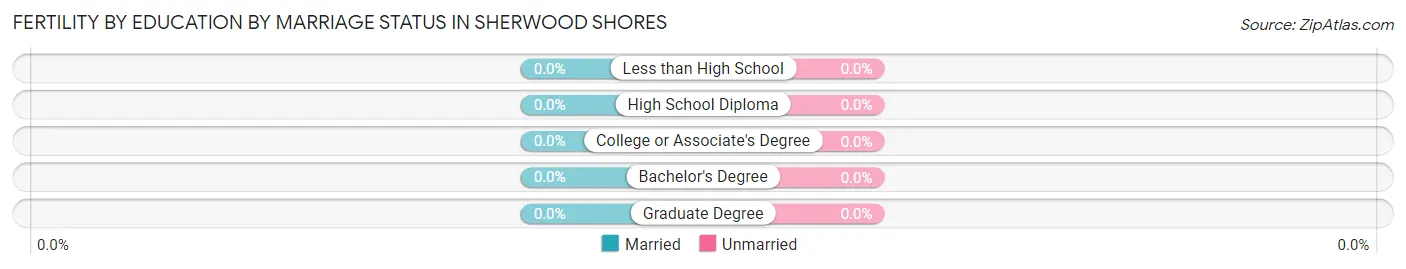
| Educational Attainment | Married | Unmarried |
| Less than High School | 0 (0.0%) | 0 (0.0%) |
| High School Diploma | 0 (0.0%) | 0 (0.0%) |
| College or Associate's Degree | 0 (0.0%) | 0 (0.0%) |
| Bachelor's Degree | 0 (0.0%) | 0 (0.0%) |
| Graduate Degree | 0 (0.0%) | 0 (0.0%) |
| Total | 0 (0.0%) | 0 (0.0%) |
Income in Sherwood Shores
Income Overview in Sherwood Shores
Per Capita Income in Sherwood Shores is $37,232, while median incomes of families and households are $65,938 and $31,250 respectively.
| Characteristic | Number | Measure |
| Per Capita Income | 880 | $37,232 |
| Median Family Income | 249 | $65,938 |
| Mean Family Income | 249 | $83,459 |
| Median Household Income | 497 | $31,250 |
| Mean Household Income | 497 | $63,377 |
| Income Deficit | 249 | $0 |
| Wage / Income Gap (%) | 880 | 12.18% |
| Wage / Income Gap ($) | 880 | 87.82¢ per $1 |
| Gini / Inequality Index | 880 | 0.55 |
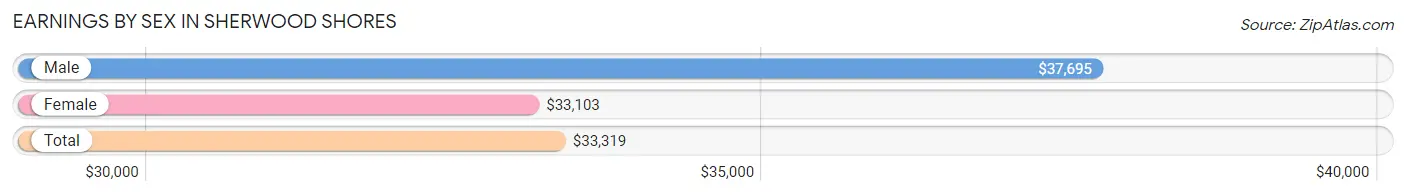
Earnings by Sex in Sherwood Shores
Average Earnings in Sherwood Shores are $33,319, $37,695 for men and $33,103 for women, a difference of 12.2%.
| Sex | Number | Average Earnings |
| Male | 205 (50.6%) | $37,695 |
| Female | 200 (49.4%) | $33,103 |
| Total | 405 (100.0%) | $33,319 |
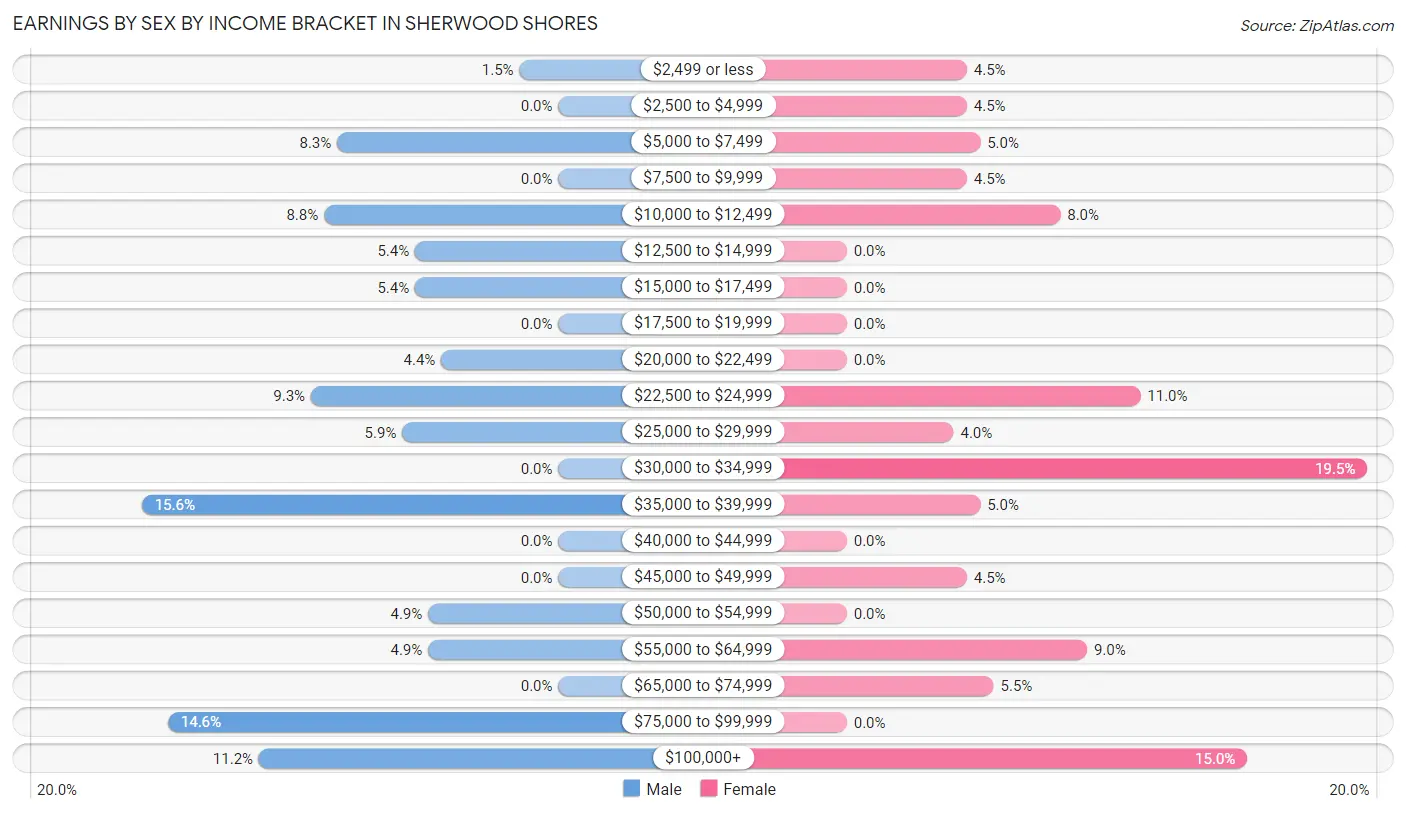
Earnings by Sex by Income Bracket in Sherwood Shores
The most common earnings brackets in Sherwood Shores are $35,000 to $39,999 for men (32 | 15.6%) and $30,000 to $34,999 for women (39 | 19.5%).
| Income | Male | Female |
| $2,499 or less | 3 (1.5%) | 9 (4.5%) |
| $2,500 to $4,999 | 0 (0.0%) | 9 (4.5%) |
| $5,000 to $7,499 | 17 (8.3%) | 10 (5.0%) |
| $7,500 to $9,999 | 0 (0.0%) | 9 (4.5%) |
| $10,000 to $12,499 | 18 (8.8%) | 16 (8.0%) |
| $12,500 to $14,999 | 11 (5.4%) | 0 (0.0%) |
| $15,000 to $17,499 | 11 (5.4%) | 0 (0.0%) |
| $17,500 to $19,999 | 0 (0.0%) | 0 (0.0%) |
| $20,000 to $22,499 | 9 (4.4%) | 0 (0.0%) |
| $22,500 to $24,999 | 19 (9.3%) | 22 (11.0%) |
| $25,000 to $29,999 | 12 (5.9%) | 8 (4.0%) |
| $30,000 to $34,999 | 0 (0.0%) | 39 (19.5%) |
| $35,000 to $39,999 | 32 (15.6%) | 10 (5.0%) |
| $40,000 to $44,999 | 0 (0.0%) | 0 (0.0%) |
| $45,000 to $49,999 | 0 (0.0%) | 9 (4.5%) |
| $50,000 to $54,999 | 10 (4.9%) | 0 (0.0%) |
| $55,000 to $64,999 | 10 (4.9%) | 18 (9.0%) |
| $65,000 to $74,999 | 0 (0.0%) | 11 (5.5%) |
| $75,000 to $99,999 | 30 (14.6%) | 0 (0.0%) |
| $100,000+ | 23 (11.2%) | 30 (15.0%) |
| Total | 205 (100.0%) | 200 (100.0%) |
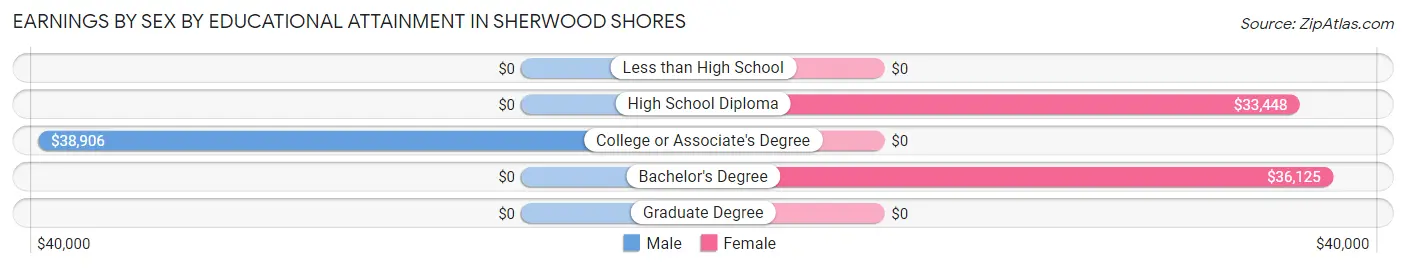
Earnings by Sex by Educational Attainment in Sherwood Shores
Average earnings in Sherwood Shores are $38,047 for men and $33,793 for women, a difference of 11.2%. Men with an educational attainment of college or associate's degree enjoy the highest average annual earnings of $38,906, while those with college or associate's degree education earn the least with $38,906. Women with an educational attainment of bachelor's degree earn the most with the average annual earnings of $36,125, while those with high school diploma education have the smallest earnings of $33,448.
| Educational Attainment | Male Income | Female Income |
| Less than High School | - | - |
| High School Diploma | - | - |
| College or Associate's Degree | $38,906 | $0 |
| Bachelor's Degree | - | - |
| Graduate Degree | - | - |
| Total | $38,047 | $33,793 |
Family Income in Sherwood Shores
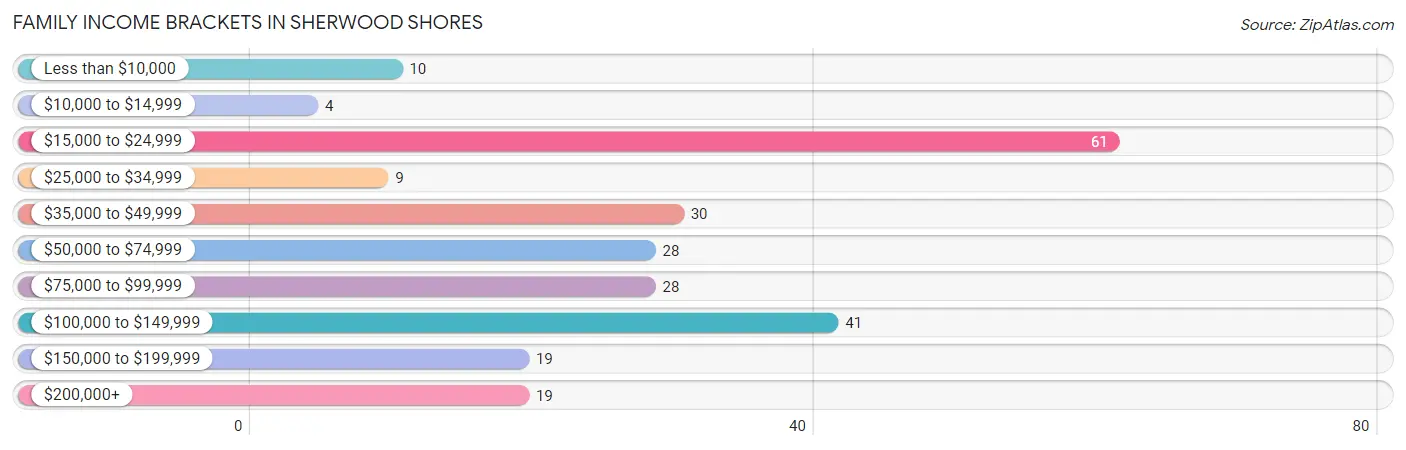
Family Income Brackets in Sherwood Shores
According to the Sherwood Shores family income data, there are 61 families falling into the $15,000 to $24,999 income range, which is the most common income bracket and makes up 24.5% of all families. Conversely, the $10,000 to $14,999 income bracket is the least frequent group with only 4 families (1.6%) belonging to this category.
| Income Bracket | # Families | % Families |
| Less than $10,000 | 10 | 4.0% |
| $10,000 to $14,999 | 4 | 1.6% |
| $15,000 to $24,999 | 61 | 24.5% |
| $25,000 to $34,999 | 9 | 3.6% |
| $35,000 to $49,999 | 30 | 12.0% |
| $50,000 to $74,999 | 28 | 11.2% |
| $75,000 to $99,999 | 28 | 11.2% |
| $100,000 to $149,999 | 41 | 16.5% |
| $150,000 to $199,999 | 19 | 7.6% |
| $200,000+ | 19 | 7.6% |
Family Income by Famaliy Size in Sherwood Shores
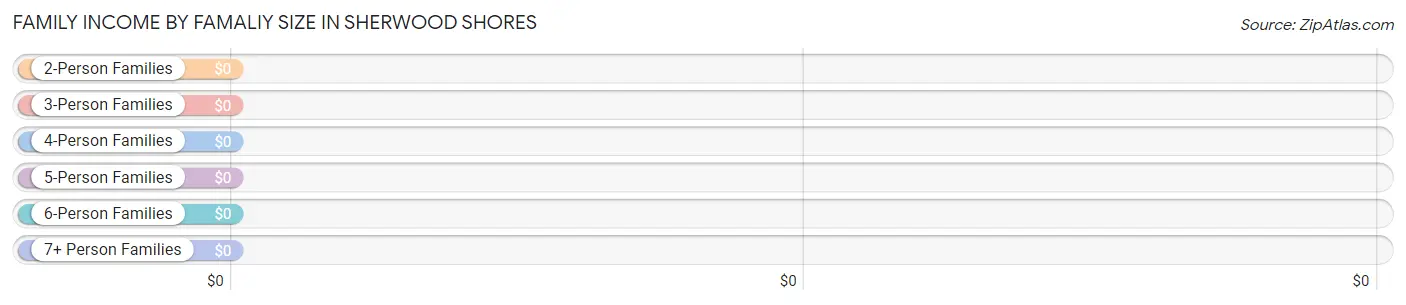
| Income Bracket | # Families | Median Income |
| 2-Person Families | 212 (85.1%) | $0 |
| 3-Person Families | 18 (7.2%) | $0 |
| 4-Person Families | 0 (0.0%) | $0 |
| 5-Person Families | 0 (0.0%) | $0 |
| 6-Person Families | 19 (7.6%) | $0 |
| 7+ Person Families | 0 (0.0%) | $0 |
| Total | 249 (100.0%) | $65,938 |
Family Income by Number of Earners in Sherwood Shores
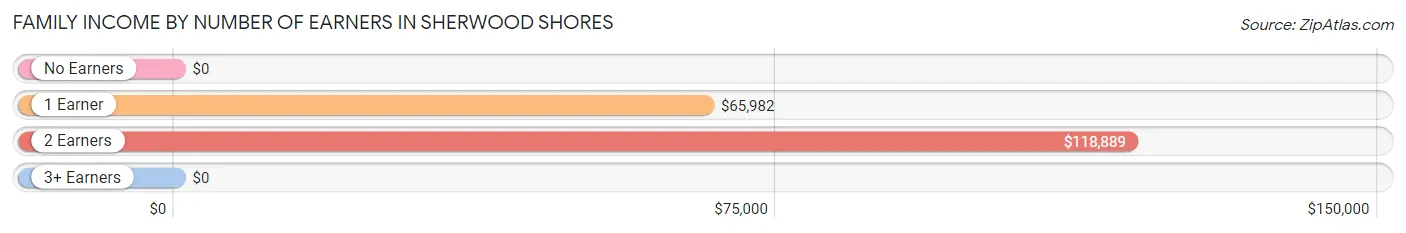
| Number of Earners | # Families | Median Income |
| No Earners | 73 (29.3%) | $0 |
| 1 Earner | 106 (42.6%) | $65,982 |
| 2 Earners | 50 (20.1%) | $118,889 |
| 3+ Earners | 20 (8.0%) | $0 |
| Total | 249 (100.0%) | $65,938 |
Household Income in Sherwood Shores
Household Income Brackets in Sherwood Shores
With 177 households falling in the category, the $15,000 to $24,999 income range is the most frequent in Sherwood Shores, accounting for 35.6% of all households. In contrast, only 13 households (2.6%) fall into the $10,000 to $14,999 income bracket, making it the least populous group.
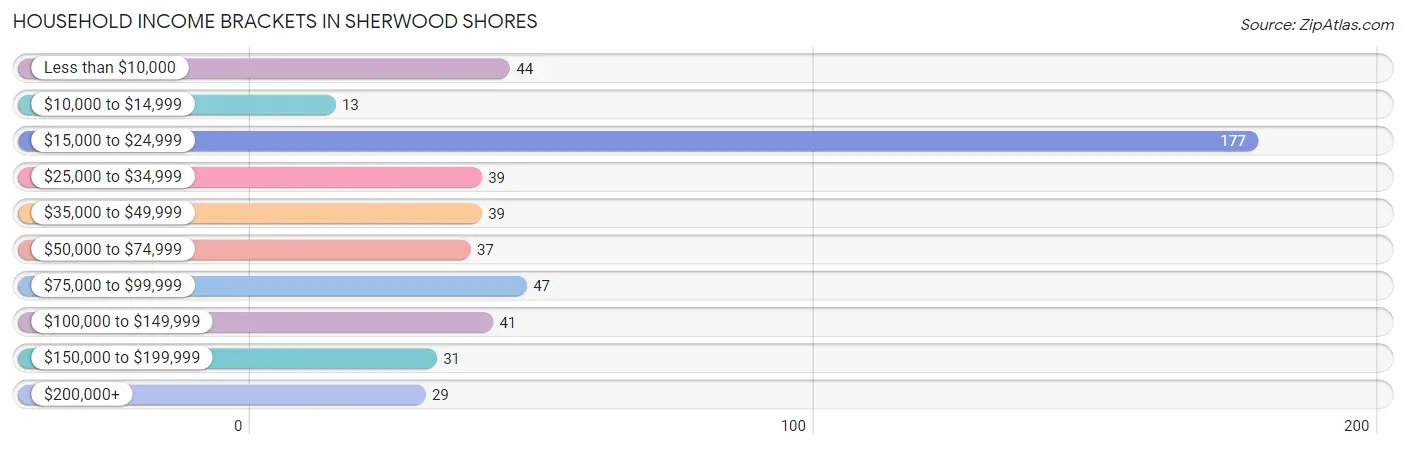
| Income Bracket | # Households | % Households |
| Less than $10,000 | 44 | 8.9% |
| $10,000 to $14,999 | 13 | 2.6% |
| $15,000 to $24,999 | 177 | 35.6% |
| $25,000 to $34,999 | 39 | 7.8% |
| $35,000 to $49,999 | 39 | 7.8% |
| $50,000 to $74,999 | 37 | 7.4% |
| $75,000 to $99,999 | 47 | 9.5% |
| $100,000 to $149,999 | 41 | 8.2% |
| $150,000 to $199,999 | 31 | 6.2% |
| $200,000+ | 29 | 5.8% |
Household Income by Householder Age in Sherwood Shores
The median household income in Sherwood Shores is $31,250, with the highest median household income of $101,125 found in the 25 to 44 years age bracket for the primary householder. A total of 29 households (5.8%) fall into this category.
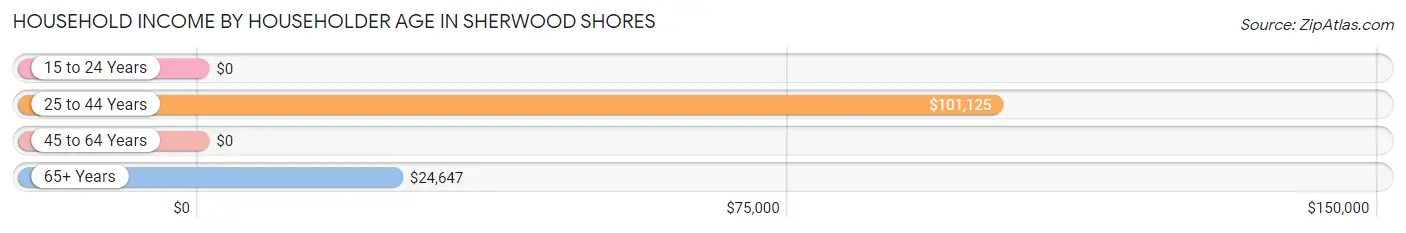
| Income Bracket | # Households | Median Income |
| 15 to 24 Years | 0 (0.0%) | $0 |
| 25 to 44 Years | 29 (5.8%) | $101,125 |
| 45 to 64 Years | 167 (33.6%) | $0 |
| 65+ Years | 301 (60.6%) | $24,647 |
| Total | 497 (100.0%) | $31,250 |
Poverty in Sherwood Shores
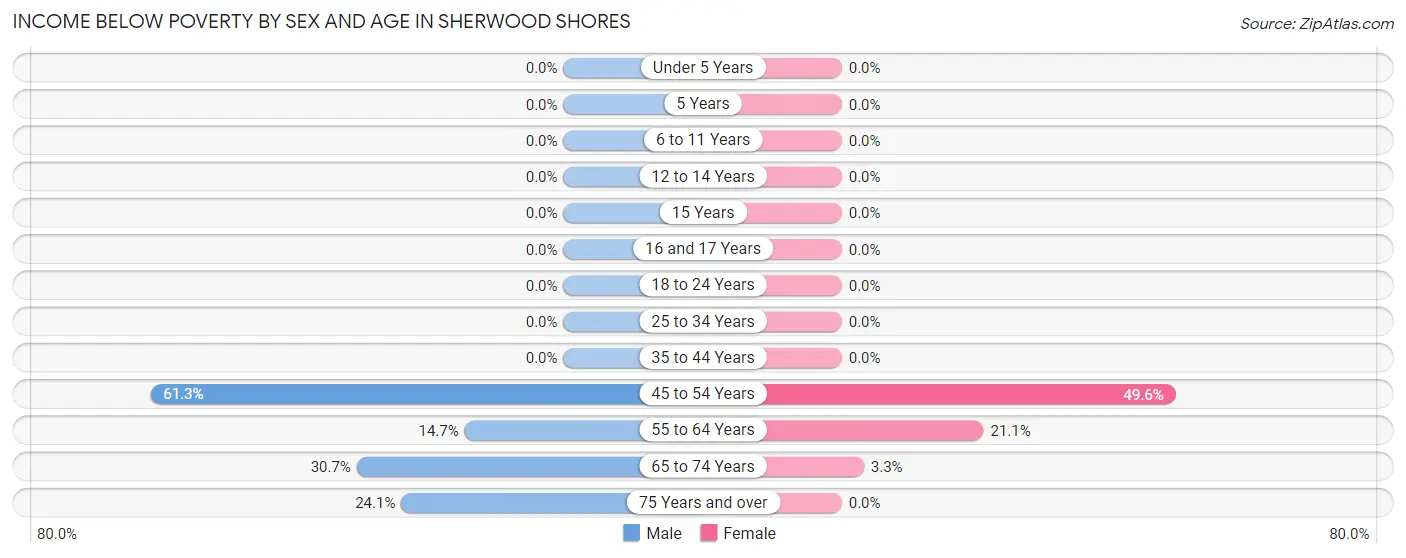
Income Below Poverty by Sex and Age in Sherwood Shores
With 26.3% poverty level for males and 19.6% for females among the residents of Sherwood Shores, 45 to 54 year old males and 45 to 54 year old females are the most vulnerable to poverty, with 46 males (61.3%) and 57 females (49.6%) in their respective age groups living below the poverty level.
| Age Bracket | Male | Female |
| Under 5 Years | 0 (0.0%) | 0 (0.0%) |
| 5 Years | 0 (0.0%) | 0 (0.0%) |
| 6 to 11 Years | 0 (0.0%) | 0 (0.0%) |
| 12 to 14 Years | 0 (0.0%) | 0 (0.0%) |
| 15 Years | 0 (0.0%) | 0 (0.0%) |
| 16 and 17 Years | 0 (0.0%) | 0 (0.0%) |
| 18 to 24 Years | 0 (0.0%) | 0 (0.0%) |
| 25 to 34 Years | 0 (0.0%) | 0 (0.0%) |
| 35 to 44 Years | 0 (0.0%) | 0 (0.0%) |
| 45 to 54 Years | 46 (61.3%) | 57 (49.6%) |
| 55 to 64 Years | 11 (14.7%) | 16 (21.0%) |
| 65 to 74 Years | 58 (30.7%) | 4 (3.3%) |
| 75 Years and over | 13 (24.1%) | 0 (0.0%) |
| Total | 128 (26.3%) | 77 (19.6%) |
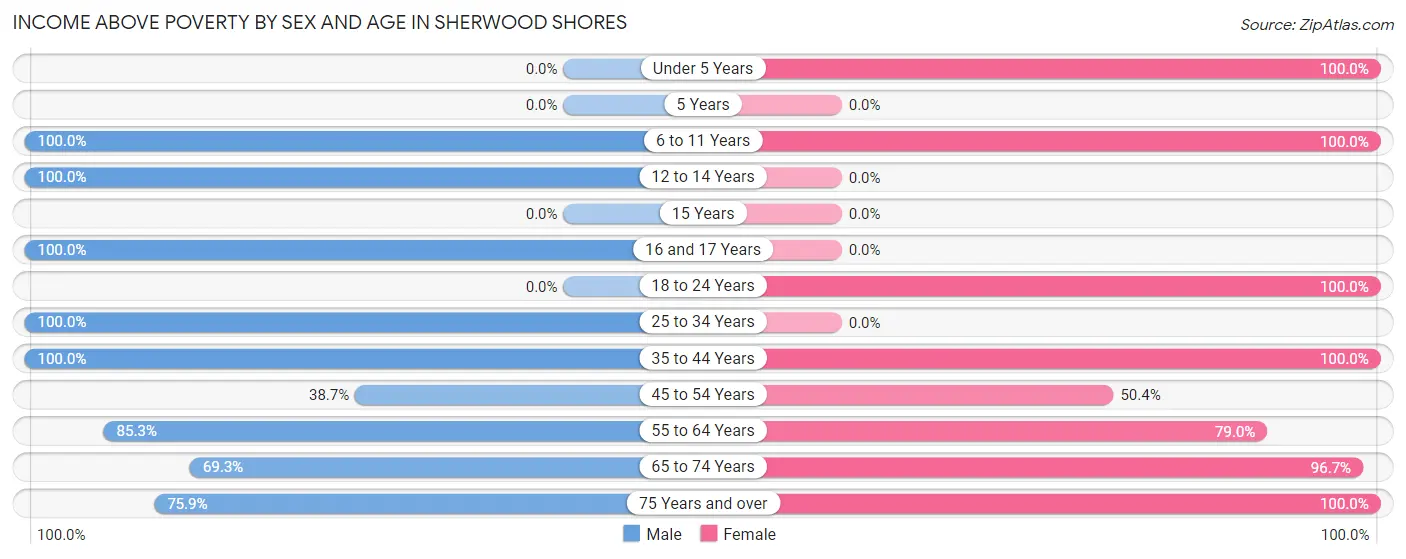
Income Above Poverty by Sex and Age in Sherwood Shores
According to the poverty statistics in Sherwood Shores, males aged 6 to 11 years and females aged under 5 years are the age groups that are most secure financially, with 100.0% of males and 100.0% of females in these age groups living above the poverty line.
| Age Bracket | Male | Female |
| Under 5 Years | 0 (0.0%) | 11 (100.0%) |
| 5 Years | 0 (0.0%) | 0 (0.0%) |
| 6 to 11 Years | 9 (100.0%) | 24 (100.0%) |
| 12 to 14 Years | 12 (100.0%) | 0 (0.0%) |
| 15 Years | 0 (0.0%) | 0 (0.0%) |
| 16 and 17 Years | 9 (100.0%) | 0 (0.0%) |
| 18 to 24 Years | 0 (0.0%) | 16 (100.0%) |
| 25 to 34 Years | 42 (100.0%) | 0 (0.0%) |
| 35 to 44 Years | 22 (100.0%) | 19 (100.0%) |
| 45 to 54 Years | 29 (38.7%) | 58 (50.4%) |
| 55 to 64 Years | 64 (85.3%) | 60 (78.9%) |
| 65 to 74 Years | 131 (69.3%) | 118 (96.7%) |
| 75 Years and over | 41 (75.9%) | 10 (100.0%) |
| Total | 359 (73.7%) | 316 (80.4%) |
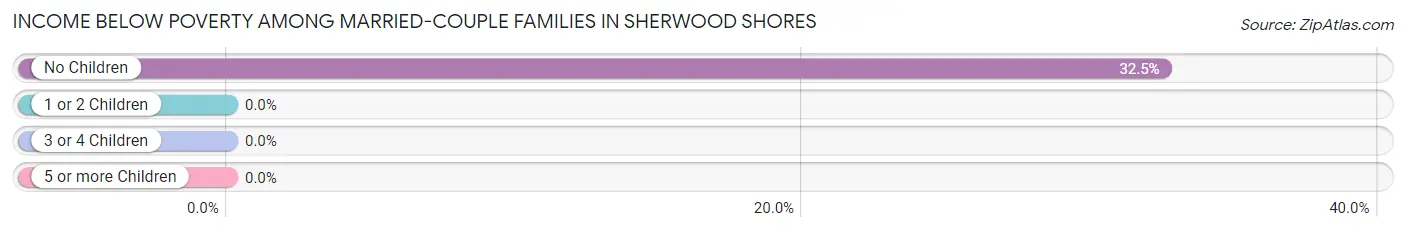
Income Below Poverty Among Married-Couple Families in Sherwood Shores
The poverty statistics for married-couple families in Sherwood Shores show that 29.7% or 65 of the total 219 families live below the poverty line. Families with no children have the highest poverty rate of 32.5%, comprising of 65 families. On the other hand, families with 3 or 4 children have the lowest poverty rate of 0.0%, which includes 0 families.
| Children | Above Poverty | Below Poverty |
| No Children | 135 (67.5%) | 65 (32.5%) |
| 1 or 2 Children | 0 (0.0%) | 0 (0.0%) |
| 3 or 4 Children | 19 (100.0%) | 0 (0.0%) |
| 5 or more Children | 0 (0.0%) | 0 (0.0%) |
| Total | 154 (70.3%) | 65 (29.7%) |
Income Below Poverty Among Single-Parent Households in Sherwood Shores
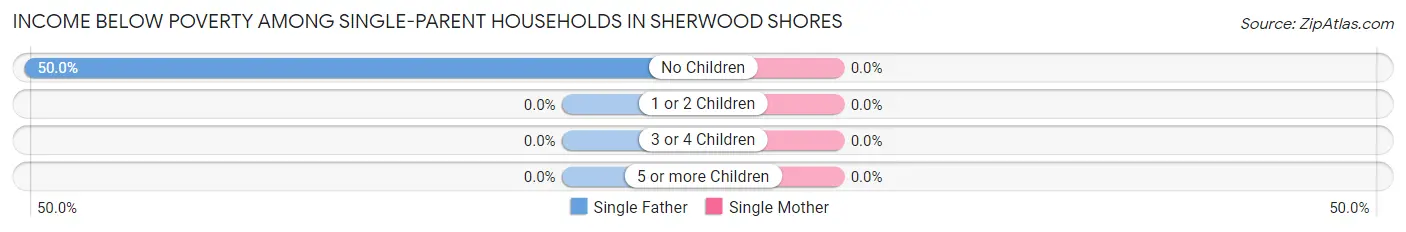
| Children | Single Father | Single Mother |
| No Children | 10 (50.0%) | 0 (0.0%) |
| 1 or 2 Children | 0 (0.0%) | 0 (0.0%) |
| 3 or 4 Children | 0 (0.0%) | 0 (0.0%) |
| 5 or more Children | 0 (0.0%) | 0 (0.0%) |
| Total | 10 (50.0%) | 0 (0.0%) |
Income Below Poverty Among Married-Couple vs Single-Parent Households in Sherwood Shores
The poverty data for Sherwood Shores shows that 65 of the married-couple family households (29.7%) and 10 of the single-parent households (33.3%) are living below the poverty level. Within the married-couple family households, those with no children have the highest poverty rate, with 65 households (32.5%) falling below the poverty line. Among the single-parent households, those with no children have the highest poverty rate, with 10 household (33.3%) living below poverty.
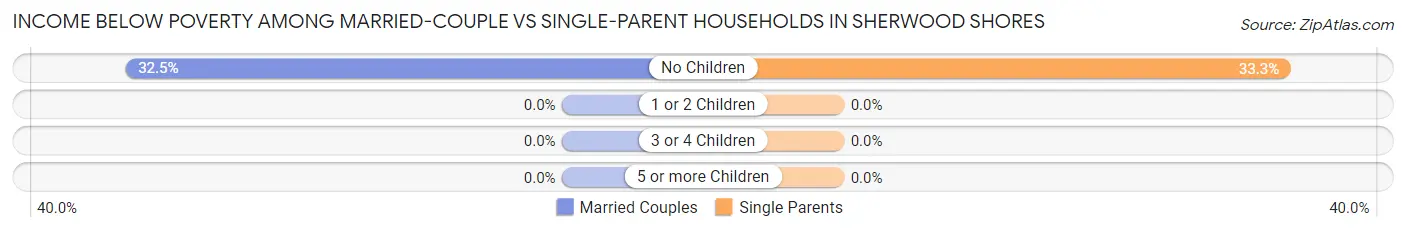
| Children | Married-Couple Families | Single-Parent Households |
| No Children | 65 (32.5%) | 10 (33.3%) |
| 1 or 2 Children | 0 (0.0%) | 0 (0.0%) |
| 3 or 4 Children | 0 (0.0%) | 0 (0.0%) |
| 5 or more Children | 0 (0.0%) | 0 (0.0%) |
| Total | 65 (29.7%) | 10 (33.3%) |
Employment Characteristics in Sherwood Shores
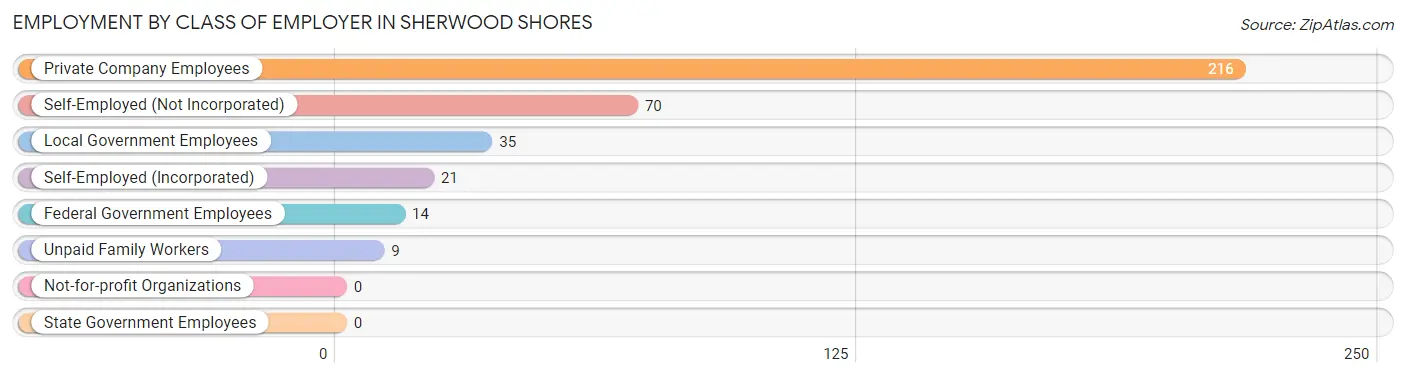
Employment by Class of Employer in Sherwood Shores
Among the 365 employed individuals in Sherwood Shores, private company employees (216 | 59.2%), self-employed (not incorporated) (70 | 19.2%), and local government employees (35 | 9.6%) make up the most common classes of employment.
| Employer Class | # Employees | % Employees |
| Private Company Employees | 216 | 59.2% |
| Self-Employed (Incorporated) | 21 | 5.8% |
| Self-Employed (Not Incorporated) | 70 | 19.2% |
| Not-for-profit Organizations | 0 | 0.0% |
| Local Government Employees | 35 | 9.6% |
| State Government Employees | 0 | 0.0% |
| Federal Government Employees | 14 | 3.8% |
| Unpaid Family Workers | 9 | 2.5% |
| Total | 365 | 100.0% |
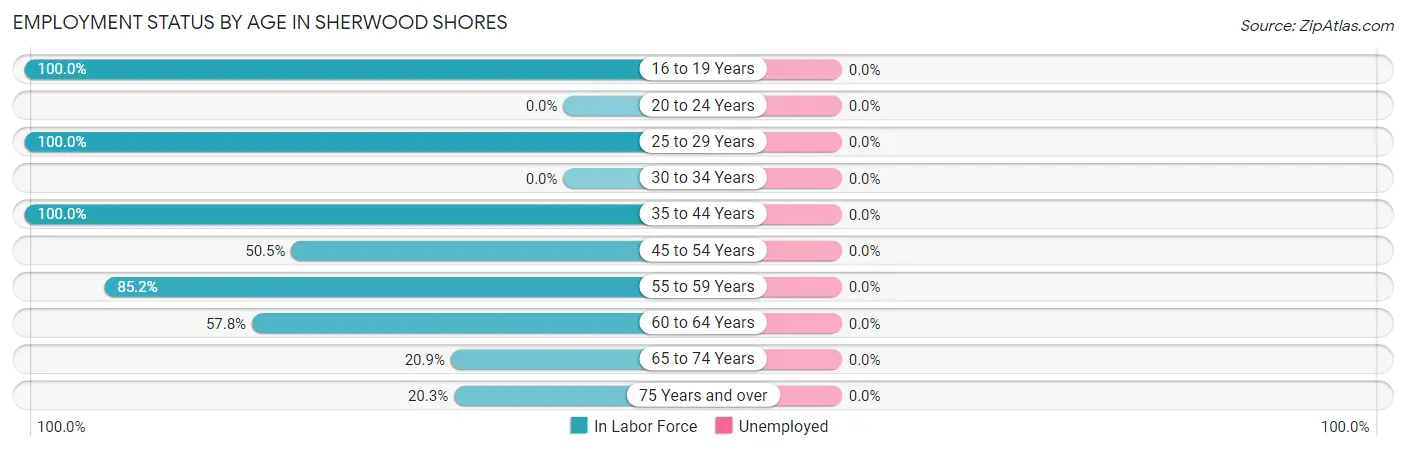
Employment Status by Age in Sherwood Shores
| Age Bracket | In Labor Force | Unemployed |
| 16 to 19 Years | 25 (100.0%) | 0 (0.0%) |
| 20 to 24 Years | 0 (0.0%) | 0 (0.0%) |
| 25 to 29 Years | 32 (100.0%) | 0 (0.0%) |
| 30 to 34 Years | 0 (0.0%) | 0 (0.0%) |
| 35 to 44 Years | 41 (100.0%) | 0 (0.0%) |
| 45 to 54 Years | 96 (50.5%) | 0 (0.0%) |
| 55 to 59 Years | 52 (85.2%) | 0 (0.0%) |
| 60 to 64 Years | 52 (57.8%) | 0 (0.0%) |
| 65 to 74 Years | 65 (20.9%) | 0 (0.0%) |
| 75 Years and over | 13 (20.3%) | 0 (0.0%) |
| Total | 376 (45.6%) | 0 (0.0%) |
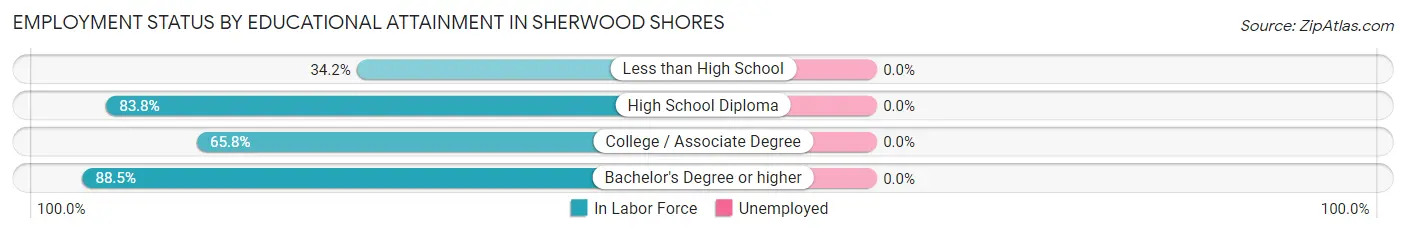
Employment Status by Educational Attainment in Sherwood Shores
| Educational Attainment | In Labor Force | Unemployed |
| Less than High School | 40 (34.2%) | 0 (0.0%) |
| High School Diploma | 62 (83.8%) | 0 (0.0%) |
| College / Associate Degree | 102 (65.8%) | 0 (0.0%) |
| Bachelor's Degree or higher | 69 (88.5%) | 0 (0.0%) |
| Total | 273 (64.4%) | 0 (0.0%) |
Employment Occupations by Sex in Sherwood Shores
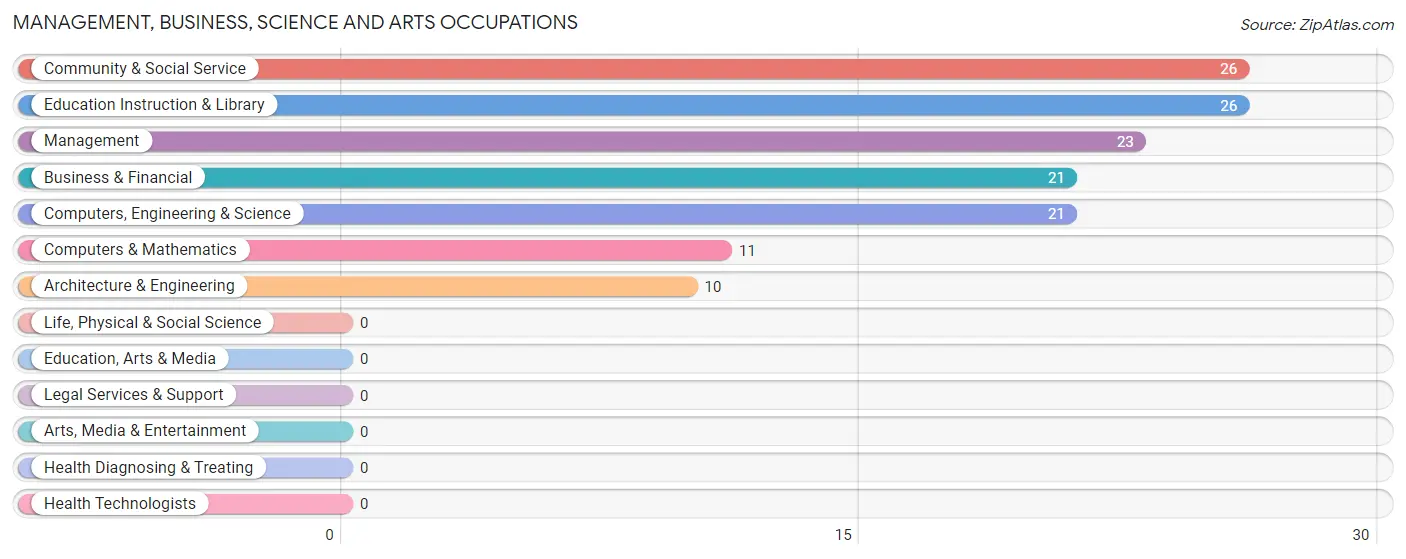
Management, Business, Science and Arts Occupations
The most common Management, Business, Science and Arts occupations in Sherwood Shores are Community & Social Service (26 | 6.9%), Education Instruction & Library (26 | 6.9%), Management (23 | 6.1%), Business & Financial (21 | 5.6%), and Computers, Engineering & Science (21 | 5.6%).
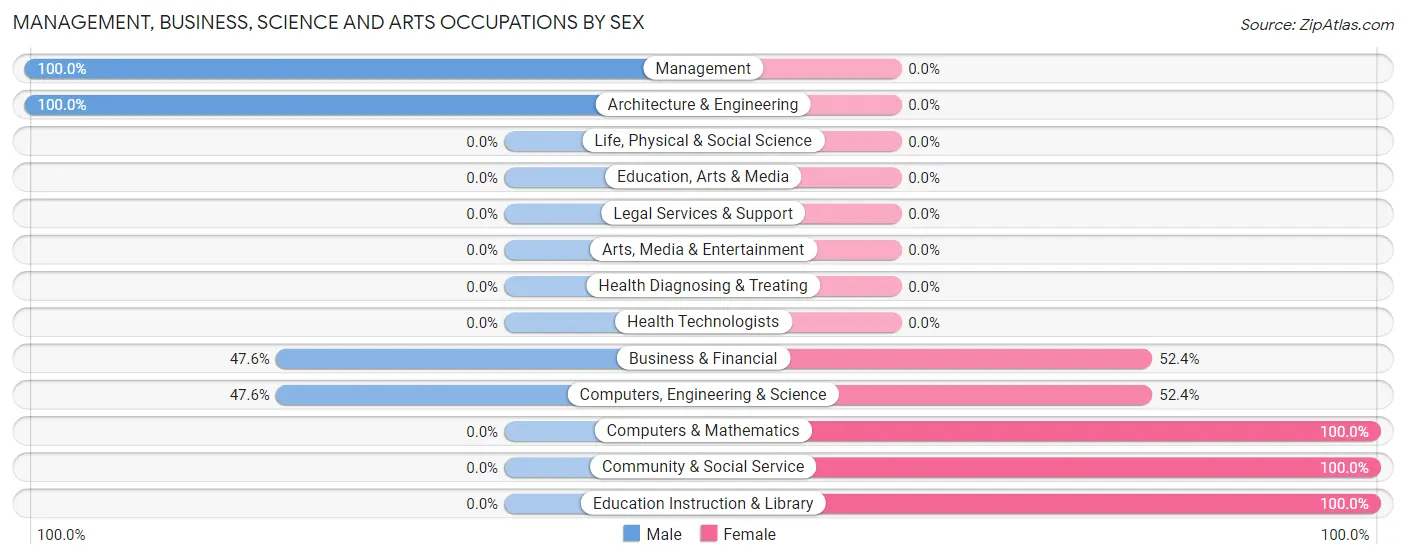
Management, Business, Science and Arts Occupations by Sex
Within the Management, Business, Science and Arts occupations in Sherwood Shores, the most male-oriented occupations are Management (100.0%), Architecture & Engineering (100.0%), and Business & Financial (47.6%), while the most female-oriented occupations are Computers & Mathematics (100.0%), Community & Social Service (100.0%), and Education Instruction & Library (100.0%).
| Occupation | Male | Female |
| Management | 23 (100.0%) | 0 (0.0%) |
| Business & Financial | 10 (47.6%) | 11 (52.4%) |
| Computers, Engineering & Science | 10 (47.6%) | 11 (52.4%) |
| Computers & Mathematics | 0 (0.0%) | 11 (100.0%) |
| Architecture & Engineering | 10 (100.0%) | 0 (0.0%) |
| Life, Physical & Social Science | 0 (0.0%) | 0 (0.0%) |
| Community & Social Service | 0 (0.0%) | 26 (100.0%) |
| Education, Arts & Media | 0 (0.0%) | 0 (0.0%) |
| Legal Services & Support | 0 (0.0%) | 0 (0.0%) |
| Education Instruction & Library | 0 (0.0%) | 26 (100.0%) |
| Arts, Media & Entertainment | 0 (0.0%) | 0 (0.0%) |
| Health Diagnosing & Treating | 0 (0.0%) | 0 (0.0%) |
| Health Technologists | 0 (0.0%) | 0 (0.0%) |
| Total (Category) | 43 (47.2%) | 48 (52.7%) |
| Total (Overall) | 195 (51.9%) | 181 (48.1%) |
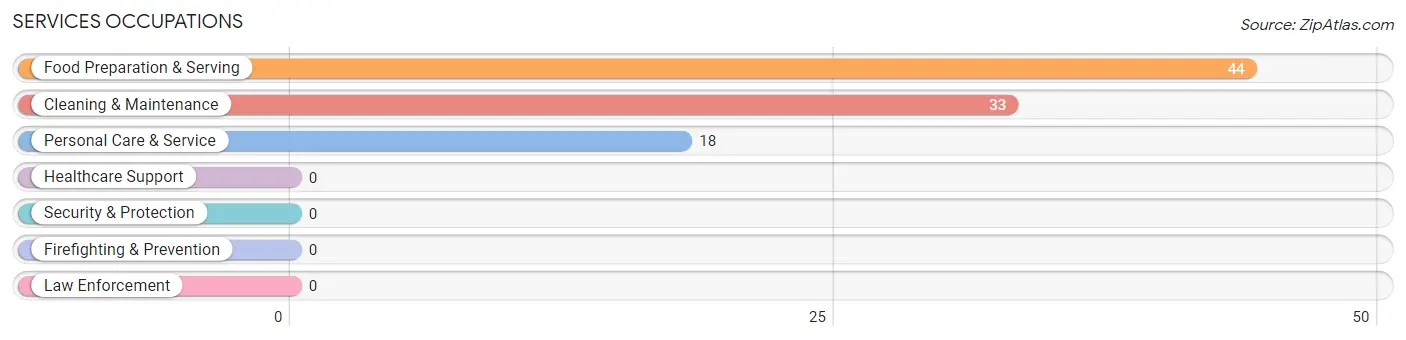
Services Occupations
The most common Services occupations in Sherwood Shores are Food Preparation & Serving (44 | 11.7%), Cleaning & Maintenance (33 | 8.8%), and Personal Care & Service (18 | 4.8%).
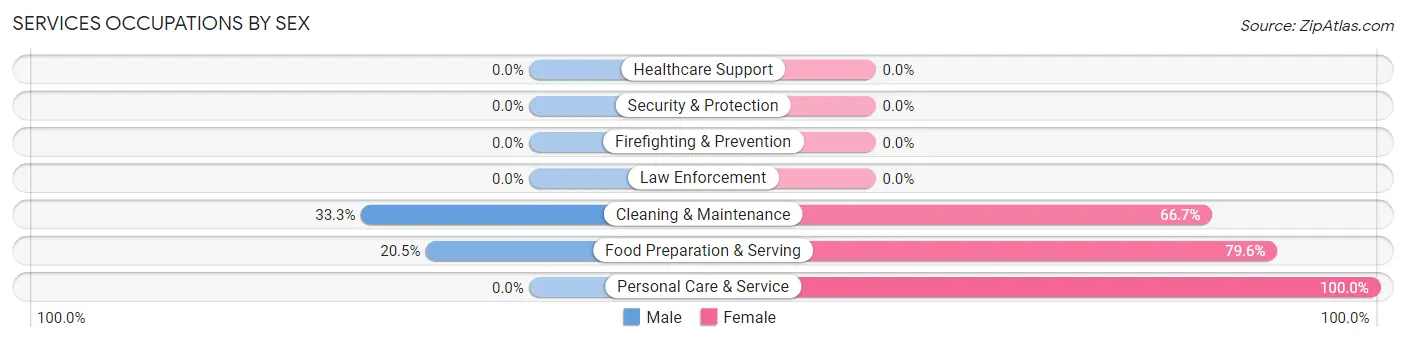
Services Occupations by Sex
Within the Services occupations in Sherwood Shores, the most male-oriented occupations are Cleaning & Maintenance (33.3%), and Food Preparation & Serving (20.4%), while the most female-oriented occupations are Personal Care & Service (100.0%), Food Preparation & Serving (79.5%), and Cleaning & Maintenance (66.7%).
| Occupation | Male | Female |
| Healthcare Support | 0 (0.0%) | 0 (0.0%) |
| Security & Protection | 0 (0.0%) | 0 (0.0%) |
| Firefighting & Prevention | 0 (0.0%) | 0 (0.0%) |
| Law Enforcement | 0 (0.0%) | 0 (0.0%) |
| Food Preparation & Serving | 9 (20.4%) | 35 (79.5%) |
| Cleaning & Maintenance | 11 (33.3%) | 22 (66.7%) |
| Personal Care & Service | 0 (0.0%) | 18 (100.0%) |
| Total (Category) | 20 (21.0%) | 75 (78.9%) |
| Total (Overall) | 195 (51.9%) | 181 (48.1%) |
Sales and Office Occupations
The most common Sales and Office occupations in Sherwood Shores are Sales & Related (50 | 13.3%), and Office & Administration (28 | 7.4%).
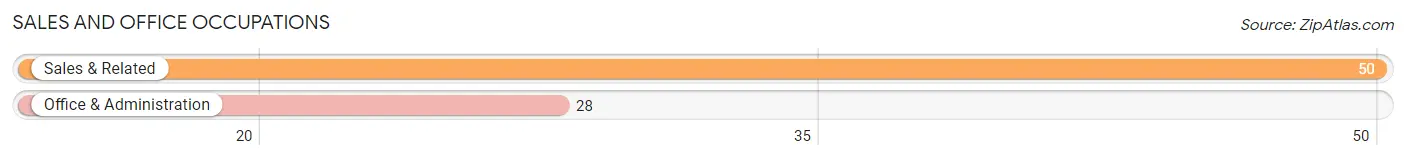
Sales and Office Occupations by Sex
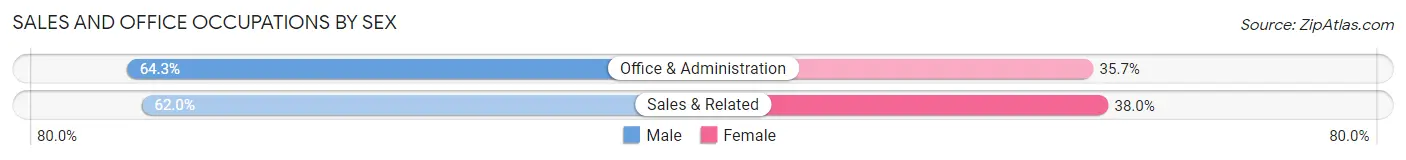
| Occupation | Male | Female |
| Sales & Related | 31 (62.0%) | 19 (38.0%) |
| Office & Administration | 18 (64.3%) | 10 (35.7%) |
| Total (Category) | 49 (62.8%) | 29 (37.2%) |
| Total (Overall) | 195 (51.9%) | 181 (48.1%) |
Natural Resources, Construction and Maintenance Occupations
The most common Natural Resources, Construction and Maintenance occupations in Sherwood Shores are Construction & Extraction (30 | 8.0%), and Installation, Maintenance & Repair (14 | 3.7%).
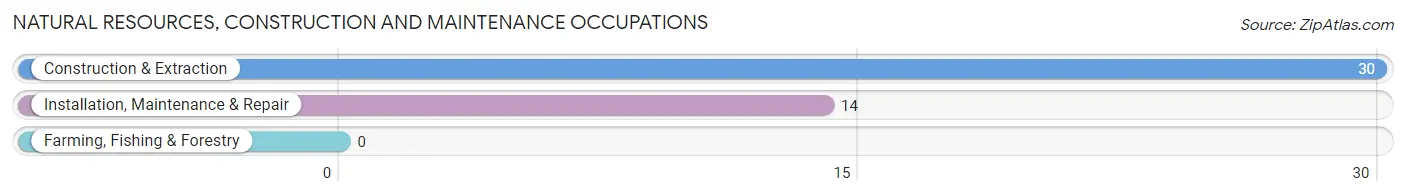
Natural Resources, Construction and Maintenance Occupations by Sex
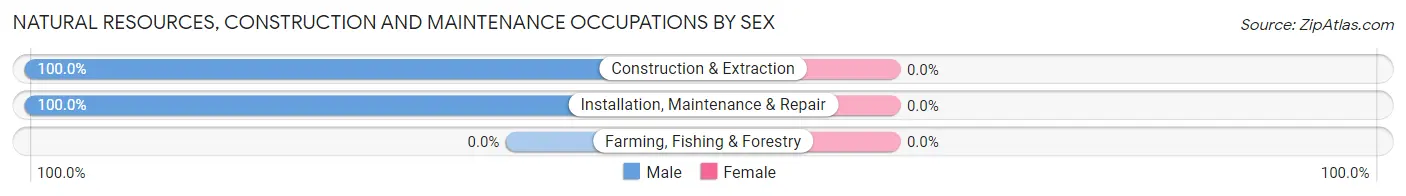
| Occupation | Male | Female |
| Farming, Fishing & Forestry | 0 (0.0%) | 0 (0.0%) |
| Construction & Extraction | 30 (100.0%) | 0 (0.0%) |
| Installation, Maintenance & Repair | 14 (100.0%) | 0 (0.0%) |
| Total (Category) | 44 (100.0%) | 0 (0.0%) |
| Total (Overall) | 195 (51.9%) | 181 (48.1%) |
Production, Transportation and Moving Occupations
The most common Production, Transportation and Moving occupations in Sherwood Shores are Material Moving (39 | 10.4%), Transportation (19 | 5.1%), and Production (10 | 2.7%).
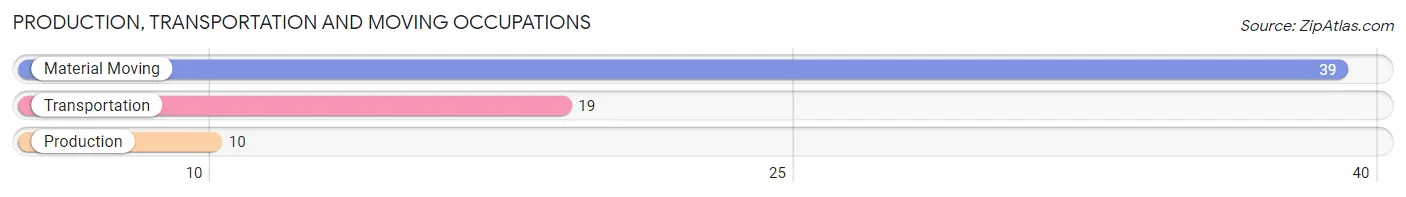
Production, Transportation and Moving Occupations by Sex
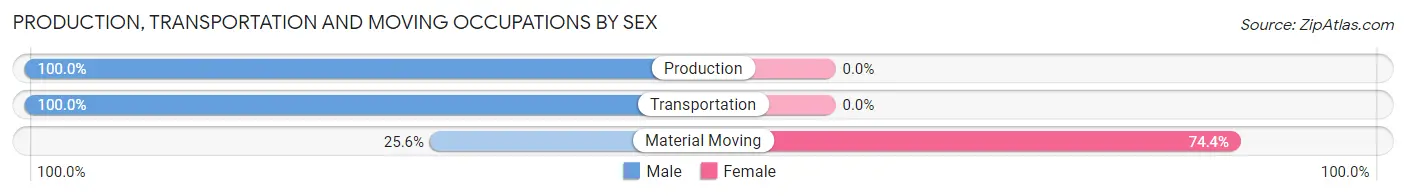
| Occupation | Male | Female |
| Production | 10 (100.0%) | 0 (0.0%) |
| Transportation | 19 (100.0%) | 0 (0.0%) |
| Material Moving | 10 (25.6%) | 29 (74.4%) |
| Total (Category) | 39 (57.4%) | 29 (42.6%) |
| Total (Overall) | 195 (51.9%) | 181 (48.1%) |
Employment Industries by Sex in Sherwood Shores
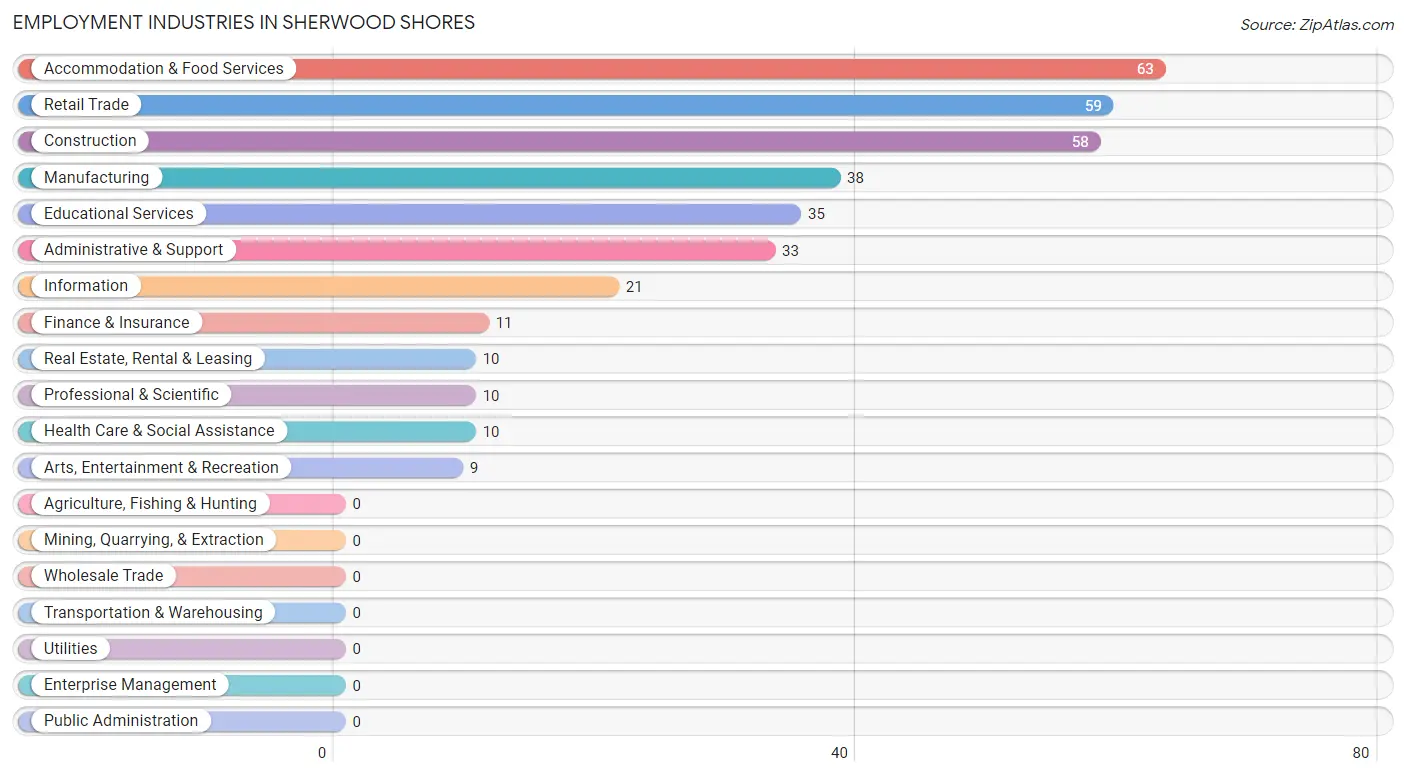
Employment Industries in Sherwood Shores
The major employment industries in Sherwood Shores include Accommodation & Food Services (63 | 16.8%), Retail Trade (59 | 15.7%), Construction (58 | 15.4%), Manufacturing (38 | 10.1%), and Educational Services (35 | 9.3%).
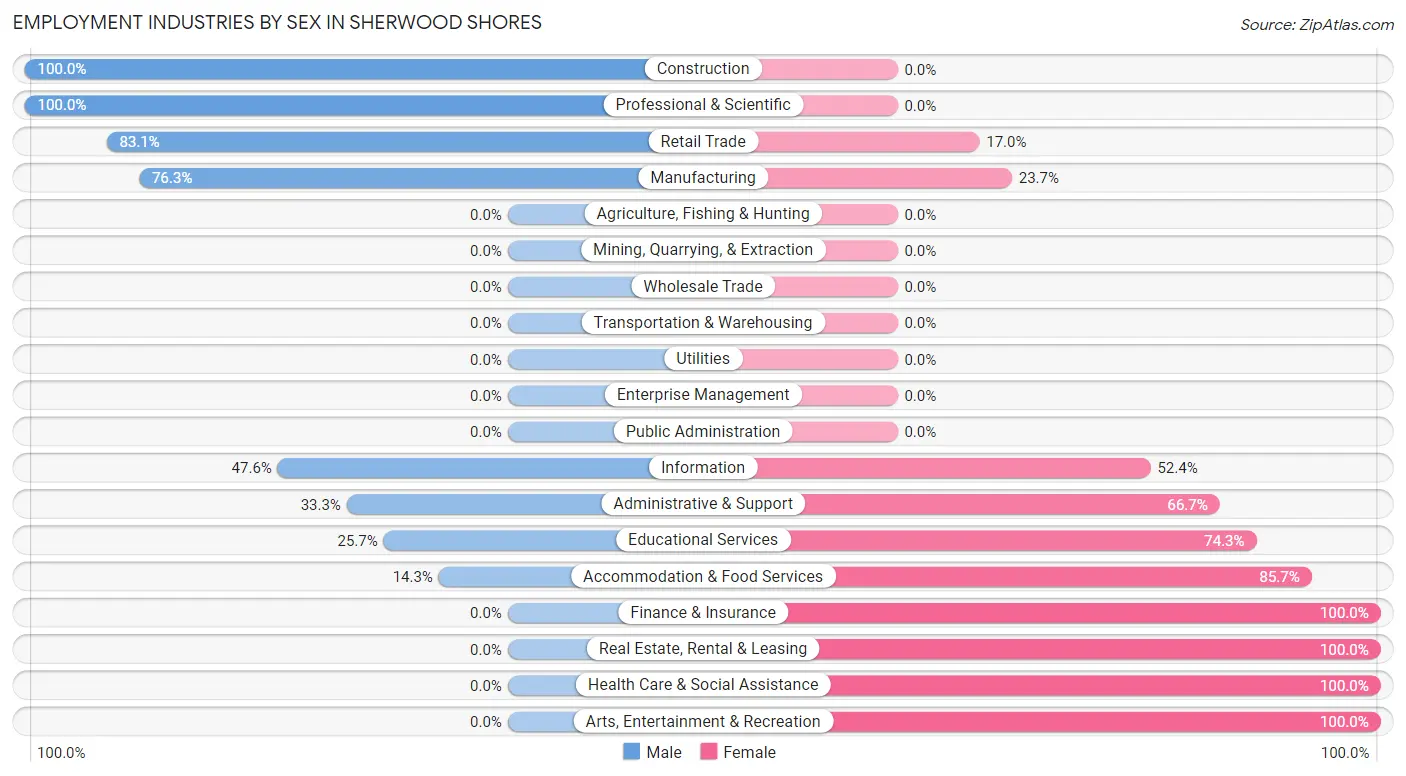
Employment Industries by Sex in Sherwood Shores
The Sherwood Shores industries that see more men than women are Construction (100.0%), Professional & Scientific (100.0%), and Retail Trade (83.1%), whereas the industries that tend to have a higher number of women are Finance & Insurance (100.0%), Real Estate, Rental & Leasing (100.0%), and Health Care & Social Assistance (100.0%).
| Industry | Male | Female |
| Agriculture, Fishing & Hunting | 0 (0.0%) | 0 (0.0%) |
| Mining, Quarrying, & Extraction | 0 (0.0%) | 0 (0.0%) |
| Construction | 58 (100.0%) | 0 (0.0%) |
| Manufacturing | 29 (76.3%) | 9 (23.7%) |
| Wholesale Trade | 0 (0.0%) | 0 (0.0%) |
| Retail Trade | 49 (83.1%) | 10 (17.0%) |
| Transportation & Warehousing | 0 (0.0%) | 0 (0.0%) |
| Utilities | 0 (0.0%) | 0 (0.0%) |
| Information | 10 (47.6%) | 11 (52.4%) |
| Finance & Insurance | 0 (0.0%) | 11 (100.0%) |
| Real Estate, Rental & Leasing | 0 (0.0%) | 10 (100.0%) |
| Professional & Scientific | 10 (100.0%) | 0 (0.0%) |
| Enterprise Management | 0 (0.0%) | 0 (0.0%) |
| Administrative & Support | 11 (33.3%) | 22 (66.7%) |
| Educational Services | 9 (25.7%) | 26 (74.3%) |
| Health Care & Social Assistance | 0 (0.0%) | 10 (100.0%) |
| Arts, Entertainment & Recreation | 0 (0.0%) | 9 (100.0%) |
| Accommodation & Food Services | 9 (14.3%) | 54 (85.7%) |
| Public Administration | 0 (0.0%) | 0 (0.0%) |
| Total | 195 (51.9%) | 181 (48.1%) |
Education in Sherwood Shores
School Enrollment in Sherwood Shores
The most common levels of schooling among the 54 students in Sherwood Shores are high school (21 | 38.9%), elementary school (17 | 31.5%), and kindergarten (9 | 16.7%).
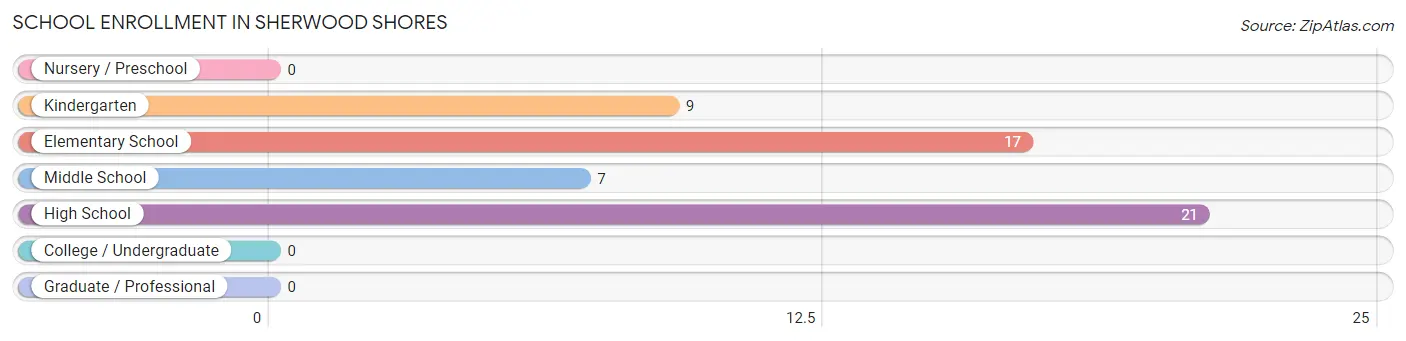
| School Level | # Students | % Students |
| Nursery / Preschool | 0 | 0.0% |
| Kindergarten | 9 | 16.7% |
| Elementary School | 17 | 31.5% |
| Middle School | 7 | 13.0% |
| High School | 21 | 38.9% |
| College / Undergraduate | 0 | 0.0% |
| Graduate / Professional | 0 | 0.0% |
| Total | 54 | 100.0% |
School Enrollment by Age by Funding Source in Sherwood Shores
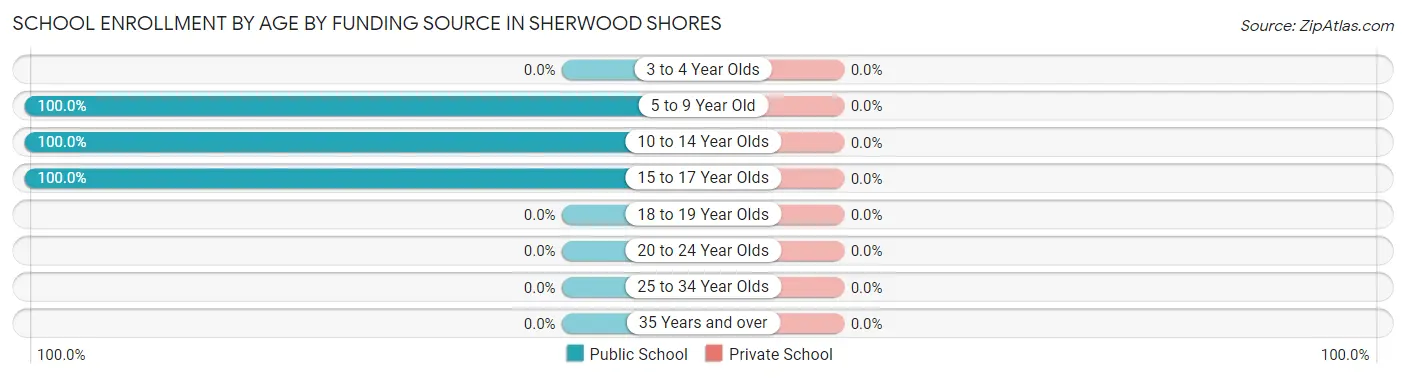
| Age Bracket | Public School | Private School |
| 3 to 4 Year Olds | 0 (0.0%) | 0 (0.0%) |
| 5 to 9 Year Old | 26 (100.0%) | 0 (0.0%) |
| 10 to 14 Year Olds | 19 (100.0%) | 0 (0.0%) |
| 15 to 17 Year Olds | 9 (100.0%) | 0 (0.0%) |
| 18 to 19 Year Olds | 0 (0.0%) | 0 (0.0%) |
| 20 to 24 Year Olds | 0 (0.0%) | 0 (0.0%) |
| 25 to 34 Year Olds | 0 (0.0%) | 0 (0.0%) |
| 35 Years and over | 0 (0.0%) | 0 (0.0%) |
| Total | 54 (100.0%) | 0 (0.0%) |
Educational Attainment by Field of Study in Sherwood Shores
Business (39 | 32.0%), visual & performing arts (19 | 15.6%), education (12 | 9.8%), bio, nature & agricultural (11 | 9.0%), and liberal arts & history (11 | 9.0%) are the most common fields of study among 122 individuals in Sherwood Shores who have obtained a bachelor's degree or higher.
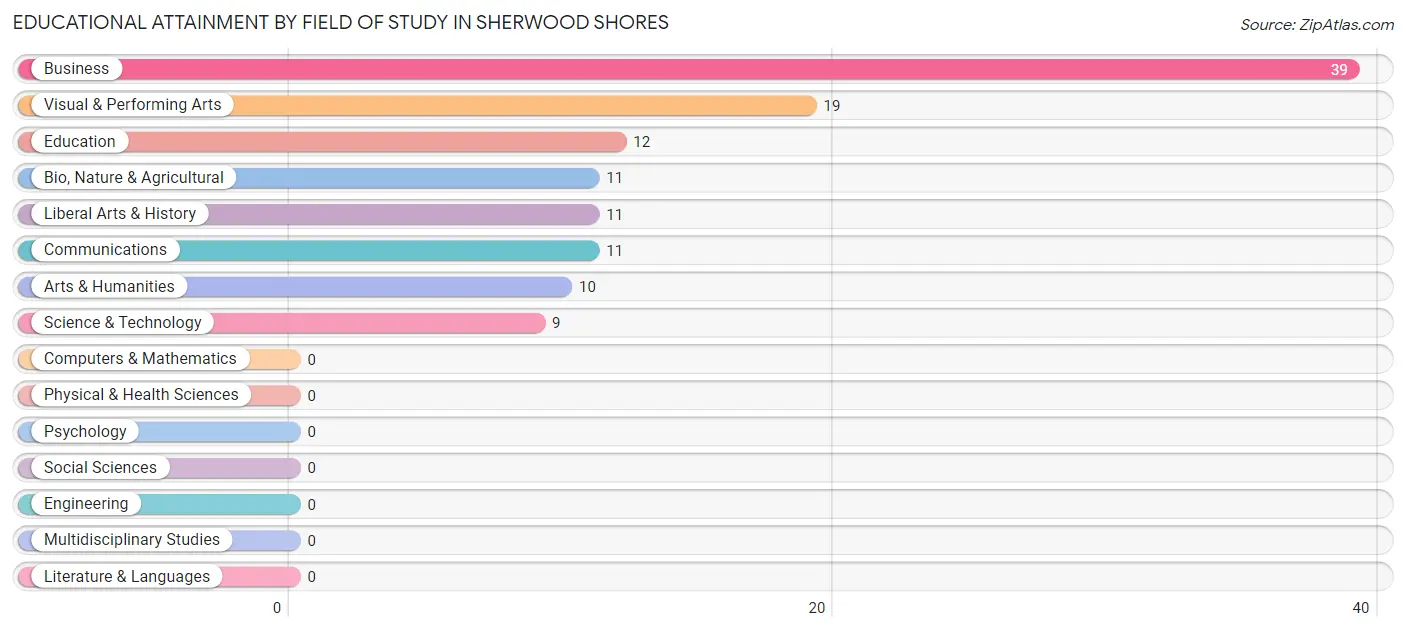
| Field of Study | # Graduates | % Graduates |
| Computers & Mathematics | 0 | 0.0% |
| Bio, Nature & Agricultural | 11 | 9.0% |
| Physical & Health Sciences | 0 | 0.0% |
| Psychology | 0 | 0.0% |
| Social Sciences | 0 | 0.0% |
| Engineering | 0 | 0.0% |
| Multidisciplinary Studies | 0 | 0.0% |
| Science & Technology | 9 | 7.4% |
| Business | 39 | 32.0% |
| Education | 12 | 9.8% |
| Literature & Languages | 0 | 0.0% |
| Liberal Arts & History | 11 | 9.0% |
| Visual & Performing Arts | 19 | 15.6% |
| Communications | 11 | 9.0% |
| Arts & Humanities | 10 | 8.2% |
| Total | 122 | 100.0% |
Transportation & Commute in Sherwood Shores
Vehicle Availability by Sex in Sherwood Shores
The most prevalent vehicle ownership categories in Sherwood Shores are males with 1 vehicle (74, accounting for 40.2%) and females with 1 vehicle (50, making up 40.9%).
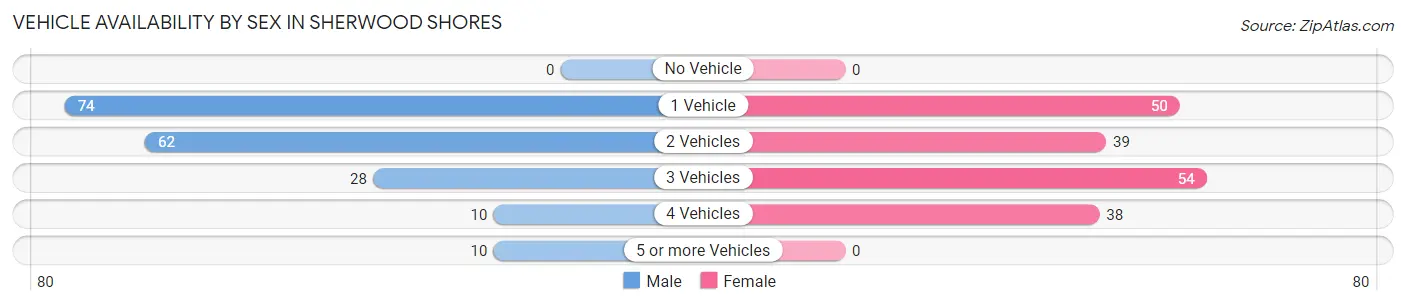
| Vehicles Available | Male | Female |
| No Vehicle | 0 (0.0%) | 0 (0.0%) |
| 1 Vehicle | 74 (40.2%) | 50 (27.6%) |
| 2 Vehicles | 62 (33.7%) | 39 (21.5%) |
| 3 Vehicles | 28 (15.2%) | 54 (29.8%) |
| 4 Vehicles | 10 (5.4%) | 38 (21.0%) |
| 5 or more Vehicles | 10 (5.4%) | 0 (0.0%) |
| Total | 184 (100.0%) | 181 (100.0%) |
Commute Time in Sherwood Shores
The most frequently occuring commute durations in Sherwood Shores are 45 to 59 minutes (50 commuters, 15.5%), 5 to 9 minutes (44 commuters, 13.6%), and 60 to 89 minutes (39 commuters, 12.1%).
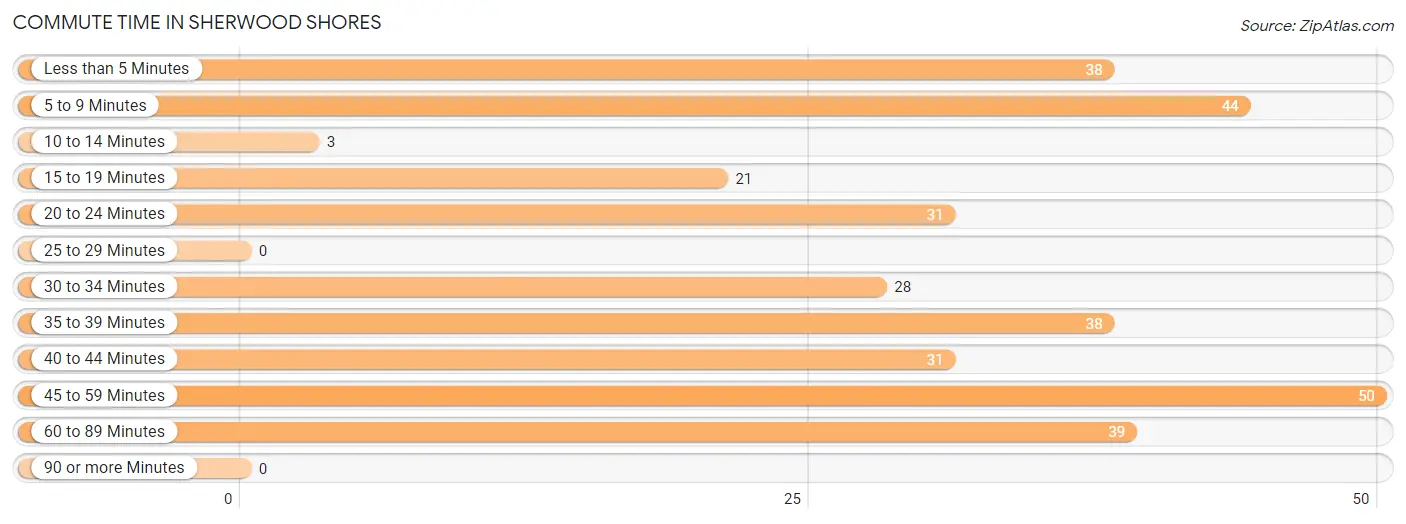
| Commute Time | # Commuters | % Commuters |
| Less than 5 Minutes | 38 | 11.8% |
| 5 to 9 Minutes | 44 | 13.6% |
| 10 to 14 Minutes | 3 | 0.9% |
| 15 to 19 Minutes | 21 | 6.5% |
| 20 to 24 Minutes | 31 | 9.6% |
| 25 to 29 Minutes | 0 | 0.0% |
| 30 to 34 Minutes | 28 | 8.7% |
| 35 to 39 Minutes | 38 | 11.8% |
| 40 to 44 Minutes | 31 | 9.6% |
| 45 to 59 Minutes | 50 | 15.5% |
| 60 to 89 Minutes | 39 | 12.1% |
| 90 or more Minutes | 0 | 0.0% |
Commute Time by Sex in Sherwood Shores
The most common commute times in Sherwood Shores are 35 to 39 minutes (28 commuters, 18.4%) for males and 45 to 59 minutes (41 commuters, 24.0%) for females.
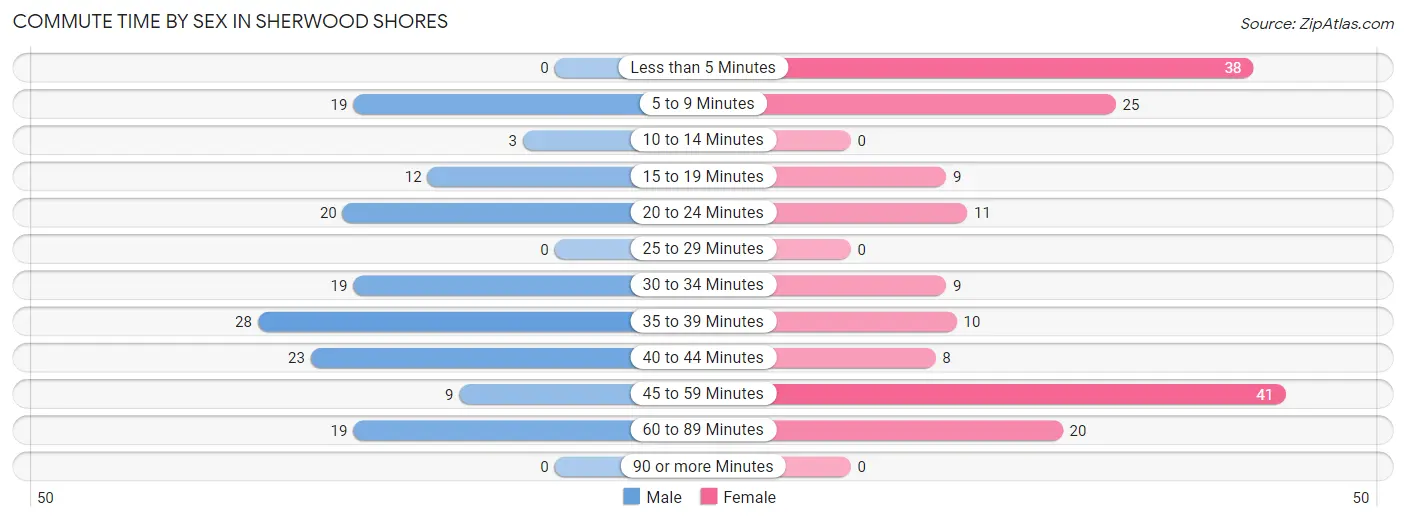
| Commute Time | Male | Female |
| Less than 5 Minutes | 0 (0.0%) | 38 (22.2%) |
| 5 to 9 Minutes | 19 (12.5%) | 25 (14.6%) |
| 10 to 14 Minutes | 3 (2.0%) | 0 (0.0%) |
| 15 to 19 Minutes | 12 (7.9%) | 9 (5.3%) |
| 20 to 24 Minutes | 20 (13.2%) | 11 (6.4%) |
| 25 to 29 Minutes | 0 (0.0%) | 0 (0.0%) |
| 30 to 34 Minutes | 19 (12.5%) | 9 (5.3%) |
| 35 to 39 Minutes | 28 (18.4%) | 10 (5.9%) |
| 40 to 44 Minutes | 23 (15.1%) | 8 (4.7%) |
| 45 to 59 Minutes | 9 (5.9%) | 41 (24.0%) |
| 60 to 89 Minutes | 19 (12.5%) | 20 (11.7%) |
| 90 or more Minutes | 0 (0.0%) | 0 (0.0%) |
Time of Departure to Work by Sex in Sherwood Shores
The most frequent times of departure to work in Sherwood Shores are 12:00 PM to 3:59 PM (37, 24.3%) for males and 7:00 AM to 7:29 AM (72, 42.1%) for females.
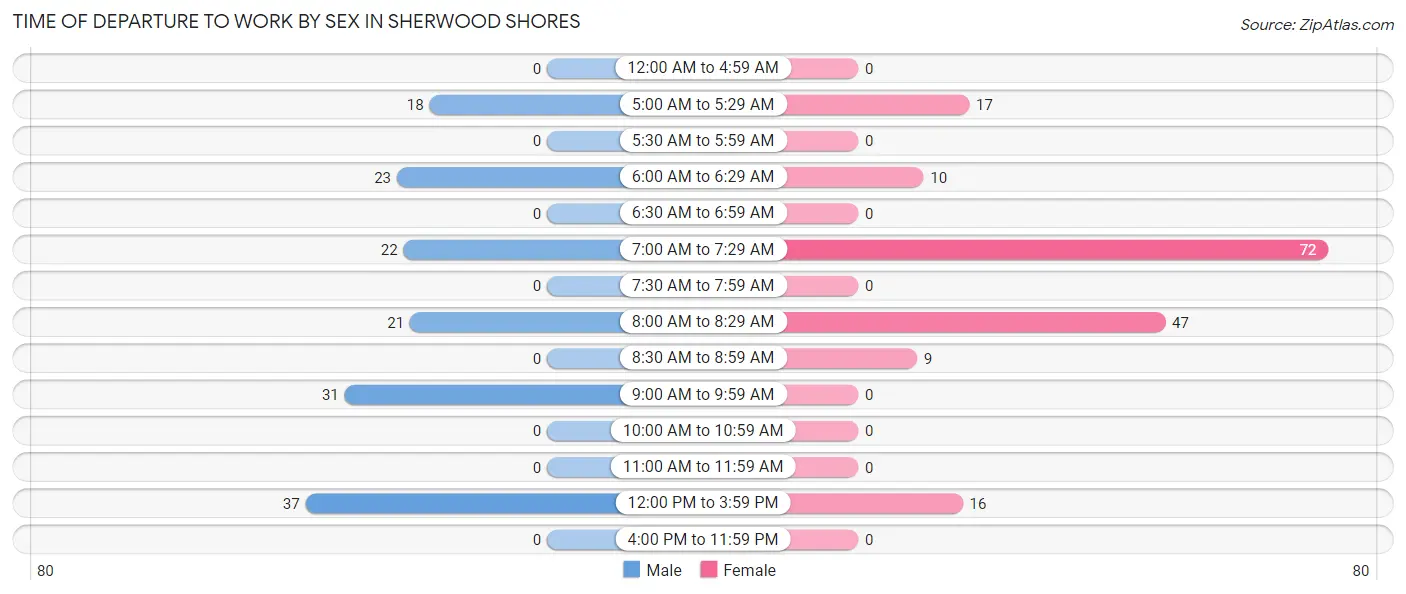
| Time of Departure | Male | Female |
| 12:00 AM to 4:59 AM | 0 (0.0%) | 0 (0.0%) |
| 5:00 AM to 5:29 AM | 18 (11.8%) | 17 (9.9%) |
| 5:30 AM to 5:59 AM | 0 (0.0%) | 0 (0.0%) |
| 6:00 AM to 6:29 AM | 23 (15.1%) | 10 (5.9%) |
| 6:30 AM to 6:59 AM | 0 (0.0%) | 0 (0.0%) |
| 7:00 AM to 7:29 AM | 22 (14.5%) | 72 (42.1%) |
| 7:30 AM to 7:59 AM | 0 (0.0%) | 0 (0.0%) |
| 8:00 AM to 8:29 AM | 21 (13.8%) | 47 (27.5%) |
| 8:30 AM to 8:59 AM | 0 (0.0%) | 9 (5.3%) |
| 9:00 AM to 9:59 AM | 31 (20.4%) | 0 (0.0%) |
| 10:00 AM to 10:59 AM | 0 (0.0%) | 0 (0.0%) |
| 11:00 AM to 11:59 AM | 0 (0.0%) | 0 (0.0%) |
| 12:00 PM to 3:59 PM | 37 (24.3%) | 16 (9.4%) |
| 4:00 PM to 11:59 PM | 0 (0.0%) | 0 (0.0%) |
| Total | 152 (100.0%) | 171 (100.0%) |
Housing Occupancy in Sherwood Shores
Occupancy by Ownership in Sherwood Shores
Of the total 497 dwellings in Sherwood Shores, owner-occupied units account for 388 (78.1%), while renter-occupied units make up 109 (21.9%).
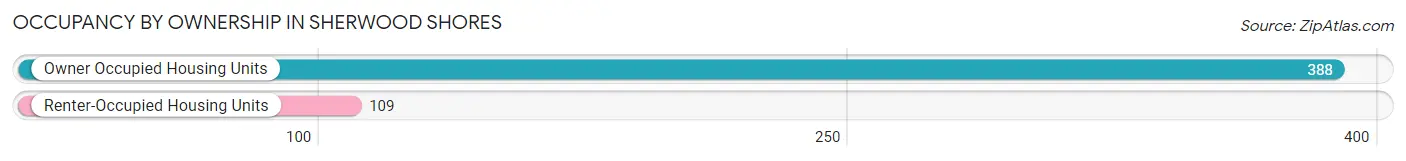
| Occupancy | # Housing Units | % Housing Units |
| Owner Occupied Housing Units | 388 | 78.1% |
| Renter-Occupied Housing Units | 109 | 21.9% |
| Total Occupied Housing Units | 497 | 100.0% |
Occupancy by Household Size in Sherwood Shores
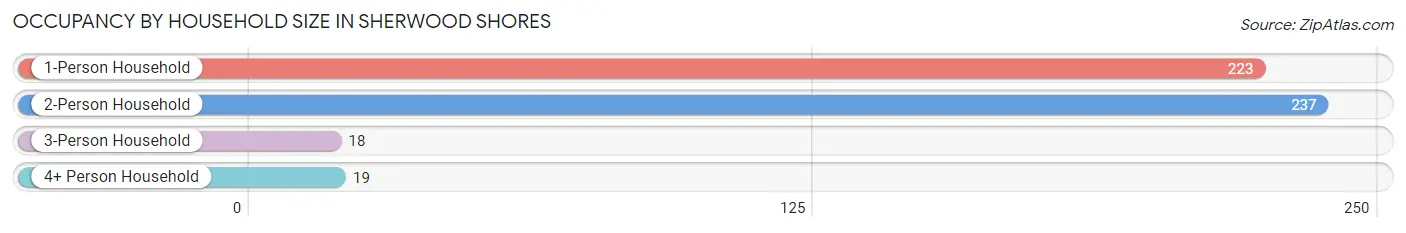
| Household Size | # Housing Units | % Housing Units |
| 1-Person Household | 223 | 44.9% |
| 2-Person Household | 237 | 47.7% |
| 3-Person Household | 18 | 3.6% |
| 4+ Person Household | 19 | 3.8% |
| Total Housing Units | 497 | 100.0% |
Occupancy by Ownership by Household Size in Sherwood Shores
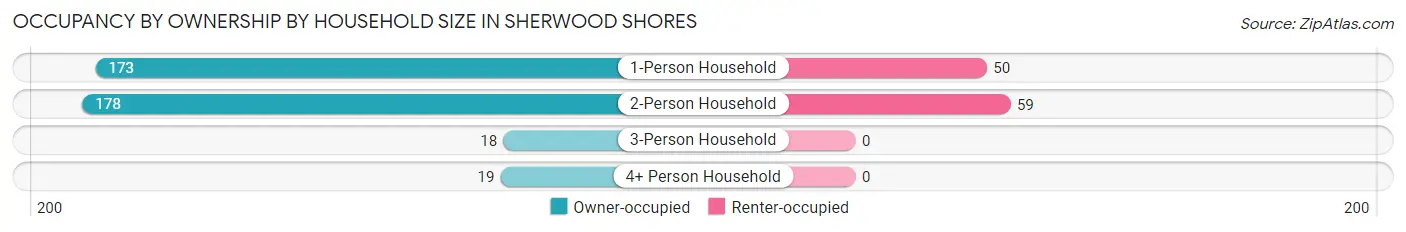
| Household Size | Owner-occupied | Renter-occupied |
| 1-Person Household | 173 (77.6%) | 50 (22.4%) |
| 2-Person Household | 178 (75.1%) | 59 (24.9%) |
| 3-Person Household | 18 (100.0%) | 0 (0.0%) |
| 4+ Person Household | 19 (100.0%) | 0 (0.0%) |
| Total Housing Units | 388 (78.1%) | 109 (21.9%) |
Occupancy by Educational Attainment in Sherwood Shores
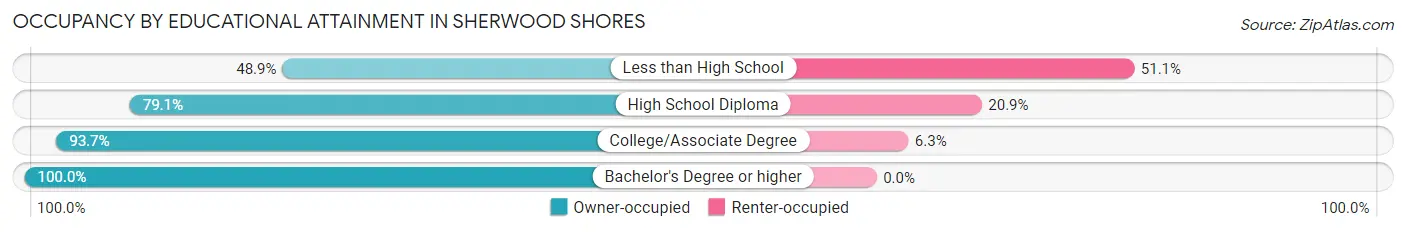
| Household Size | Owner-occupied | Renter-occupied |
| Less than High School | 67 (48.9%) | 70 (51.1%) |
| High School Diploma | 110 (79.1%) | 29 (20.9%) |
| College/Associate Degree | 149 (93.7%) | 10 (6.3%) |
| Bachelor's Degree or higher | 62 (100.0%) | 0 (0.0%) |
Occupancy by Age of Householder in Sherwood Shores
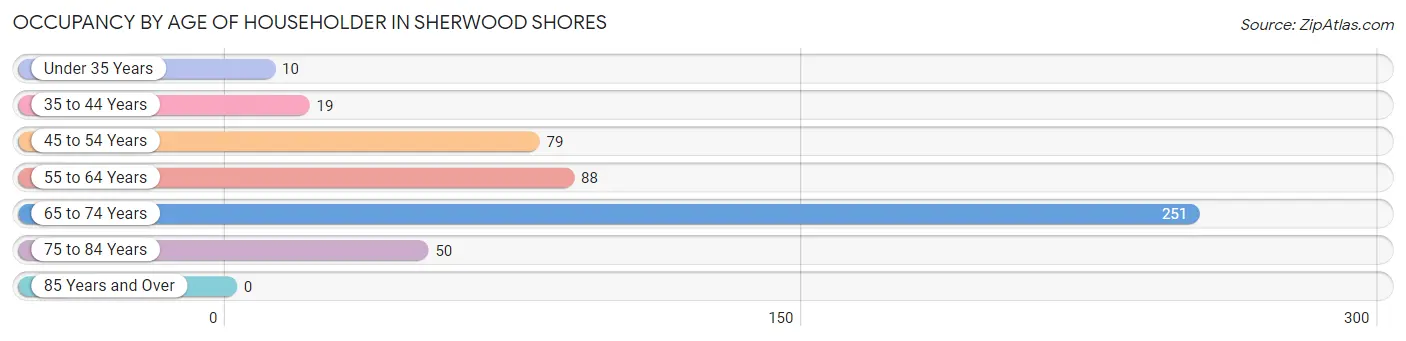
| Age Bracket | # Households | % Households |
| Under 35 Years | 10 | 2.0% |
| 35 to 44 Years | 19 | 3.8% |
| 45 to 54 Years | 79 | 15.9% |
| 55 to 64 Years | 88 | 17.7% |
| 65 to 74 Years | 251 | 50.5% |
| 75 to 84 Years | 50 | 10.1% |
| 85 Years and Over | 0 | 0.0% |
| Total | 497 | 100.0% |
Housing Finances in Sherwood Shores
Median Income by Occupancy in Sherwood Shores
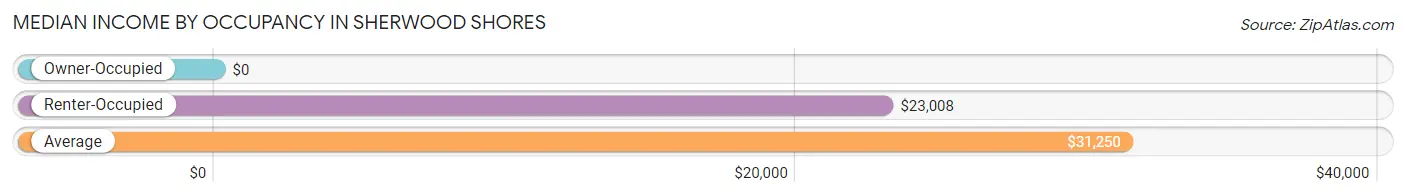
| Occupancy Type | # Households | Median Income |
| Owner-Occupied | 388 (78.1%) | $0 |
| Renter-Occupied | 109 (21.9%) | $23,008 |
| Average | 497 (100.0%) | $31,250 |
Occupancy by Householder Income Bracket in Sherwood Shores
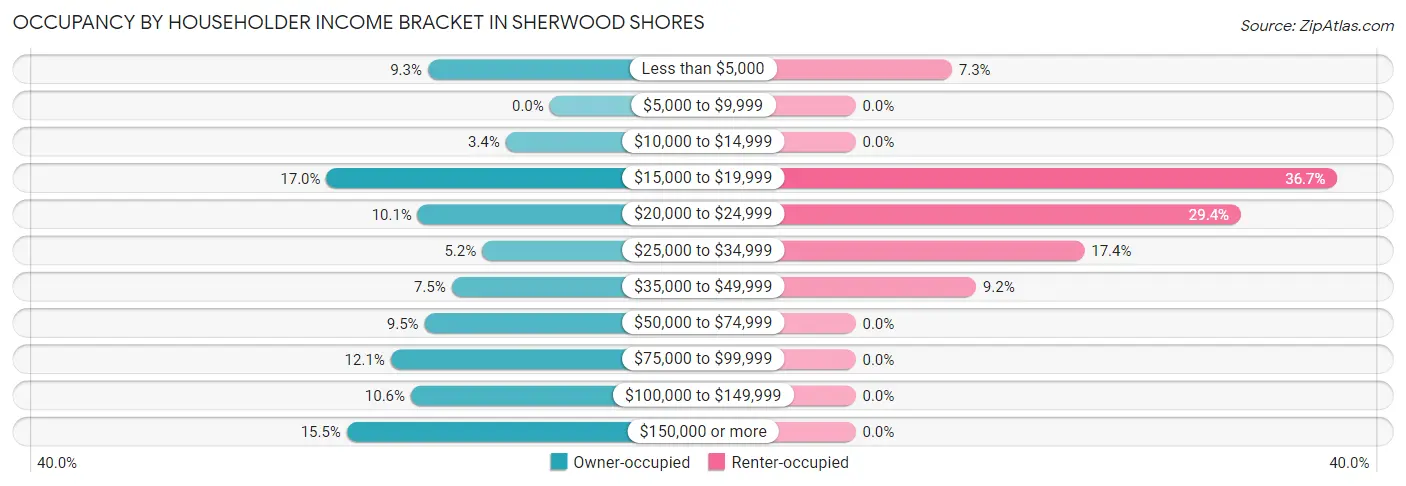
| Income Bracket | Owner-occupied | Renter-occupied |
| Less than $5,000 | 36 (9.3%) | 8 (7.3%) |
| $5,000 to $9,999 | 0 (0.0%) | 0 (0.0%) |
| $10,000 to $14,999 | 13 (3.4%) | 0 (0.0%) |
| $15,000 to $19,999 | 66 (17.0%) | 40 (36.7%) |
| $20,000 to $24,999 | 39 (10.1%) | 32 (29.4%) |
| $25,000 to $34,999 | 20 (5.1%) | 19 (17.4%) |
| $35,000 to $49,999 | 29 (7.5%) | 10 (9.2%) |
| $50,000 to $74,999 | 37 (9.5%) | 0 (0.0%) |
| $75,000 to $99,999 | 47 (12.1%) | 0 (0.0%) |
| $100,000 to $149,999 | 41 (10.6%) | 0 (0.0%) |
| $150,000 or more | 60 (15.5%) | 0 (0.0%) |
| Total | 388 (100.0%) | 109 (100.0%) |
Monthly Housing Cost Tiers in Sherwood Shores
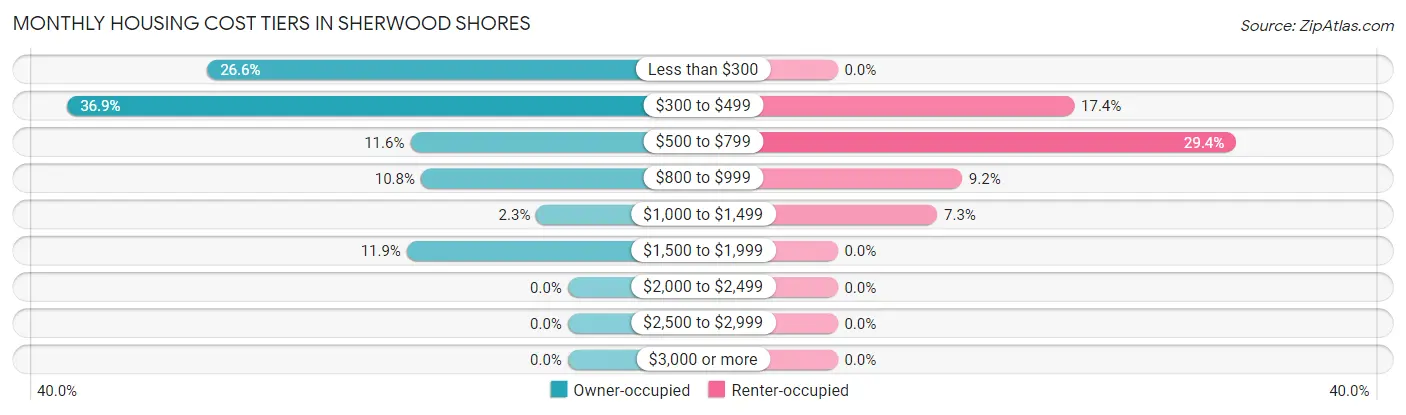
| Monthly Cost | Owner-occupied | Renter-occupied |
| Less than $300 | 103 (26.6%) | 0 (0.0%) |
| $300 to $499 | 143 (36.9%) | 19 (17.4%) |
| $500 to $799 | 45 (11.6%) | 32 (29.4%) |
| $800 to $999 | 42 (10.8%) | 10 (9.2%) |
| $1,000 to $1,499 | 9 (2.3%) | 8 (7.3%) |
| $1,500 to $1,999 | 46 (11.9%) | 0 (0.0%) |
| $2,000 to $2,499 | 0 (0.0%) | 0 (0.0%) |
| $2,500 to $2,999 | 0 (0.0%) | 0 (0.0%) |
| $3,000 or more | 0 (0.0%) | 0 (0.0%) |
| Total | 388 (100.0%) | 109 (100.0%) |
Physical Housing Characteristics in Sherwood Shores
Housing Structures in Sherwood Shores
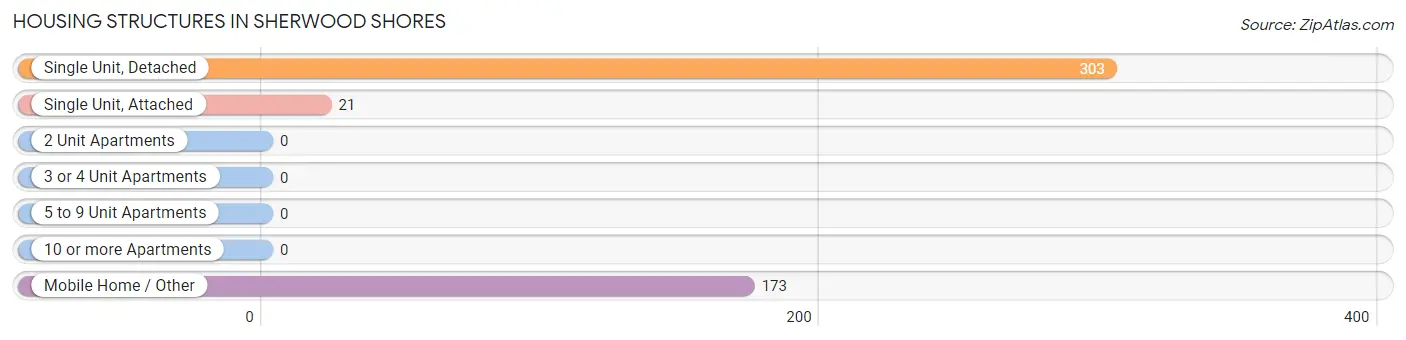
| Structure Type | # Housing Units | % Housing Units |
| Single Unit, Detached | 303 | 61.0% |
| Single Unit, Attached | 21 | 4.2% |
| 2 Unit Apartments | 0 | 0.0% |
| 3 or 4 Unit Apartments | 0 | 0.0% |
| 5 to 9 Unit Apartments | 0 | 0.0% |
| 10 or more Apartments | 0 | 0.0% |
| Mobile Home / Other | 173 | 34.8% |
| Total | 497 | 100.0% |
Housing Structures by Occupancy in Sherwood Shores
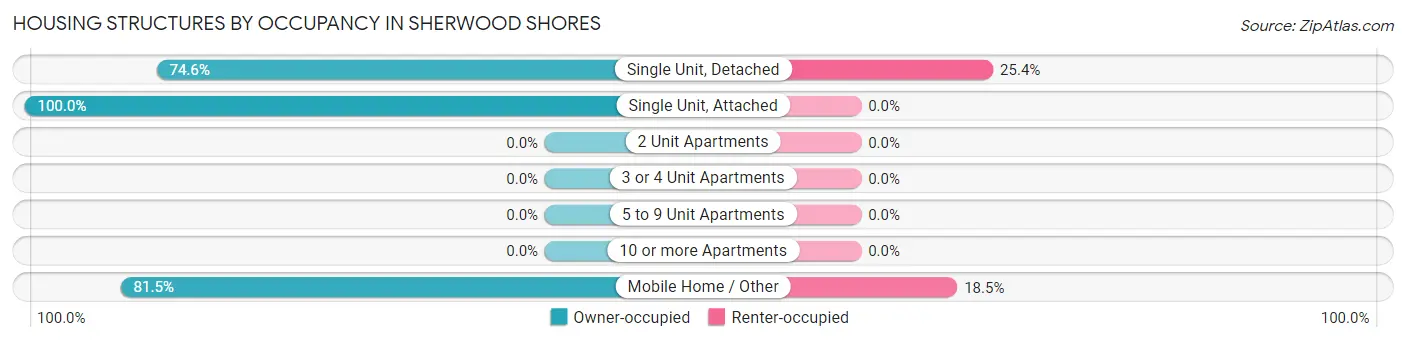
| Structure Type | Owner-occupied | Renter-occupied |
| Single Unit, Detached | 226 (74.6%) | 77 (25.4%) |
| Single Unit, Attached | 21 (100.0%) | 0 (0.0%) |
| 2 Unit Apartments | 0 (0.0%) | 0 (0.0%) |
| 3 or 4 Unit Apartments | 0 (0.0%) | 0 (0.0%) |
| 5 to 9 Unit Apartments | 0 (0.0%) | 0 (0.0%) |
| 10 or more Apartments | 0 (0.0%) | 0 (0.0%) |
| Mobile Home / Other | 141 (81.5%) | 32 (18.5%) |
| Total | 388 (78.1%) | 109 (21.9%) |
Housing Structures by Number of Rooms in Sherwood Shores
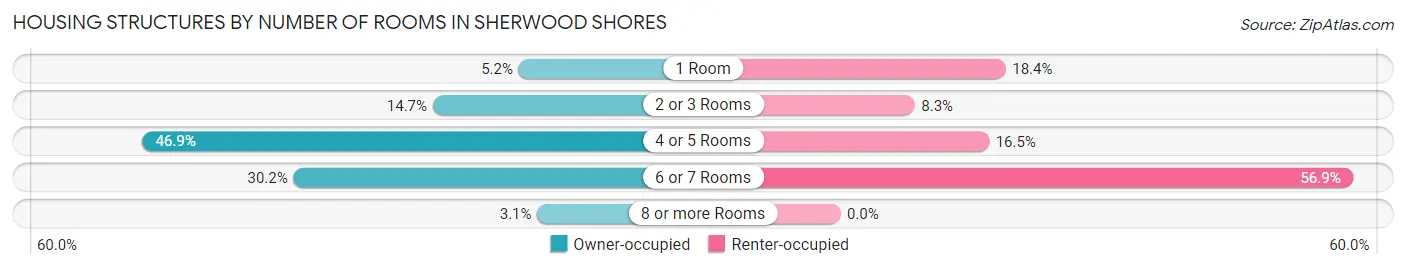
| Number of Rooms | Owner-occupied | Renter-occupied |
| 1 Room | 20 (5.1%) | 20 (18.3%) |
| 2 or 3 Rooms | 57 (14.7%) | 9 (8.3%) |
| 4 or 5 Rooms | 182 (46.9%) | 18 (16.5%) |
| 6 or 7 Rooms | 117 (30.1%) | 62 (56.9%) |
| 8 or more Rooms | 12 (3.1%) | 0 (0.0%) |
| Total | 388 (100.0%) | 109 (100.0%) |
Housing Structure by Heating Type in Sherwood Shores
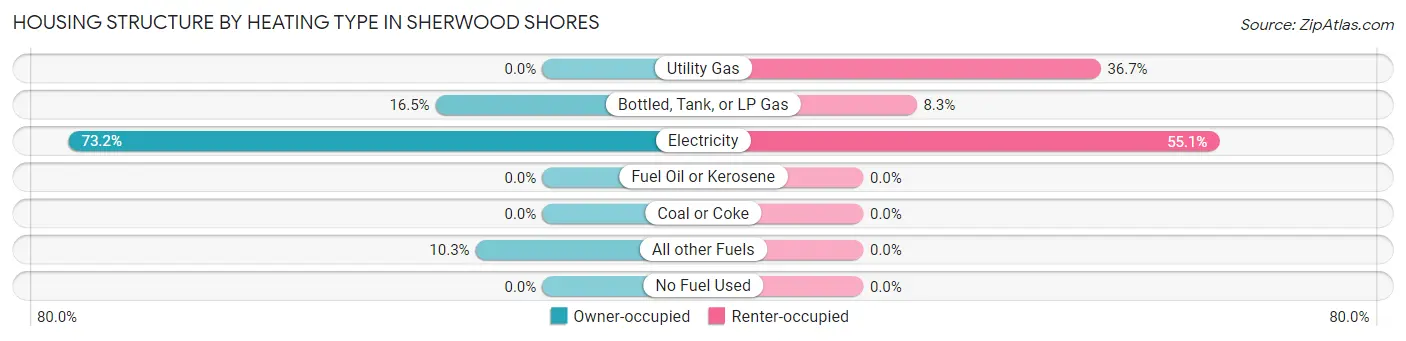
| Heating Type | Owner-occupied | Renter-occupied |
| Utility Gas | 0 (0.0%) | 40 (36.7%) |
| Bottled, Tank, or LP Gas | 64 (16.5%) | 9 (8.3%) |
| Electricity | 284 (73.2%) | 60 (55.0%) |
| Fuel Oil or Kerosene | 0 (0.0%) | 0 (0.0%) |
| Coal or Coke | 0 (0.0%) | 0 (0.0%) |
| All other Fuels | 40 (10.3%) | 0 (0.0%) |
| No Fuel Used | 0 (0.0%) | 0 (0.0%) |
| Total | 388 (100.0%) | 109 (100.0%) |
Household Vehicle Usage in Sherwood Shores
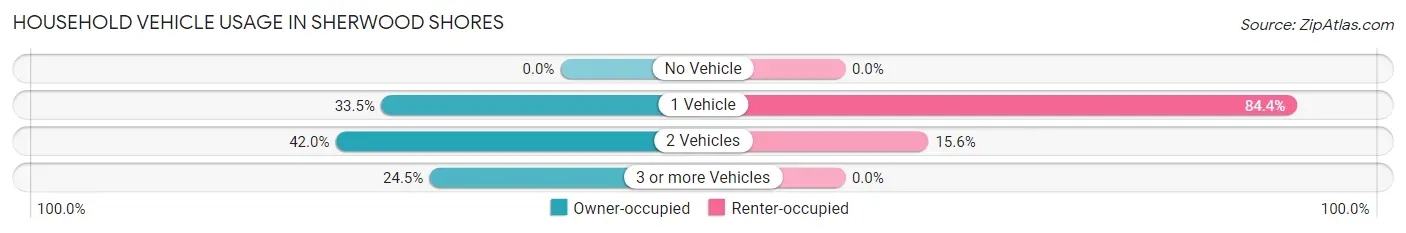
| Vehicles per Household | Owner-occupied | Renter-occupied |
| No Vehicle | 0 (0.0%) | 0 (0.0%) |
| 1 Vehicle | 130 (33.5%) | 92 (84.4%) |
| 2 Vehicles | 163 (42.0%) | 17 (15.6%) |
| 3 or more Vehicles | 95 (24.5%) | 0 (0.0%) |
| Total | 388 (100.0%) | 109 (100.0%) |
Real Estate & Mortgages in Sherwood Shores
Real Estate and Mortgage Overview in Sherwood Shores
| Characteristic | Without Mortgage | With Mortgage |
| Housing Units | 278 | 110 |
| Median Property Value | $81,000 | $207,900 |
| Median Household Income | $32,500 | $27 |
| Monthly Housing Costs | $327 | $0 |
| Real Estate Taxes | - | - |
Property Value by Mortgage Status in Sherwood Shores
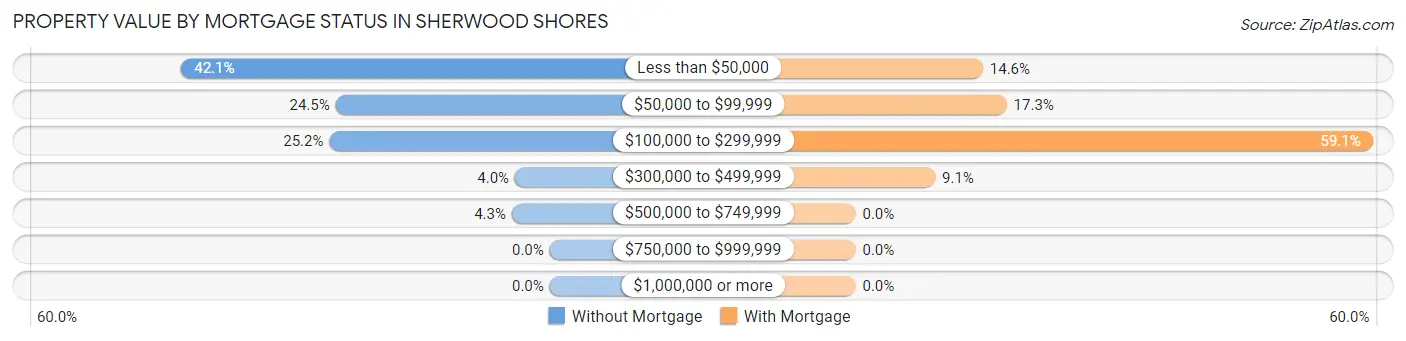
| Property Value | Without Mortgage | With Mortgage |
| Less than $50,000 | 117 (42.1%) | 16 (14.5%) |
| $50,000 to $99,999 | 68 (24.5%) | 19 (17.3%) |
| $100,000 to $299,999 | 70 (25.2%) | 65 (59.1%) |
| $300,000 to $499,999 | 11 (4.0%) | 10 (9.1%) |
| $500,000 to $749,999 | 12 (4.3%) | 0 (0.0%) |
| $750,000 to $999,999 | 0 (0.0%) | 0 (0.0%) |
| $1,000,000 or more | 0 (0.0%) | 0 (0.0%) |
| Total | 278 (100.0%) | 110 (100.0%) |
Household Income by Mortgage Status in Sherwood Shores
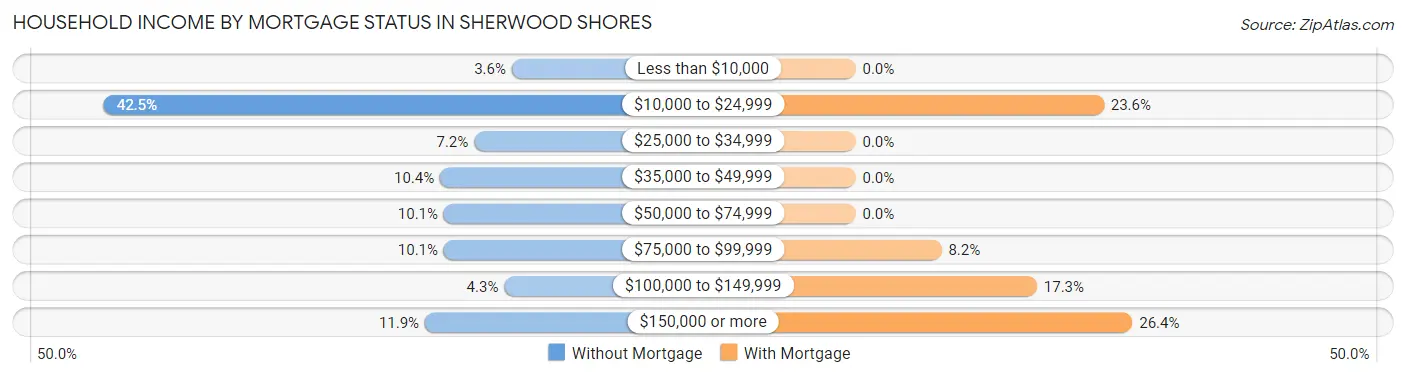
| Household Income | Without Mortgage | With Mortgage |
| Less than $10,000 | 10 (3.6%) | 0 (0.0%) |
| $10,000 to $24,999 | 118 (42.4%) | 26 (23.6%) |
| $25,000 to $34,999 | 20 (7.2%) | 0 (0.0%) |
| $35,000 to $49,999 | 29 (10.4%) | 0 (0.0%) |
| $50,000 to $74,999 | 28 (10.1%) | 0 (0.0%) |
| $75,000 to $99,999 | 28 (10.1%) | 9 (8.2%) |
| $100,000 to $149,999 | 12 (4.3%) | 19 (17.3%) |
| $150,000 or more | 33 (11.9%) | 29 (26.4%) |
| Total | 278 (100.0%) | 110 (100.0%) |
Property Value to Household Income Ratio in Sherwood Shores
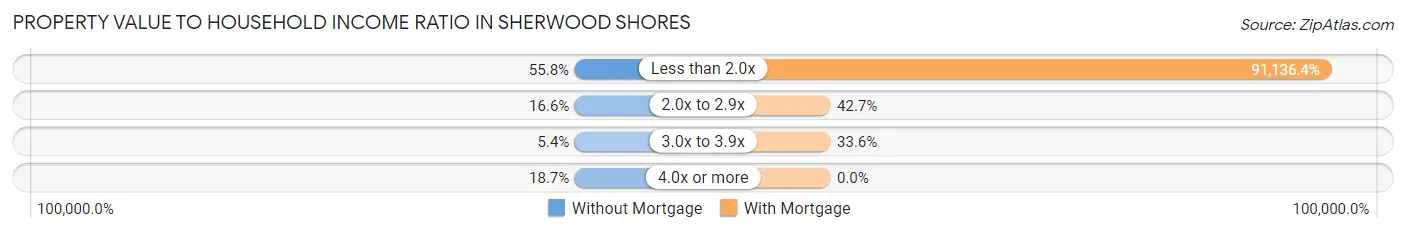
| Value-to-Income Ratio | Without Mortgage | With Mortgage |
| Less than 2.0x | 155 (55.8%) | 100,250 (91,136.4%) |
| 2.0x to 2.9x | 46 (16.6%) | 47 (42.7%) |
| 3.0x to 3.9x | 15 (5.4%) | 37 (33.6%) |
| 4.0x or more | 52 (18.7%) | 0 (0.0%) |
| Total | 278 (100.0%) | 110 (100.0%) |
Real Estate Taxes by Mortgage Status in Sherwood Shores
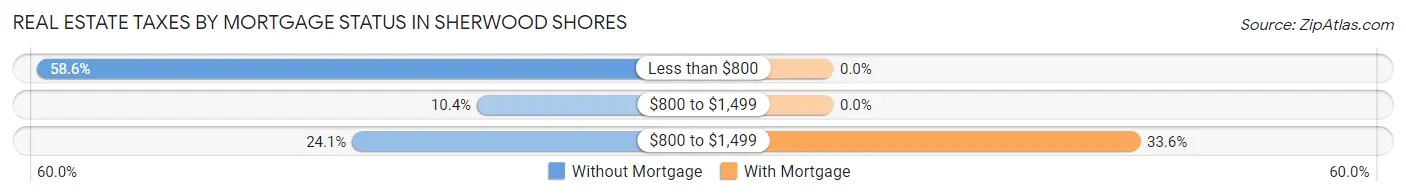
| Property Taxes | Without Mortgage | With Mortgage |
| Less than $800 | 163 (58.6%) | 0 (0.0%) |
| $800 to $1,499 | 29 (10.4%) | 0 (0.0%) |
| $800 to $1,499 | 67 (24.1%) | 37 (33.6%) |
| Total | 278 (100.0%) | 110 (100.0%) |
Health & Disability in Sherwood Shores
Health Insurance Coverage by Age in Sherwood Shores
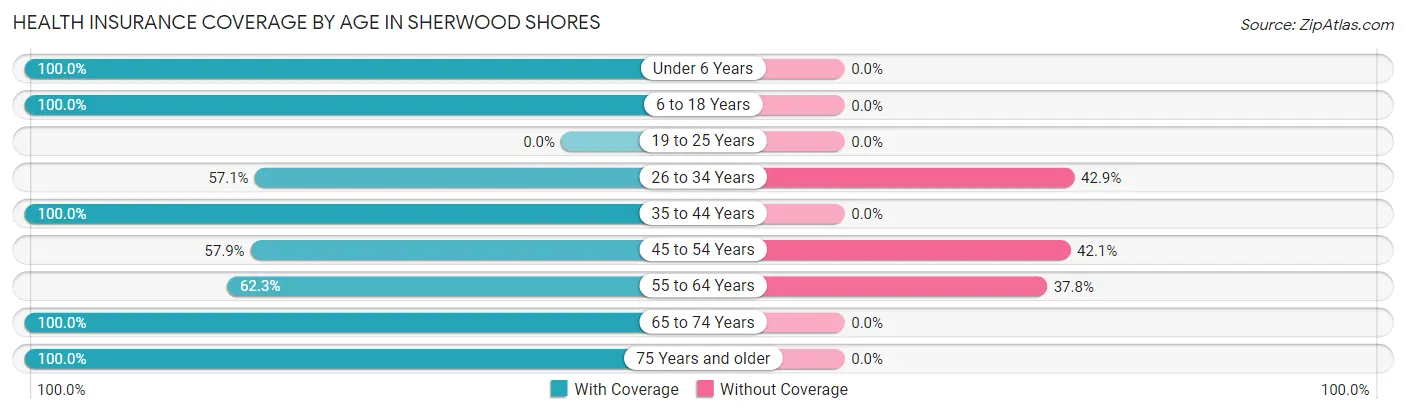
| Age Bracket | With Coverage | Without Coverage |
| Under 6 Years | 11 (100.0%) | 0 (0.0%) |
| 6 to 18 Years | 70 (100.0%) | 0 (0.0%) |
| 19 to 25 Years | 0 (0.0%) | 0 (0.0%) |
| 26 to 34 Years | 24 (57.1%) | 18 (42.9%) |
| 35 to 44 Years | 41 (100.0%) | 0 (0.0%) |
| 45 to 54 Years | 110 (57.9%) | 80 (42.1%) |
| 55 to 64 Years | 94 (62.3%) | 57 (37.8%) |
| 65 to 74 Years | 311 (100.0%) | 0 (0.0%) |
| 75 Years and older | 64 (100.0%) | 0 (0.0%) |
| Total | 725 (82.4%) | 155 (17.6%) |
Health Insurance Coverage by Citizenship Status in Sherwood Shores
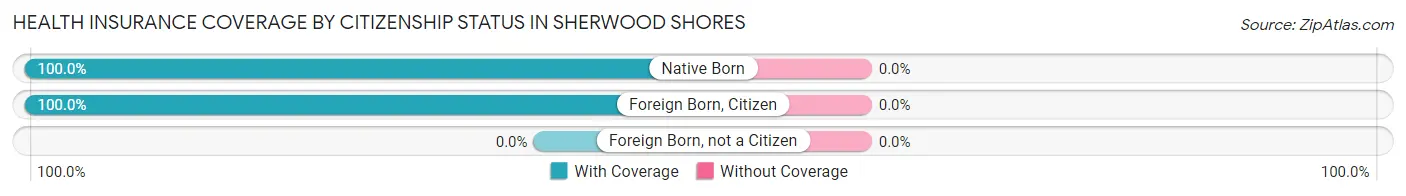
| Citizenship Status | With Coverage | Without Coverage |
| Native Born | 11 (100.0%) | 0 (0.0%) |
| Foreign Born, Citizen | 70 (100.0%) | 0 (0.0%) |
| Foreign Born, not a Citizen | 0 (0.0%) | 0 (0.0%) |
Health Insurance Coverage by Household Income in Sherwood Shores
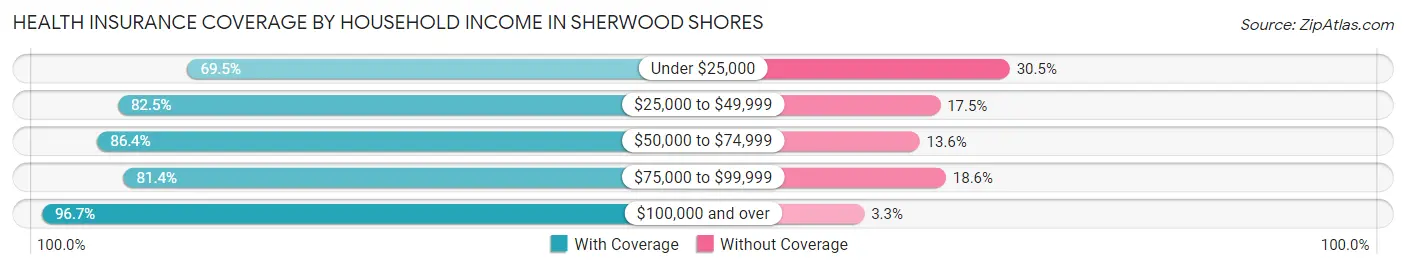
| Household Income | With Coverage | Without Coverage |
| Under $25,000 | 223 (69.5%) | 98 (30.5%) |
| $25,000 to $49,999 | 99 (82.5%) | 21 (17.5%) |
| $50,000 to $74,999 | 57 (86.4%) | 9 (13.6%) |
| $75,000 to $99,999 | 79 (81.4%) | 18 (18.6%) |
| $100,000 and over | 267 (96.7%) | 9 (3.3%) |
Public vs Private Health Insurance Coverage by Age in Sherwood Shores
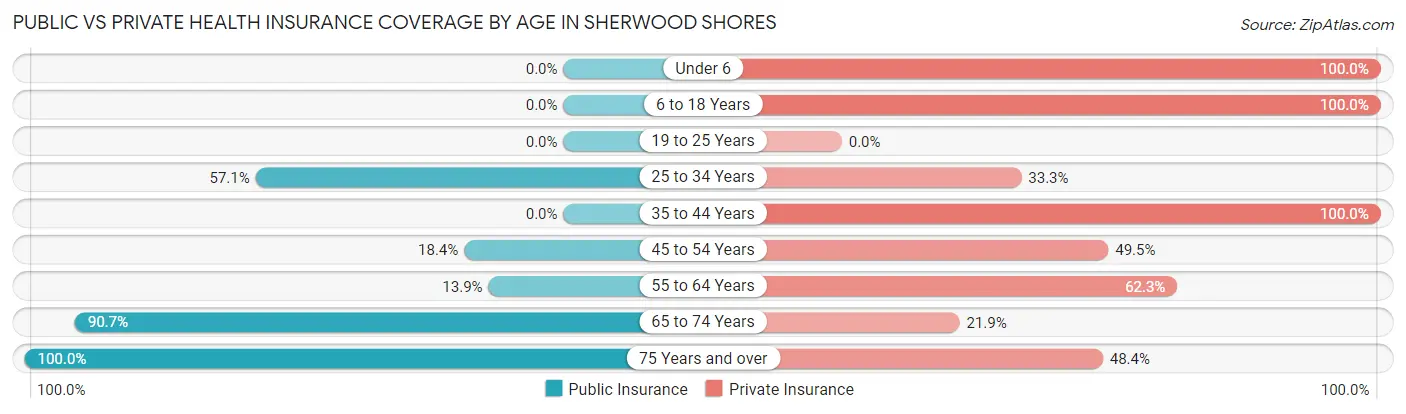
| Age Bracket | Public Insurance | Private Insurance |
| Under 6 | 0 (0.0%) | 11 (100.0%) |
| 6 to 18 Years | 0 (0.0%) | 70 (100.0%) |
| 19 to 25 Years | 0 (0.0%) | 0 (0.0%) |
| 25 to 34 Years | 24 (57.1%) | 14 (33.3%) |
| 35 to 44 Years | 0 (0.0%) | 41 (100.0%) |
| 45 to 54 Years | 35 (18.4%) | 94 (49.5%) |
| 55 to 64 Years | 21 (13.9%) | 94 (62.3%) |
| 65 to 74 Years | 282 (90.7%) | 68 (21.9%) |
| 75 Years and over | 64 (100.0%) | 31 (48.4%) |
| Total | 426 (48.4%) | 423 (48.1%) |
Disability Status by Sex by Age in Sherwood Shores
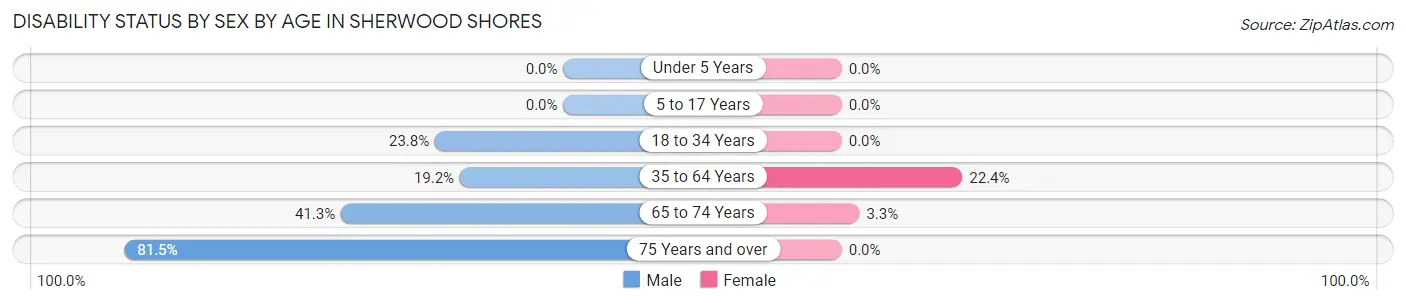
| Age Bracket | Male | Female |
| Under 5 Years | 0 (0.0%) | 0 (0.0%) |
| 5 to 17 Years | 0 (0.0%) | 0 (0.0%) |
| 18 to 34 Years | 10 (23.8%) | 0 (0.0%) |
| 35 to 64 Years | 33 (19.2%) | 47 (22.4%) |
| 65 to 74 Years | 78 (41.3%) | 4 (3.3%) |
| 75 Years and over | 44 (81.5%) | 0 (0.0%) |
Disability Class by Sex by Age in Sherwood Shores
Disability Class: Hearing Difficulty
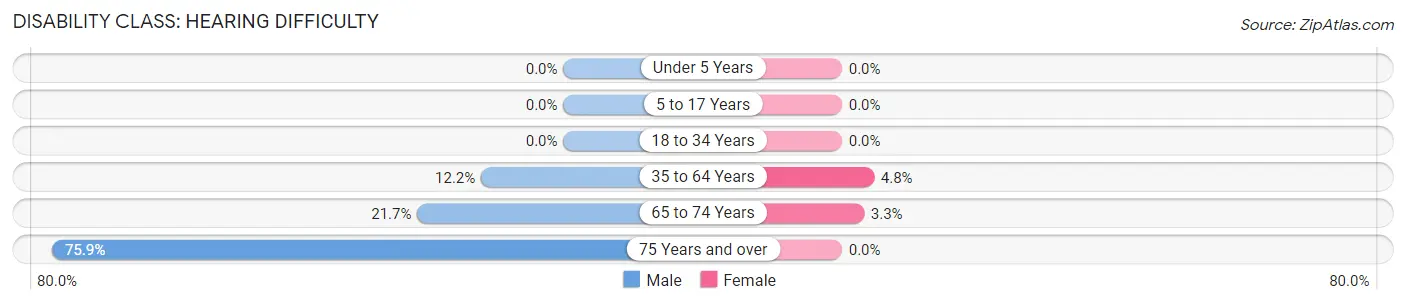
| Age Bracket | Male | Female |
| Under 5 Years | 0 (0.0%) | 0 (0.0%) |
| 5 to 17 Years | 0 (0.0%) | 0 (0.0%) |
| 18 to 34 Years | 0 (0.0%) | 0 (0.0%) |
| 35 to 64 Years | 21 (12.2%) | 10 (4.8%) |
| 65 to 74 Years | 41 (21.7%) | 4 (3.3%) |
| 75 Years and over | 41 (75.9%) | 0 (0.0%) |
Disability Class: Vision Difficulty
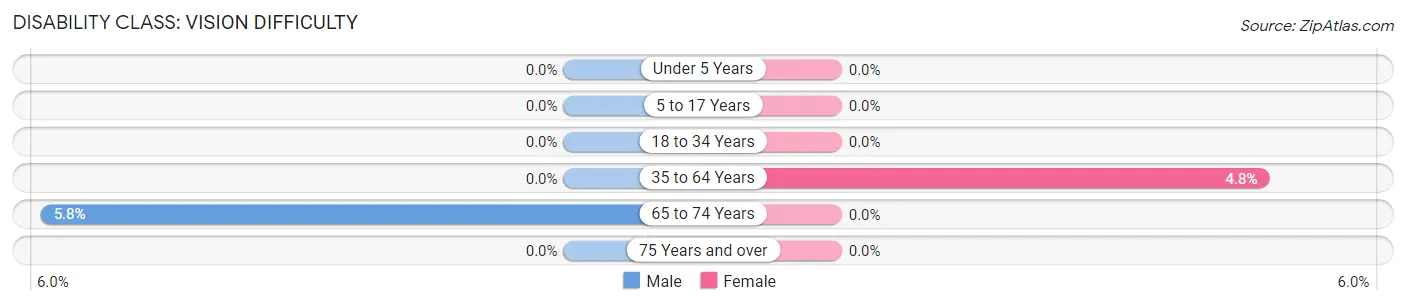
| Age Bracket | Male | Female |
| Under 5 Years | 0 (0.0%) | 0 (0.0%) |
| 5 to 17 Years | 0 (0.0%) | 0 (0.0%) |
| 18 to 34 Years | 0 (0.0%) | 0 (0.0%) |
| 35 to 64 Years | 0 (0.0%) | 10 (4.8%) |
| 65 to 74 Years | 11 (5.8%) | 0 (0.0%) |
| 75 Years and over | 0 (0.0%) | 0 (0.0%) |
Disability Class: Cognitive Difficulty
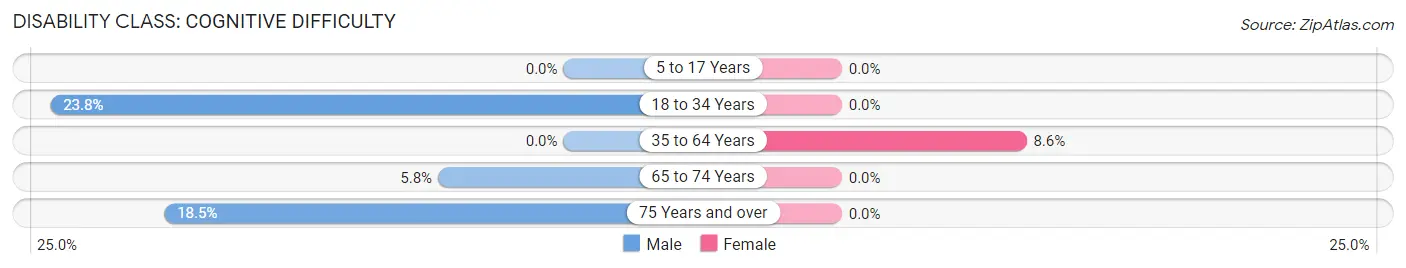
| Age Bracket | Male | Female |
| 5 to 17 Years | 0 (0.0%) | 0 (0.0%) |
| 18 to 34 Years | 10 (23.8%) | 0 (0.0%) |
| 35 to 64 Years | 0 (0.0%) | 18 (8.6%) |
| 65 to 74 Years | 11 (5.8%) | 0 (0.0%) |
| 75 Years and over | 10 (18.5%) | 0 (0.0%) |
Disability Class: Ambulatory Difficulty
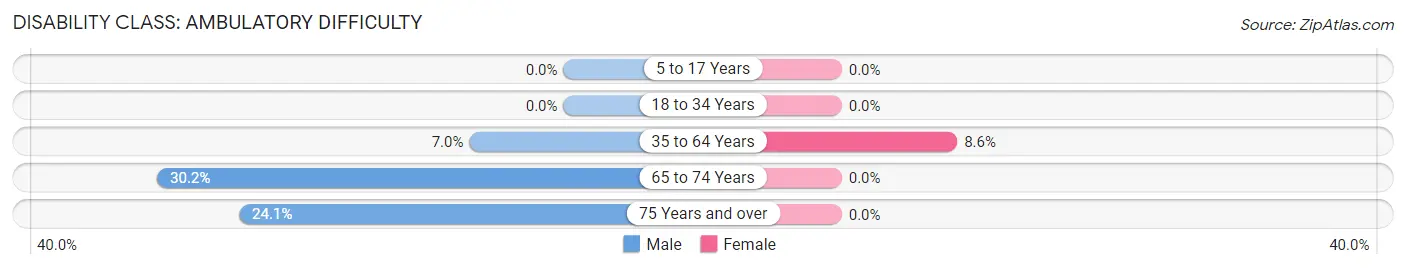
| Age Bracket | Male | Female |
| 5 to 17 Years | 0 (0.0%) | 0 (0.0%) |
| 18 to 34 Years | 0 (0.0%) | 0 (0.0%) |
| 35 to 64 Years | 12 (7.0%) | 18 (8.6%) |
| 65 to 74 Years | 57 (30.2%) | 0 (0.0%) |
| 75 Years and over | 13 (24.1%) | 0 (0.0%) |
Disability Class: Self-Care Difficulty
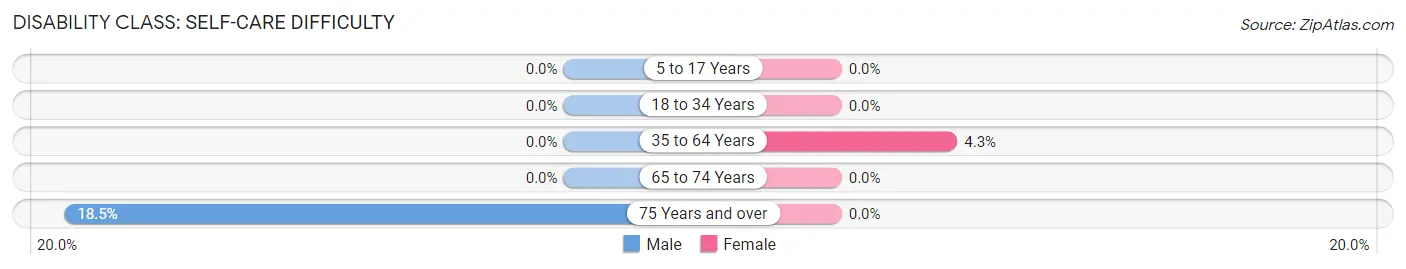
| Age Bracket | Male | Female |
| 5 to 17 Years | 0 (0.0%) | 0 (0.0%) |
| 18 to 34 Years | 0 (0.0%) | 0 (0.0%) |
| 35 to 64 Years | 0 (0.0%) | 9 (4.3%) |
| 65 to 74 Years | 0 (0.0%) | 0 (0.0%) |
| 75 Years and over | 10 (18.5%) | 0 (0.0%) |
Technology Access in Sherwood Shores
Computing Device Access in Sherwood Shores
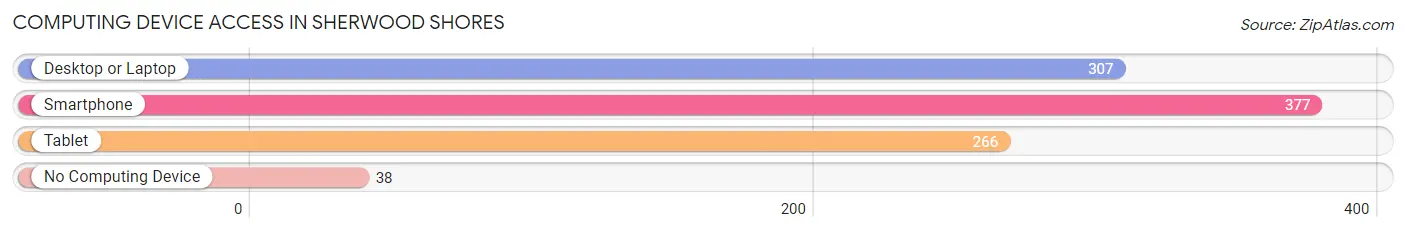
| Device Type | # Households | % Households |
| Desktop or Laptop | 307 | 61.8% |
| Smartphone | 377 | 75.9% |
| Tablet | 266 | 53.5% |
| No Computing Device | 38 | 7.6% |
| Total | 497 | 100.0% |
Internet Access in Sherwood Shores
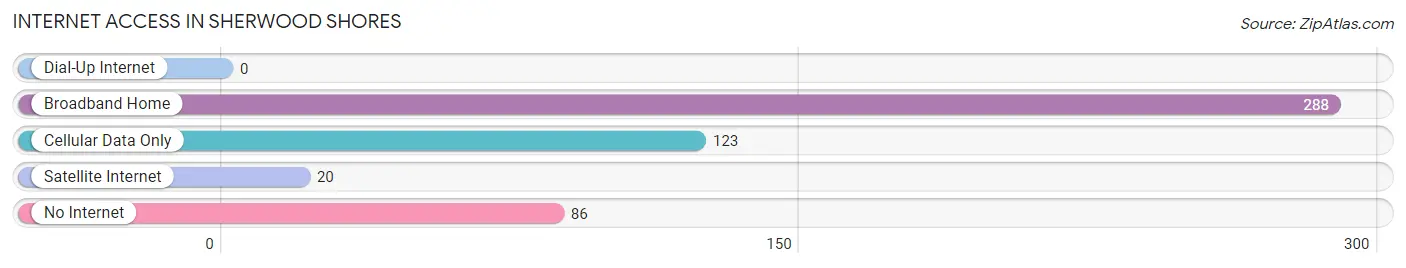
| Internet Type | # Households | % Households |
| Dial-Up Internet | 0 | 0.0% |
| Broadband Home | 288 | 58.0% |
| Cellular Data Only | 123 | 24.7% |
| Satellite Internet | 20 | 4.0% |
| No Internet | 86 | 17.3% |
| Total | 497 | 100.0% |
Sherwood Shores Summary
Sherwood Shores, TX is a small town located in Grayson County, Texas. It is situated on the shores of Lake Texoma, a large reservoir on the Red River. The town was founded in the late 1800s and has a population of approximately 1,500 people.
Geography
Sherwood Shores is located in the northeast corner of Grayson County, Texas. It is situated on the shores of Lake Texoma, a large reservoir on the Red River. The town is surrounded by rolling hills and is located about 25 miles north of Sherman, Texas. The terrain is mostly flat with some hills and valleys. The climate is humid subtropical with hot summers and mild winters.
Economy
The economy of Sherwood Shores is largely based on tourism. The town is a popular destination for fishing, boating, and other outdoor activities. There are several marinas and boat ramps located in the area. The town also has a few restaurants, bars, and shops. The town is also home to a few small businesses, such as a grocery store, a hardware store, and a gas station.
Demographics
As of the 2010 census, the population of Sherwood Shores was 1,500. The racial makeup of the town was 94.2% White, 0.7% African American, 0.3% Native American, 0.7% Asian, 0.1% Pacific Islander, and 3.9% from other races. The median household income was $41,250 and the median family income was $45,000.
History
Sherwood Shores was founded in the late 1800s by a group of settlers from the nearby town of Sherman. The town was originally called “Sherwood” after the nearby town of Sherman. The name was later changed to “Sherwood Shores” to reflect its location on the shores of Lake Texoma. The town was incorporated in the early 1900s and has remained a small, rural community ever since.
The town has seen some growth in recent years due to its proximity to Lake Texoma and the increasing popularity of outdoor activities in the area. The town is also home to a few small businesses and is a popular destination for fishing, boating, and other outdoor activities.
Conclusion
Sherwood Shores, TX is a small town located in Grayson County, Texas. It is situated on the shores of Lake Texoma, a large reservoir on the Red River. The town was founded in the late 1800s and has a population of approximately 1,500 people. The economy of the town is largely based on tourism and outdoor activities. The town is also home to a few small businesses. The racial makeup of the town is 94.2% White, 0.7% African American, 0.3% Native American, 0.7% Asian, 0.1% Pacific Islander, and 3.9% from other races. The median household income was $41,250 and the median family income was $45,000. Sherwood Shores is a small, rural community that has seen some growth in recent years due to its proximity to Lake Texoma and the increasing popularity of outdoor activities in the area.
Common Questions
What is the Total Population of Sherwood Shores?
Total Population of Sherwood Shores is 880.
What is the Total Male Population of Sherwood Shores?
Total Male Population of Sherwood Shores is 487.
What is the Total Female Population of Sherwood Shores?
Total Female Population of Sherwood Shores is 393.
What is the Ratio of Males per 100 Females in Sherwood Shores?
There are 123.92 Males per 100 Females in Sherwood Shores.
What is the Ratio of Females per 100 Males in Sherwood Shores?
There are 80.70 Females per 100 Males in Sherwood Shores.
What is the Median Population Age in Sherwood Shores?
Median Population Age in Sherwood Shores is 61.7 Years.
What is the Average Family Size in Sherwood Shores
Average Family Size in Sherwood Shores is 2.4 People.
What is the Average Household Size in Sherwood Shores
Average Household Size in Sherwood Shores is 1.8 People.
What is Per Capita Income in Sherwood Shores?
Per Capita income in Sherwood Shores is $37,232.
What is the Median Family Income in Sherwood Shores?
Median Family Income in Sherwood Shores is $65,938.
What is the Median Household income in Sherwood Shores?
Median Household Income in Sherwood Shores is $31,250.
What is Income or Wage Gap in Sherwood Shores?
Income or Wage Gap in Sherwood Shores is 12.2%.
Women in Sherwood Shores earn 87.8 cents for every dollar earned by a man.
What is Inequality or Gini Index in Sherwood Shores?
Inequality or Gini Index in Sherwood Shores is 0.55.
How Large is the Labor Force in Sherwood Shores?
There are 376 People in the Labor Forcein in Sherwood Shores.
What is the Percentage of People in the Labor Force in Sherwood Shores?
45.6% of People are in the Labor Force in Sherwood Shores.