Cities with the Highest Percentage of Population with a Degree in Visual and Performing Arts in North Carolina
RELATED REPORTS & OPTIONS
Visual and Performing Arts
North Carolina
Compare Cities
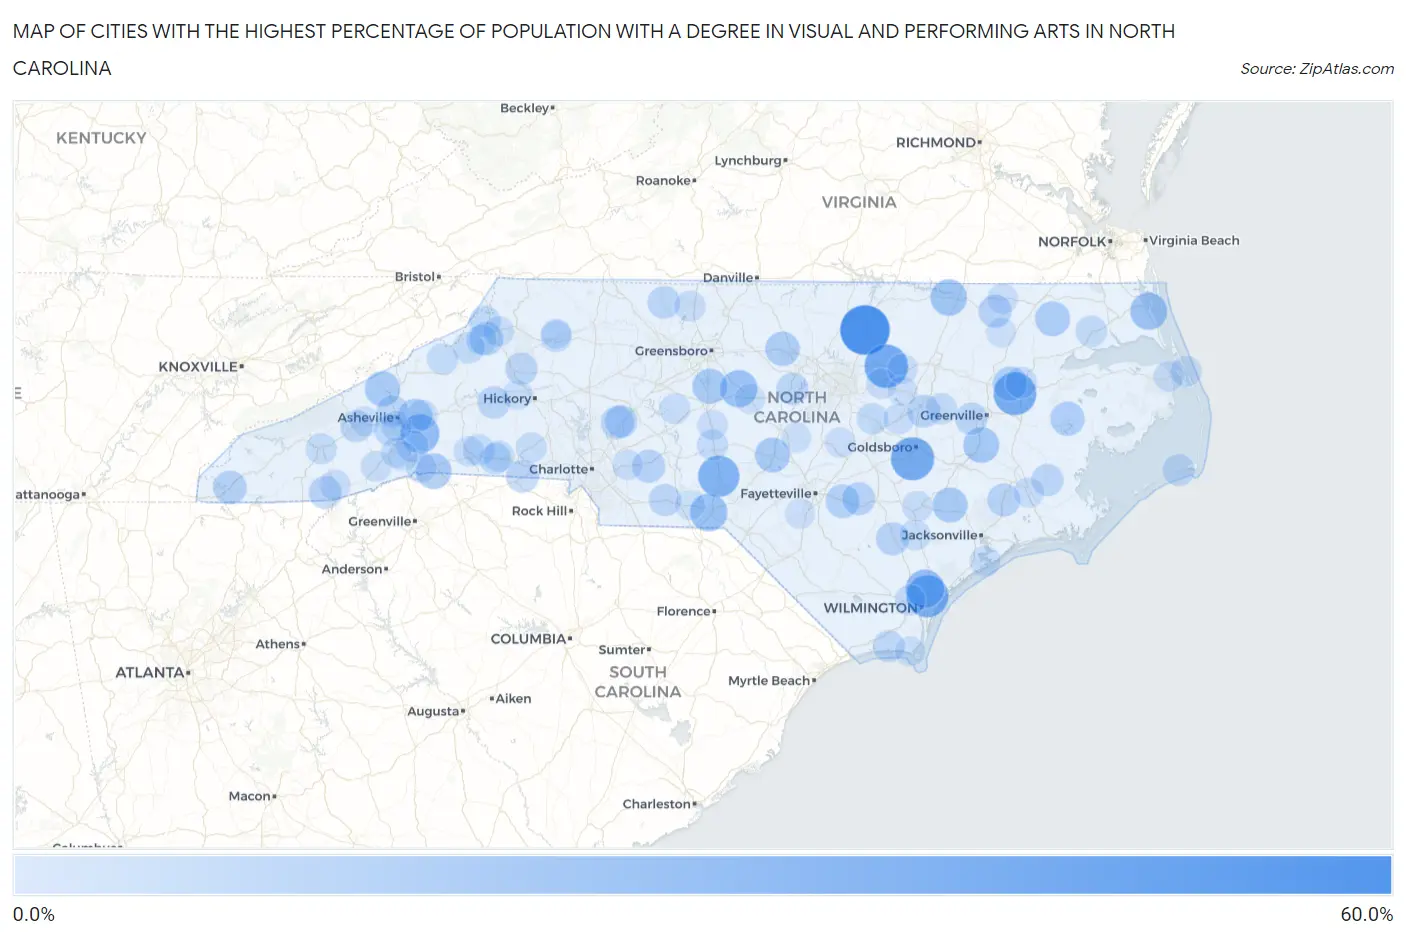
Map of Cities with the Highest Percentage of Population with a Degree in Visual and Performing Arts in North Carolina
0.0%
60.0%
Cities with the Highest Percentage of Population with a Degree in Visual and Performing Arts in North Carolina
| City | % Graduates | vs State | vs National | |
| 1. | Kittrell | 56.2% | 3.6%(+52.6)#1 | 4.3%(+52.0)#93 |
| 2. | Bunn | 40.6% | 3.6%(+37.0)#2 | 4.3%(+36.4)#172 |
| 3. | Brogden | 39.8% | 3.6%(+36.1)#3 | 4.3%(+35.5)#177 |
| 4. | Bear Grass | 38.9% | 3.6%(+35.3)#4 | 4.3%(+34.6)#183 |
| 5. | Blue Clay Farms | 36.8% | 3.6%(+33.2)#5 | 4.3%(+32.6)#208 |
| 6. | Norman | 34.8% | 3.6%(+31.2)#6 | 4.3%(+30.5)#231 |
| 7. | Gerton | 28.4% | 3.6%(+24.8)#7 | 4.3%(+24.2)#349 |
| 8. | Castle Hayne | 27.7% | 3.6%(+24.1)#8 | 4.3%(+23.4)#362 |
| 9. | Cordova | 25.4% | 3.6%(+21.8)#9 | 4.3%(+21.1)#408 |
| 10. | Staley | 25.0% | 3.6%(+21.4)#10 | 4.3%(+20.7)#420 |
| 11. | Coinjock | 24.1% | 3.6%(+20.5)#11 | 4.3%(+19.8)#462 |
| 12. | South Rosemary | 23.1% | 3.6%(+19.4)#12 | 4.3%(+18.8)#488 |
| 13. | Grifton | 21.1% | 3.6%(+17.5)#13 | 4.3%(+16.8)#569 |
| 14. | Tryon | 20.7% | 3.6%(+17.0)#14 | 4.3%(+16.4)#591 |
| 15. | Glenwood | 20.1% | 3.6%(+16.5)#15 | 4.3%(+15.9)#618 |
| 16. | Randleman | 19.5% | 3.6%(+15.9)#16 | 4.3%(+15.3)#667 |
| 17. | Marshall | 19.5% | 3.6%(+15.9)#17 | 4.3%(+15.3)#668 |
| 18. | Cameron | 19.2% | 3.6%(+15.6)#18 | 4.3%(+15.0)#686 |
| 19. | Potters Hill | 19.1% | 3.6%(+15.5)#19 | 4.3%(+14.9)#695 |
| 20. | Harrellsville | 18.8% | 3.6%(+15.1)#20 | 4.3%(+14.5)#730 |
| 21. | Swannanoa | 18.5% | 3.6%(+14.9)#21 | 4.3%(+14.2)#745 |
| 22. | Efland | 17.7% | 3.6%(+14.1)#22 | 4.3%(+13.5)#796 |
| 23. | Everetts | 17.6% | 3.6%(+14.0)#23 | 4.3%(+13.4)#806 |
| 24. | Pantego | 17.2% | 3.6%(+13.6)#24 | 4.3%(+13.0)#833 |
| 25. | Autryville | 16.0% | 3.6%(+12.4)#25 | 4.3%(+11.7)#954 |
| 26. | Foscoe | 15.9% | 3.6%(+12.3)#26 | 4.3%(+11.6)#962 |
| 27. | Murphy | 15.5% | 3.6%(+11.9)#27 | 4.3%(+11.3)#1,007 |
| 28. | Oakboro | 14.8% | 3.6%(+11.2)#28 | 4.3%(+10.5)#1,088 |
| 29. | Harrells | 14.7% | 3.6%(+11.1)#29 | 4.3%(+10.5)#1,097 |
| 30. | Landis | 14.6% | 3.6%(+11.0)#30 | 4.3%(+10.3)#1,111 |
| 31. | Pollocksville | 14.3% | 3.6%(+10.7)#31 | 4.3%(+10.0)#1,153 |
| 32. | Salemburg | 14.3% | 3.6%(+10.7)#32 | 4.3%(+10.0)#1,155 |
| 33. | Lasker | 14.3% | 3.6%(+10.7)#33 | 4.3%(+10.0)#1,161 |
| 34. | Black Creek | 14.0% | 3.6%(+10.3)#34 | 4.3%(+9.70)#1,200 |
| 35. | Grover | 13.7% | 3.6%(+10.1)#35 | 4.3%(+9.47)#1,236 |
| 36. | Highlands | 13.4% | 3.6%(+9.81)#36 | 4.3%(+9.18)#1,276 |
| 37. | China Grove | 13.4% | 3.6%(+9.75)#37 | 4.3%(+9.12)#1,283 |
| 38. | Danbury | 13.3% | 3.6%(+9.71)#38 | 4.3%(+9.08)#1,294 |
| 39. | Salem | 13.0% | 3.6%(+9.33)#39 | 4.3%(+8.70)#1,350 |
| 40. | Polkton | 12.5% | 3.6%(+8.88)#40 | 4.3%(+8.25)#1,409 |
| 41. | Cedar Rock | 12.5% | 3.6%(+8.88)#41 | 4.3%(+8.25)#1,418 |
| 42. | Clyde | 12.4% | 3.6%(+8.78)#42 | 4.3%(+8.14)#1,442 |
| 43. | Grantsboro | 12.3% | 3.6%(+8.69)#43 | 4.3%(+8.06)#1,456 |
| 44. | Fearrington Village | 12.3% | 3.6%(+8.66)#44 | 4.3%(+8.03)#1,461 |
| 45. | Bell Arthur | 12.2% | 3.6%(+8.58)#45 | 4.3%(+7.94)#1,483 |
| 46. | Woodfin | 11.9% | 3.6%(+8.24)#46 | 4.3%(+7.60)#1,552 |
| 47. | Hatteras | 11.7% | 3.6%(+8.09)#47 | 4.3%(+7.46)#1,587 |
| 48. | Fruitland | 11.6% | 3.6%(+8.00)#48 | 4.3%(+7.37)#1,606 |
| 49. | Varnamtown | 11.6% | 3.6%(+7.95)#49 | 4.3%(+7.32)#1,615 |
| 50. | Bent Creek | 11.4% | 3.6%(+7.82)#50 | 4.3%(+7.18)#1,634 |
| 51. | Newland | 10.9% | 3.6%(+7.25)#51 | 4.3%(+6.62)#1,781 |
| 52. | Bostic | 10.9% | 3.6%(+7.25)#52 | 4.3%(+6.62)#1,785 |
| 53. | Cove Creek | 10.8% | 3.6%(+7.19)#53 | 4.3%(+6.55)#1,802 |
| 54. | Winfall | 10.8% | 3.6%(+7.15)#54 | 4.3%(+6.52)#1,809 |
| 55. | Williamston | 10.7% | 3.6%(+7.05)#55 | 4.3%(+6.41)#1,849 |
| 56. | Wilson S Mills | 10.6% | 3.6%(+6.95)#56 | 4.3%(+6.32)#1,879 |
| 57. | Mooresboro | 10.5% | 3.6%(+6.91)#57 | 4.3%(+6.27)#1,898 |
| 58. | North Wilkesboro | 10.4% | 3.6%(+6.80)#58 | 4.3%(+6.17)#1,923 |
| 59. | Saratoga | 10.1% | 3.6%(+6.53)#59 | 4.3%(+5.89)#2,017 |
| 60. | Bakersville | 10.0% | 3.6%(+6.38)#60 | 4.3%(+5.75)#2,057 |
| 61. | Lattimore | 10.0% | 3.6%(+6.38)#61 | 4.3%(+5.75)#2,059 |
| 62. | Star | 9.8% | 3.6%(+6.23)#62 | 4.3%(+5.60)#2,119 |
| 63. | Sylva | 9.8% | 3.6%(+6.14)#63 | 4.3%(+5.50)#2,146 |
| 64. | Navassa | 9.3% | 3.6%(+5.71)#64 | 4.3%(+5.08)#2,308 |
| 65. | Cashiers | 9.2% | 3.6%(+5.62)#65 | 4.3%(+4.99)#2,343 |
| 66. | Madison | 9.1% | 3.6%(+5.50)#66 | 4.3%(+4.86)#2,387 |
| 67. | Brevard | 9.1% | 3.6%(+5.46)#67 | 4.3%(+4.83)#2,431 |
| 68. | Kenly | 9.0% | 3.6%(+5.42)#68 | 4.3%(+4.79)#2,442 |
| 69. | Wallace | 9.0% | 3.6%(+5.35)#69 | 4.3%(+4.72)#2,472 |
| 70. | Denton | 9.0% | 3.6%(+5.34)#70 | 4.3%(+4.70)#2,480 |
| 71. | Nags Head | 8.9% | 3.6%(+5.26)#71 | 4.3%(+4.62)#2,519 |
| 72. | Sneads Ferry | 8.8% | 3.6%(+5.20)#72 | 4.3%(+4.57)#2,536 |
| 73. | Kenansville | 8.8% | 3.6%(+5.17)#73 | 4.3%(+4.54)#2,558 |
| 74. | Asheville | 8.7% | 3.6%(+5.10)#74 | 4.3%(+4.47)#2,586 |
| 75. | Black Mountain | 8.6% | 3.6%(+4.96)#75 | 4.3%(+4.33)#2,654 |
| 76. | Horse Shoe | 8.6% | 3.6%(+4.96)#76 | 4.3%(+4.33)#2,655 |
| 77. | Cherryville | 8.6% | 3.6%(+4.94)#77 | 4.3%(+4.30)#2,669 |
| 78. | Conway | 8.5% | 3.6%(+4.86)#78 | 4.3%(+4.22)#2,705 |
| 79. | Saluda | 8.5% | 3.6%(+4.86)#79 | 4.3%(+4.22)#2,707 |
| 80. | Boone | 8.5% | 3.6%(+4.84)#80 | 4.3%(+4.21)#2,712 |
| 81. | Zebulon | 8.5% | 3.6%(+4.84)#81 | 4.3%(+4.20)#2,721 |
| 82. | Seven Devils | 8.4% | 3.6%(+4.81)#82 | 4.3%(+4.18)#2,729 |
| 83. | James City | 8.3% | 3.6%(+4.67)#83 | 4.3%(+4.03)#2,821 |
| 84. | Spindale | 8.3% | 3.6%(+4.66)#84 | 4.3%(+4.03)#2,824 |
| 85. | Manns Harbor | 8.2% | 3.6%(+4.60)#85 | 4.3%(+3.97)#2,860 |
| 86. | Coats | 8.2% | 3.6%(+4.60)#86 | 4.3%(+3.96)#2,863 |
| 87. | Seagrove | 8.1% | 3.6%(+4.49)#87 | 4.3%(+3.86)#2,911 |
| 88. | Midland | 8.0% | 3.6%(+4.41)#88 | 4.3%(+3.77)#2,948 |
| 89. | Spring Hope | 8.0% | 3.6%(+4.35)#89 | 4.3%(+3.72)#2,989 |
| 90. | Laurel Park | 7.7% | 3.6%(+4.06)#90 | 4.3%(+3.42)#3,184 |
| 91. | Caswell Beach | 7.6% | 3.6%(+4.01)#91 | 4.3%(+3.38)#3,208 |
| 92. | Broadway | 7.6% | 3.6%(+4.00)#92 | 4.3%(+3.36)#3,217 |
| 93. | Lilesville | 7.6% | 3.6%(+3.99)#93 | 4.3%(+3.36)#3,224 |
| 94. | Siler City | 7.6% | 3.6%(+3.97)#94 | 4.3%(+3.34)#3,241 |
| 95. | Canton | 7.6% | 3.6%(+3.93)#95 | 4.3%(+3.30)#3,261 |
| 96. | Connelly Springs | 7.4% | 3.6%(+3.83)#96 | 4.3%(+3.19)#3,323 |
| 97. | Fairplains | 7.4% | 3.6%(+3.81)#97 | 4.3%(+3.18)#3,331 |
| 98. | Bailey | 7.4% | 3.6%(+3.79)#98 | 4.3%(+3.16)#3,357 |
| 99. | Parkton | 7.3% | 3.6%(+3.70)#99 | 4.3%(+3.06)#3,432 |
| 100. | Roxobel | 7.3% | 3.6%(+3.65)#100 | 4.3%(+3.02)#3,472 |
Common Questions
What are the Top 10 Cities with the Highest Percentage of Population with a Degree in Visual and Performing Arts in North Carolina?
Top 10 Cities with the Highest Percentage of Population with a Degree in Visual and Performing Arts in North Carolina are:
#1
56.2%
#2
40.6%
#3
39.8%
#4
38.9%
#5
36.8%
#6
34.8%
#7
28.4%
#8
27.7%
#9
25.4%
#10
25.0%
What city has the Highest Percentage of Population with a Degree in Visual and Performing Arts in North Carolina?
Kittrell has the Highest Percentage of Population with a Degree in Visual and Performing Arts in North Carolina with 56.2%.
What is the Percentage of Population with a Degree in Visual and Performing Arts in the State of North Carolina?
Percentage of Population with a Degree in Visual and Performing Arts in North Carolina is 3.6%.
What is the Percentage of Population with a Degree in Visual and Performing Arts in the United States?
Percentage of Population with a Degree in Visual and Performing Arts in the United States is 4.3%.