Zip Codes with the Highest Percentage of Population with a Degree in Visual and Performing Arts in Fort Worth, TX
RELATED REPORTS & OPTIONS
Visual and Performing Arts
Fort Worth
Compare Zip Codes
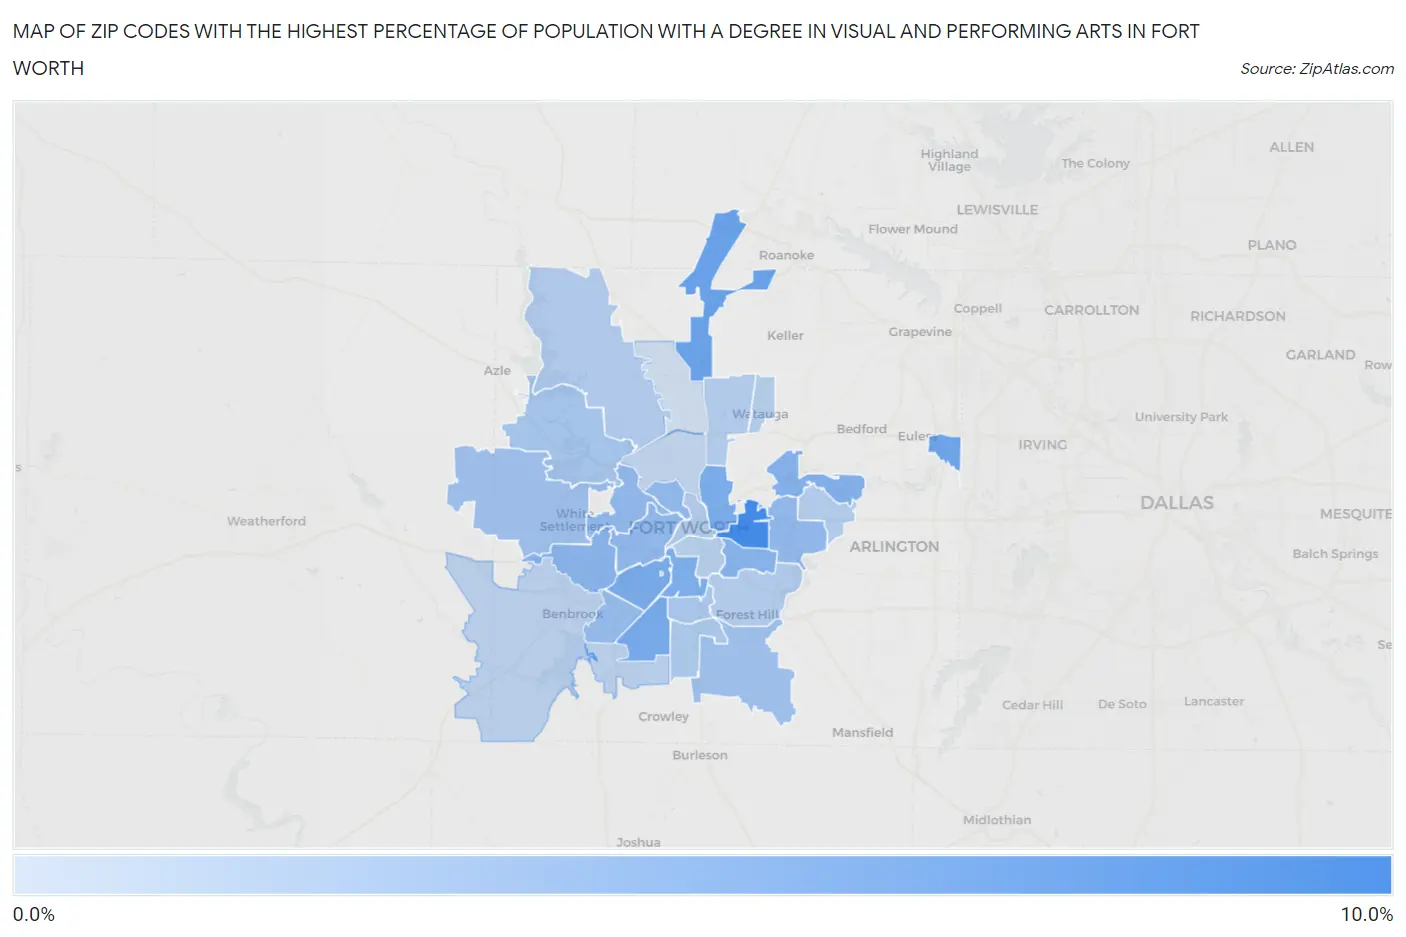
Map of Zip Codes with the Highest Percentage of Population with a Degree in Visual and Performing Arts in Fort Worth
0.0%
10.0%
Zip Codes with the Highest Percentage of Population with a Degree in Visual and Performing Arts in Fort Worth, TX
| Zip Code | % Graduates | vs State | vs National | |
| 1. | 76103 | 8.6% | 3.2%(+5.35)#87 | 4.3%(+4.31)#2,489 |
| 2. | 76177 | 6.2% | 3.2%(+3.01)#182 | 4.3%(+1.97)#4,570 |
| 3. | 76155 | 6.1% | 3.2%(+2.85)#199 | 4.3%(+1.80)#4,800 |
| 4. | 76133 | 5.5% | 3.2%(+2.34)#229 | 4.3%(+1.30)#5,600 |
| 5. | 76109 | 5.4% | 3.2%(+2.17)#242 | 4.3%(+1.13)#5,898 |
| 6. | 76111 | 5.3% | 3.2%(+2.09)#250 | 4.3%(+1.05)#6,051 |
| 7. | 76110 | 5.1% | 3.2%(+1.92)#267 | 4.3%(+0.881)#6,359 |
| 8. | 76118 | 4.8% | 3.2%(+1.56)#298 | 4.3%(+0.514)#7,139 |
| 9. | 76105 | 4.6% | 3.2%(+1.42)#316 | 4.3%(+0.381)#7,463 |
| 10. | 76116 | 4.6% | 3.2%(+1.36)#325 | 4.3%(+0.313)#7,635 |
| 11. | 76114 | 4.2% | 3.2%(+1.04)#366 | 4.3%(-0.003)#8,491 |
| 12. | 76107 | 4.2% | 3.2%(+1.02)#371 | 4.3%(-0.024)#8,543 |
| 13. | 76164 | 4.1% | 3.2%(+0.912)#397 | 4.3%(-0.131)#8,865 |
| 14. | 76112 | 4.0% | 3.2%(+0.831)#410 | 4.3%(-0.212)#9,128 |
| 15. | 76132 | 3.7% | 3.2%(+0.475)#460 | 4.3%(-0.568)#10,221 |
| 16. | 76108 | 3.4% | 3.2%(+0.192)#508 | 4.3%(-0.851)#11,254 |
| 17. | 76140 | 3.3% | 3.2%(+0.133)#520 | 4.3%(-0.910)#11,448 |
| 18. | 76135 | 3.0% | 3.2%(-0.241)#622 | 4.3%(-1.28)#12,849 |
| 19. | 76115 | 2.8% | 3.2%(-0.370)#648 | 4.3%(-1.41)#13,333 |
| 20. | 76134 | 2.6% | 3.2%(-0.654)#705 | 4.3%(-1.70)#14,424 |
| 21. | 76179 | 2.4% | 3.2%(-0.817)#749 | 4.3%(-1.86)#15,034 |
| 22. | 76102 | 2.3% | 3.2%(-0.875)#770 | 4.3%(-1.92)#15,228 |
| 23. | 76137 | 2.3% | 3.2%(-0.952)#792 | 4.3%(-1.99)#15,513 |
| 24. | 76120 | 2.2% | 3.2%(-0.996)#803 | 4.3%(-2.04)#15,659 |
| 25. | 76119 | 2.2% | 3.2%(-1.00)#808 | 4.3%(-2.05)#15,685 |
| 26. | 76148 | 2.1% | 3.2%(-1.08)#826 | 4.3%(-2.12)#15,949 |
| 27. | 76104 | 2.1% | 3.2%(-1.11)#836 | 4.3%(-2.15)#16,065 |
| 28. | 76123 | 1.8% | 3.2%(-1.39)#917 | 4.3%(-2.43)#17,068 |
| 29. | 76126 | 1.8% | 3.2%(-1.39)#919 | 4.3%(-2.43)#17,091 |
| 30. | 76106 | 1.5% | 3.2%(-1.66)#983 | 4.3%(-2.71)#18,022 |
| 31. | 76131 | 0.84% | 3.2%(-2.37)#1,137 | 4.3%(-3.42)#20,077 |
1
Common Questions
What are the Top 10 Zip Codes with the Highest Percentage of Population with a Degree in Visual and Performing Arts in Fort Worth, TX?
Top 10 Zip Codes with the Highest Percentage of Population with a Degree in Visual and Performing Arts in Fort Worth, TX are:
What zip code has the Highest Percentage of Population with a Degree in Visual and Performing Arts in Fort Worth, TX?
76103 has the Highest Percentage of Population with a Degree in Visual and Performing Arts in Fort Worth, TX with 8.6%.
What is the Percentage of Population with a Degree in Visual and Performing Arts in Fort Worth, TX?
Percentage of Population with a Degree in Visual and Performing Arts in Fort Worth is 3.5%.
What is the Percentage of Population with a Degree in Visual and Performing Arts in Texas?
Percentage of Population with a Degree in Visual and Performing Arts in Texas is 3.2%.
What is the Percentage of Population with a Degree in Visual and Performing Arts in the United States?
Percentage of Population with a Degree in Visual and Performing Arts in the United States is 4.3%.