Cities with the Most Immigrants from Morocco in Texas
RELATED REPORTS & OPTIONS
Morocco
Texas
Compare Cities
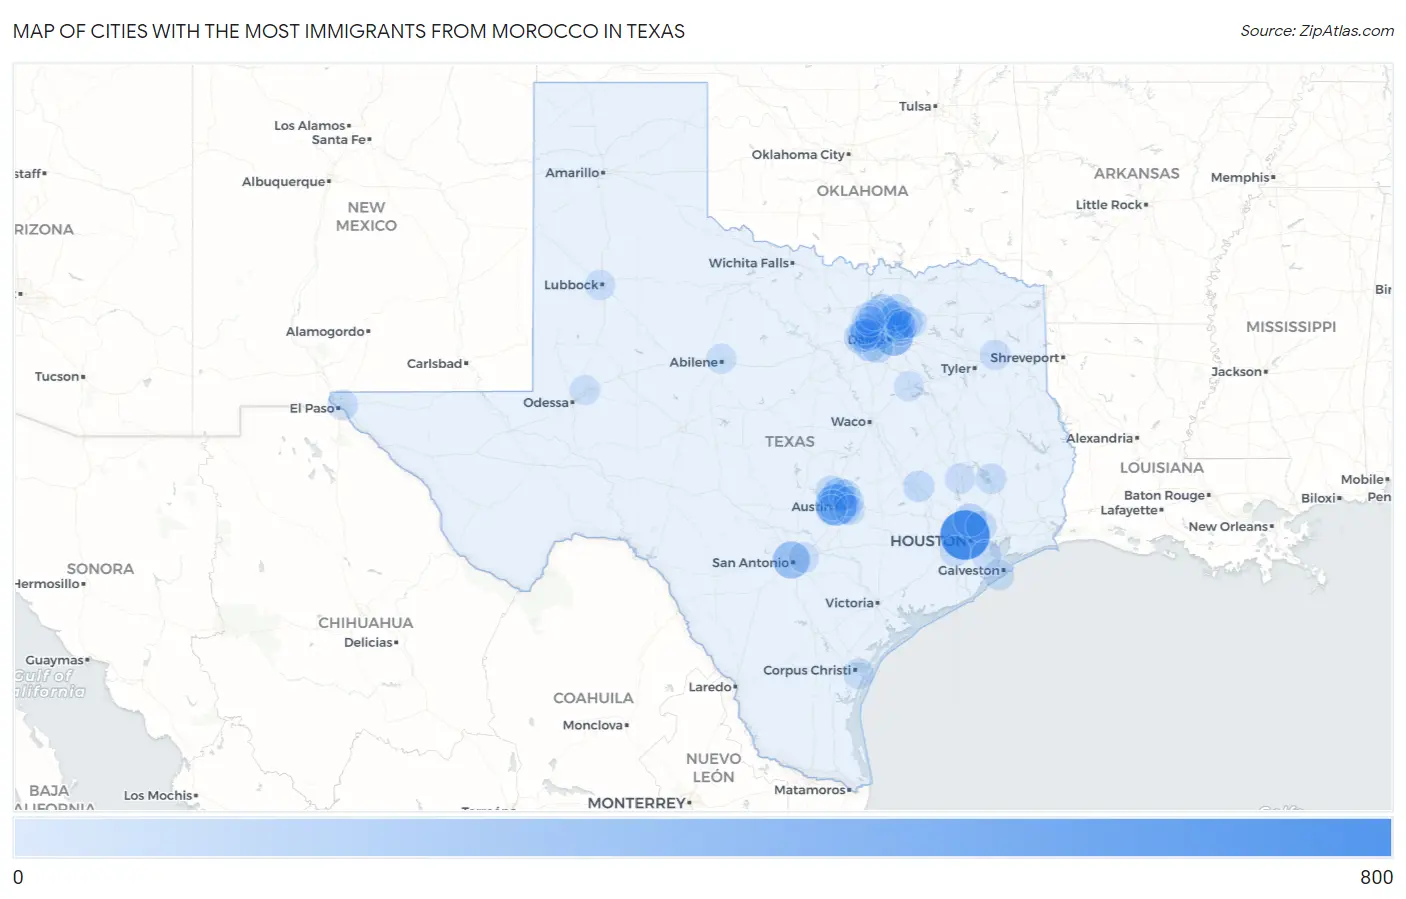
Map of Cities with the Most Immigrants from Morocco in Texas
0
800
Cities with the Most Immigrants from Morocco in Texas
| City | Morocco | vs State | vs National | |
| 1. | Houston | 761 | 4,509(16.88%)#1 | 88,055(0.86%)#12 |
| 2. | Austin | 432 | 4,509(9.58%)#2 | 88,055(0.49%)#24 |
| 3. | Dallas | 339 | 4,509(7.52%)#3 | 88,055(0.38%)#34 |
| 4. | San Antonio | 270 | 4,509(5.99%)#4 | 88,055(0.31%)#42 |
| 5. | Little Elm | 153 | 4,509(3.39%)#5 | 88,055(0.17%)#88 |
| 6. | Wells Branch | 144 | 4,509(3.19%)#6 | 88,055(0.16%)#96 |
| 7. | Spring | 116 | 4,509(2.57%)#7 | 88,055(0.13%)#124 |
| 8. | Hurst | 114 | 4,509(2.53%)#8 | 88,055(0.13%)#125 |
| 9. | Arlington | 107 | 4,509(2.37%)#9 | 88,055(0.12%)#137 |
| 10. | Richardson | 87 | 4,509(1.93%)#10 | 88,055(0.10%)#168 |
| 11. | Fort Worth | 81 | 4,509(1.80%)#11 | 88,055(0.09%)#183 |
| 12. | Garland | 61 | 4,509(1.35%)#12 | 88,055(0.07%)#252 |
| 13. | Wylie | 58 | 4,509(1.29%)#13 | 88,055(0.07%)#268 |
| 14. | Plano | 55 | 4,509(1.22%)#14 | 88,055(0.06%)#278 |
| 15. | Mckinney | 54 | 4,509(1.20%)#15 | 88,055(0.06%)#284 |
| 16. | Cedar Park | 49 | 4,509(1.09%)#16 | 88,055(0.06%)#319 |
| 17. | College Station | 45 | 4,509(1.00%)#17 | 88,055(0.05%)#346 |
| 18. | Frisco | 44 | 4,509(0.98%)#18 | 88,055(0.05%)#355 |
| 19. | Irving | 41 | 4,509(0.91%)#19 | 88,055(0.05%)#378 |
| 20. | Pflugerville | 39 | 4,509(0.86%)#20 | 88,055(0.04%)#389 |
| 21. | Haltom City | 36 | 4,509(0.80%)#21 | 88,055(0.04%)#414 |
| 22. | Grand Prairie | 34 | 4,509(0.75%)#22 | 88,055(0.04%)#437 |
| 23. | Bedford | 33 | 4,509(0.73%)#23 | 88,055(0.04%)#447 |
| 24. | Corpus Christi | 30 | 4,509(0.67%)#24 | 88,055(0.03%)#475 |
| 25. | Southlake | 30 | 4,509(0.67%)#25 | 88,055(0.03%)#480 |
| 26. | Lavon | 30 | 4,509(0.67%)#26 | 88,055(0.03%)#488 |
| 27. | Atascocita | 29 | 4,509(0.64%)#27 | 88,055(0.03%)#493 |
| 28. | Hornsby Bend | 27 | 4,509(0.60%)#28 | 88,055(0.03%)#537 |
| 29. | Galveston | 22 | 4,509(0.49%)#29 | 88,055(0.02%)#620 |
| 30. | West Livingston | 22 | 4,509(0.49%)#30 | 88,055(0.02%)#629 |
| 31. | El Paso | 21 | 4,509(0.47%)#31 | 88,055(0.02%)#635 |
| 32. | Sugar Land | 21 | 4,509(0.47%)#32 | 88,055(0.02%)#637 |
| 33. | Allen | 21 | 4,509(0.47%)#33 | 88,055(0.02%)#638 |
| 34. | Argyle | 15 | 4,509(0.33%)#34 | 88,055(0.02%)#794 |
| 35. | Sachse | 14 | 4,509(0.31%)#35 | 88,055(0.02%)#808 |
| 36. | Nassau Bay | 14 | 4,509(0.31%)#36 | 88,055(0.02%)#821 |
| 37. | Keller | 13 | 4,509(0.29%)#37 | 88,055(0.01%)#824 |
| 38. | Converse | 13 | 4,509(0.29%)#38 | 88,055(0.01%)#828 |
| 39. | Manor | 13 | 4,509(0.29%)#39 | 88,055(0.01%)#837 |
| 40. | North Richland Hills | 12 | 4,509(0.27%)#40 | 88,055(0.01%)#852 |
| 41. | Corinth | 12 | 4,509(0.27%)#41 | 88,055(0.01%)#864 |
| 42. | Gladewater | 11 | 4,509(0.24%)#42 | 88,055(0.01%)#898 |
| 43. | Lubbock | 10 | 4,509(0.22%)#43 | 88,055(0.01%)#905 |
| 44. | Abilene | 10 | 4,509(0.22%)#44 | 88,055(0.01%)#908 |
| 45. | Flower Mound | 10 | 4,509(0.22%)#45 | 88,055(0.01%)#912 |
| 46. | Murphy | 10 | 4,509(0.22%)#46 | 88,055(0.01%)#929 |
| 47. | West Lake Hills | 9 | 4,509(0.20%)#47 | 88,055(0.01%)#983 |
| 48. | Huntsville | 8 | 4,509(0.18%)#48 | 88,055(0.01%)#999 |
| 49. | Corsicana | 3 | 4,509(0.07%)#49 | 88,055(0.00%)#1,128 |
| 50. | Midland | 2 | 4,509(0.04%)#50 | 88,055(0.00%)#1,143 |
| 51. | Sunset Valley | 2 | 4,509(0.04%)#51 | 88,055(0.00%)#1,153 |
| 52. | Webberville | 1 | 4,509(0.02%)#52 | 88,055(0.00%)#1,169 |
Common Questions
What are the Top 10 Cities with the Most Immigrants from Morocco in Texas?
Top 10 Cities with the Most Immigrants from Morocco in Texas are:
#1
761
#2
432
#3
339
#4
270
#5
153
#6
144
#7
116
#8
114
#9
107
#10
87
What city has the Most Immigrants from Morocco in Texas?
Houston has the Most Immigrants from Morocco in Texas with 761.
What is the Total Immigrants from Morocco in the State of Texas?
Total Immigrants from Morocco in Texas is 4,509.
What is the Total Immigrants from Morocco in the United States?
Total Immigrants from Morocco in the United States is 88,055.