Retreat, TX
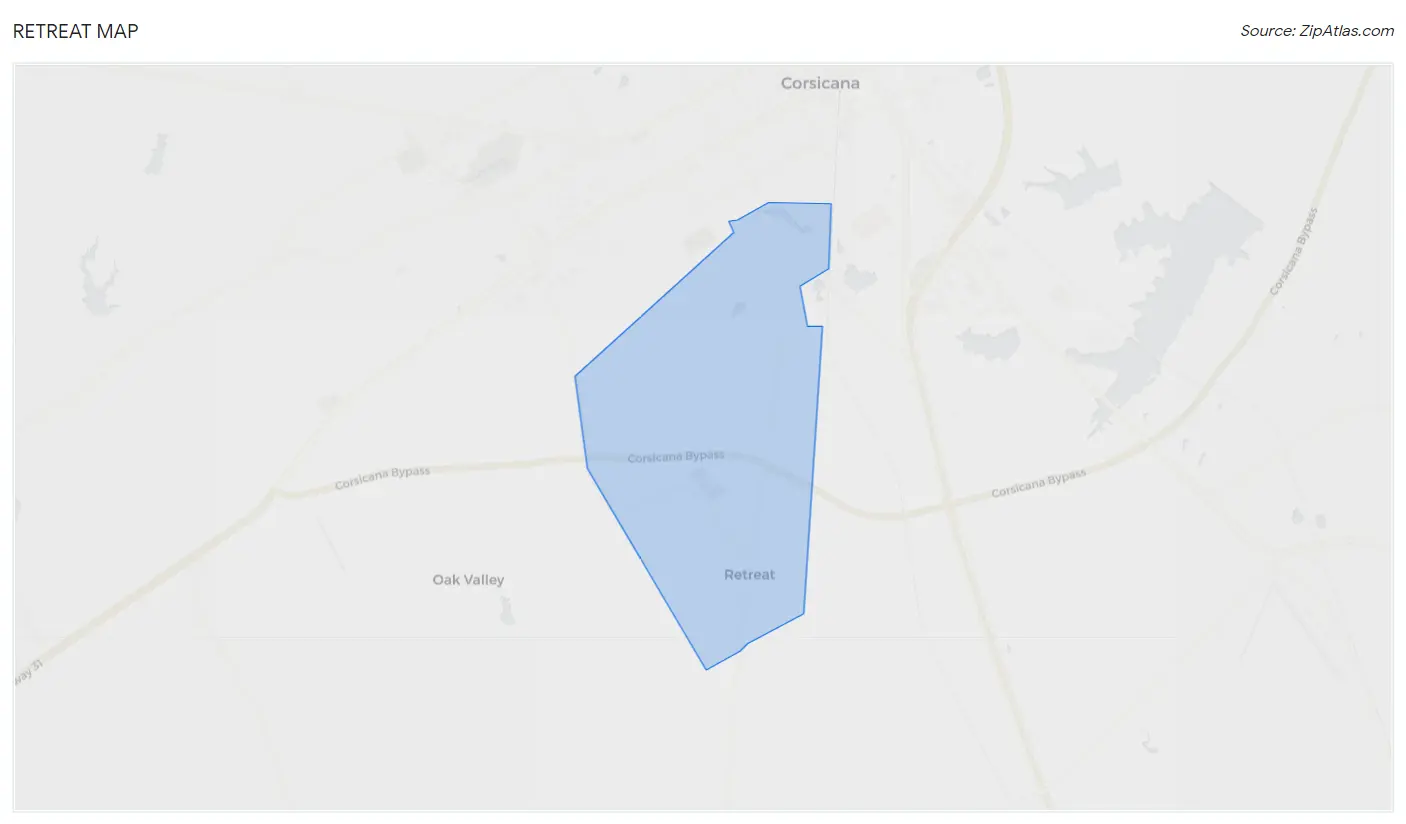
Retreat Map
Retreat Overview
749
TOTAL POPULATION
398
MALE POPULATION
351
FEMALE POPULATION
113.39
MALES / 100 FEMALES
88.19
FEMALES / 100 MALES
38.3
MEDIAN AGE
3.4
AVG FAMILY SIZE
3.1
AVG HOUSEHOLD SIZE
$33,692
PER CAPITA INCOME
$101,771
AVG FAMILY INCOME
$97,917
AVG HOUSEHOLD INCOME
3.8%
WAGE / INCOME GAP [ % ]
96.2¢/ $1
WAGE / INCOME GAP [ $ ]
0.38
INEQUALITY / GINI INDEX
482
LABOR FORCE [ PEOPLE ]
78.0%
PERCENT IN LABOR FORCE
4.1%
UNEMPLOYMENT RATE
Race in Retreat
The most populous races in Retreat are White / Caucasian (610 | 81.4%), Hispanic or Latino (205 | 27.4%), and Black / African American (88 | 11.7%).
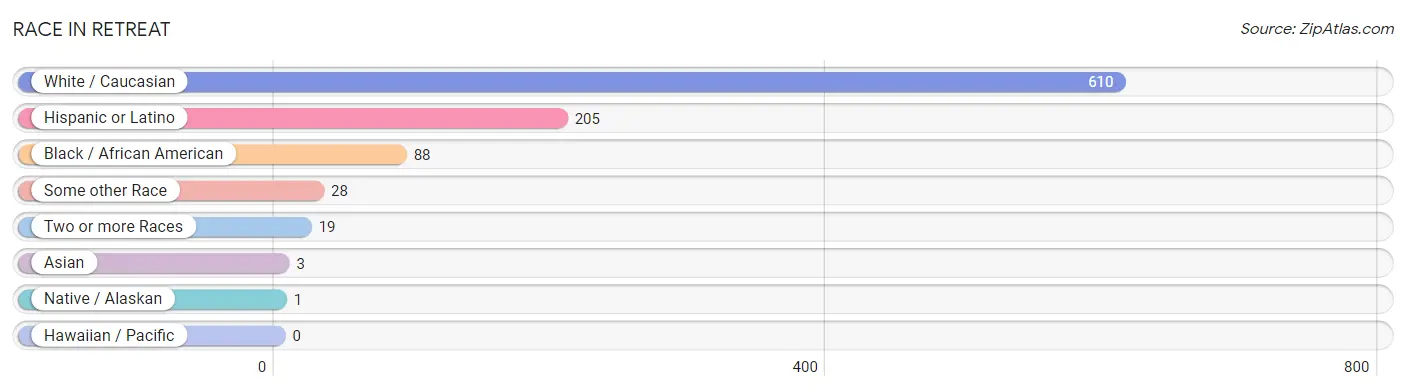
| Race | # Population | % Population |
| Asian | 3 | 0.4% |
| Black / African American | 88 | 11.7% |
| Hawaiian / Pacific | 0 | 0.0% |
| Hispanic or Latino | 205 | 27.4% |
| Native / Alaskan | 1 | 0.1% |
| White / Caucasian | 610 | 81.4% |
| Two or more Races | 19 | 2.5% |
| Some other Race | 28 | 3.7% |
| Total | 749 | 100.0% |
Ancestry in Retreat
The most populous ancestries reported in Retreat are Mexican (204 | 27.2%), English (73 | 9.8%), German (47 | 6.3%), Irish (38 | 5.1%), and American (31 | 4.1%), together accounting for 52.5% of all Retreat residents.
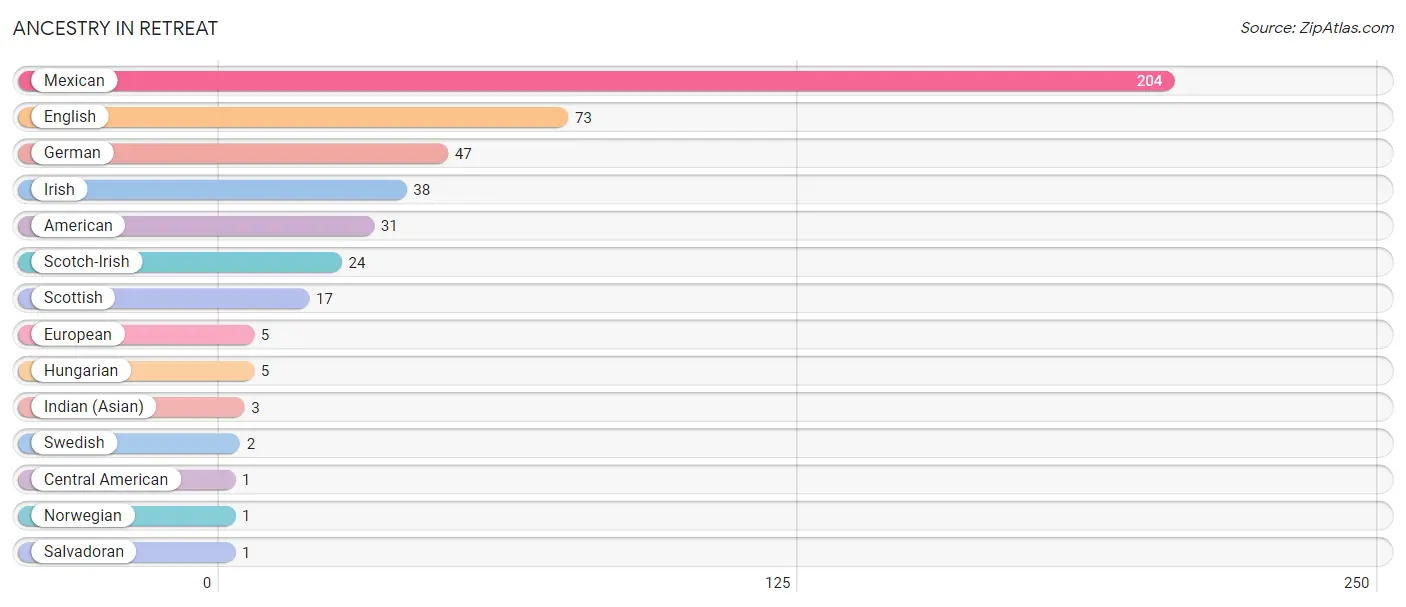
| Ancestry | # Population | % Population |
| American | 31 | 4.1% |
| Central American | 1 | 0.1% |
| English | 73 | 9.8% |
| European | 5 | 0.7% |
| German | 47 | 6.3% |
| Hungarian | 5 | 0.7% |
| Indian (Asian) | 3 | 0.4% |
| Irish | 38 | 5.1% |
| Mexican | 204 | 27.2% |
| Norwegian | 1 | 0.1% |
| Salvadoran | 1 | 0.1% |
| Scotch-Irish | 24 | 3.2% |
| Scottish | 17 | 2.3% |
| Swedish | 2 | 0.3% | View All 14 Rows |
Immigrants in Retreat
The most numerous immigrant groups reported in Retreat came from Central America (107 | 14.3%), Latin America (107 | 14.3%), Mexico (106 | 14.1%), Asia (3 | 0.4%), and China (3 | 0.4%), together accounting for 43.5% of all Retreat residents.
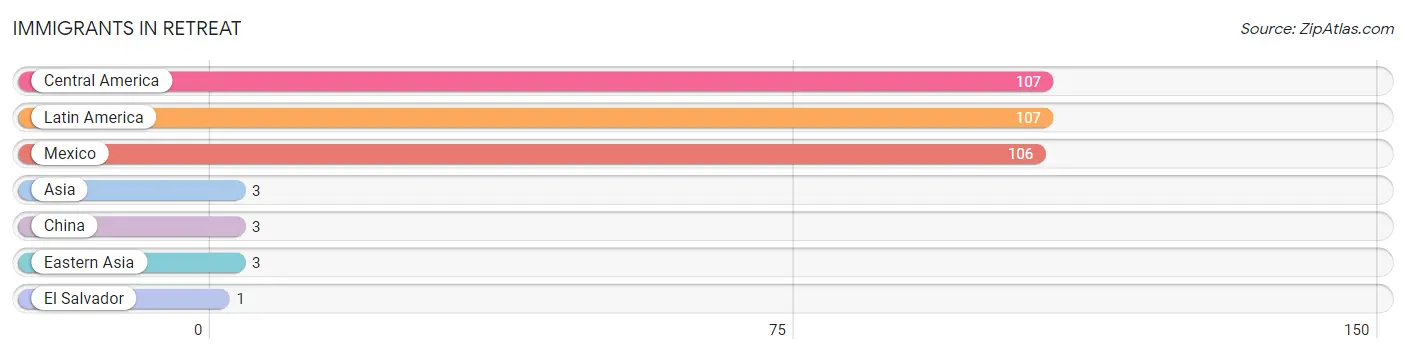
| Immigration Origin | # Population | % Population |
| Asia | 3 | 0.4% |
| Central America | 107 | 14.3% |
| China | 3 | 0.4% |
| Eastern Asia | 3 | 0.4% |
| El Salvador | 1 | 0.1% |
| Latin America | 107 | 14.3% |
| Mexico | 106 | 14.1% | View All 7 Rows |
Sex and Age in Retreat
Sex and Age in Retreat
The most populous age groups in Retreat are 20 to 24 Years (57 | 14.3%) for men and 45 to 49 Years (55 | 15.7%) for women.
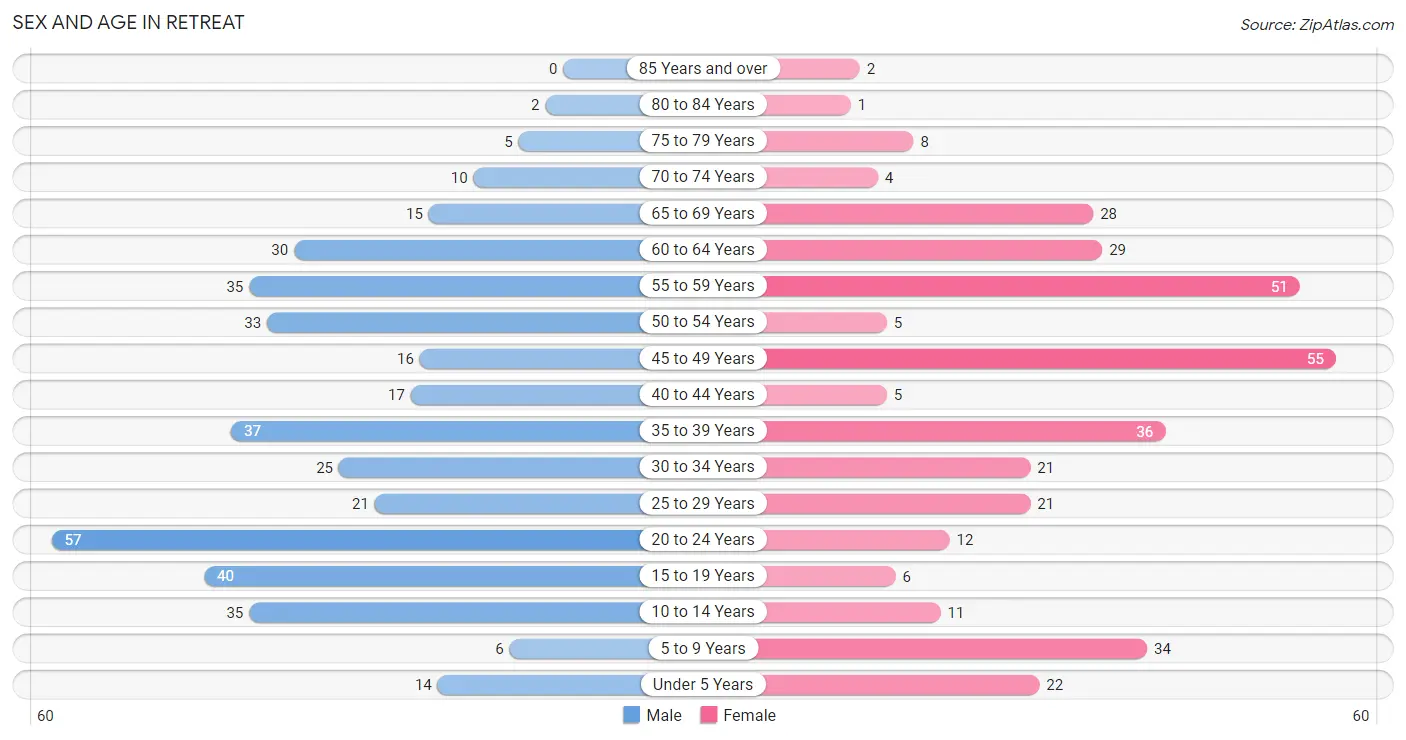
| Age Bracket | Male | Female |
| Under 5 Years | 14 (3.5%) | 22 (6.3%) |
| 5 to 9 Years | 6 (1.5%) | 34 (9.7%) |
| 10 to 14 Years | 35 (8.8%) | 11 (3.1%) |
| 15 to 19 Years | 40 (10.1%) | 6 (1.7%) |
| 20 to 24 Years | 57 (14.3%) | 12 (3.4%) |
| 25 to 29 Years | 21 (5.3%) | 21 (6.0%) |
| 30 to 34 Years | 25 (6.3%) | 21 (6.0%) |
| 35 to 39 Years | 37 (9.3%) | 36 (10.3%) |
| 40 to 44 Years | 17 (4.3%) | 5 (1.4%) |
| 45 to 49 Years | 16 (4.0%) | 55 (15.7%) |
| 50 to 54 Years | 33 (8.3%) | 5 (1.4%) |
| 55 to 59 Years | 35 (8.8%) | 51 (14.5%) |
| 60 to 64 Years | 30 (7.5%) | 29 (8.3%) |
| 65 to 69 Years | 15 (3.8%) | 28 (8.0%) |
| 70 to 74 Years | 10 (2.5%) | 4 (1.1%) |
| 75 to 79 Years | 5 (1.3%) | 8 (2.3%) |
| 80 to 84 Years | 2 (0.5%) | 1 (0.3%) |
| 85 Years and over | 0 (0.0%) | 2 (0.6%) |
| Total | 398 (100.0%) | 351 (100.0%) |
Families and Households in Retreat
Median Family Size in Retreat
The median family size in Retreat is 3.40 persons per family, with married-couple families (172 | 81.5%) accounting for the largest median family size of 3.54 persons per family. On the other hand, single female/mother families (16 | 7.6%) represent the smallest median family size with 2.50 persons per family.
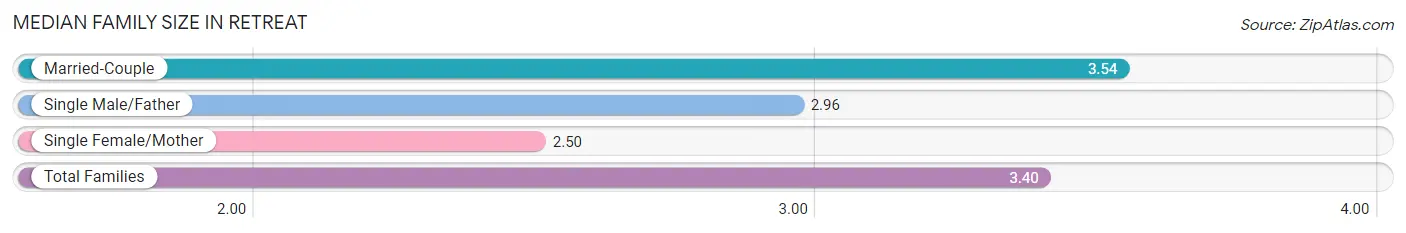
| Family Type | # Families | Family Size |
| Married-Couple | 172 (81.5%) | 3.54 |
| Single Male/Father | 23 (10.9%) | 2.96 |
| Single Female/Mother | 16 (7.6%) | 2.50 |
| Total Families | 211 (100.0%) | 3.40 |
Median Household Size in Retreat
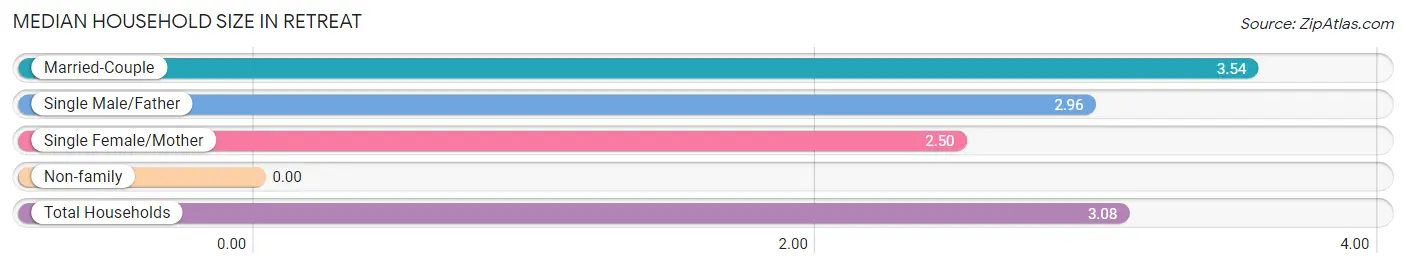
| Household Type | # Households | Household Size |
| Married-Couple | 172 (70.8%) | 3.54 |
| Single Male/Father | 23 (9.5%) | 2.96 |
| Single Female/Mother | 16 (6.6%) | 2.50 |
| Non-family | 32 (13.2%) | - |
| Total Households | 243 (100.0%) | 3.08 |
Household Size by Marriage Status in Retreat
Out of a total of 243 households in Retreat, 211 (86.8%) are family households, while 32 (13.2%) are nonfamily households. The most numerous type of family households are 4-person households, comprising 76, and the most common type of nonfamily households are 1-person households, comprising 32.
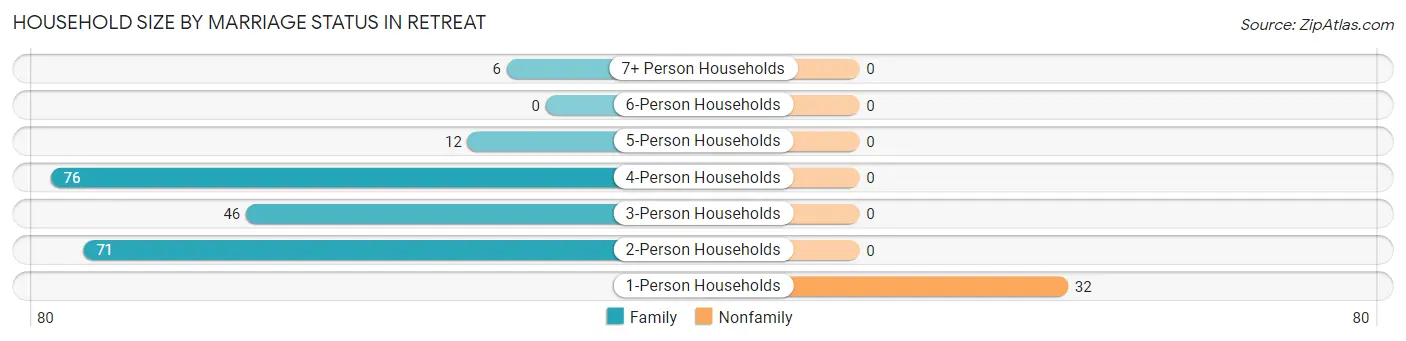
| Household Size | Family Households | Nonfamily Households |
| 1-Person Households | - | 32 (13.2%) |
| 2-Person Households | 71 (29.2%) | 0 (0.0%) |
| 3-Person Households | 46 (18.9%) | 0 (0.0%) |
| 4-Person Households | 76 (31.3%) | 0 (0.0%) |
| 5-Person Households | 12 (4.9%) | 0 (0.0%) |
| 6-Person Households | 0 (0.0%) | 0 (0.0%) |
| 7+ Person Households | 6 (2.5%) | 0 (0.0%) |
| Total | 211 (86.8%) | 32 (13.2%) |
Female Fertility in Retreat
Fertility by Age in Retreat
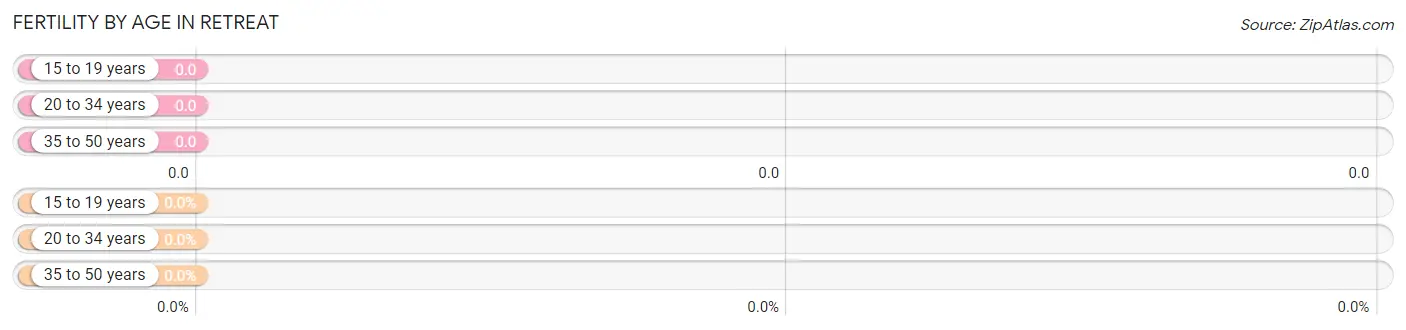
| Age Bracket | Women with Births | Births / 1,000 Women |
| 15 to 19 years | 0 (0.0%) | 0.0 |
| 20 to 34 years | 0 (0.0%) | 0.0 |
| 35 to 50 years | 0 (0.0%) | 0.0 |
| Total | 0 (0.0%) | 0.0 |
Fertility by Age by Marriage Status in Retreat
| Age Bracket | Married | Unmarried |
| 15 to 19 years | 0 (0.0%) | 0 (0.0%) |
| 20 to 34 years | 0 (0.0%) | 0 (0.0%) |
| 35 to 50 years | 0 (0.0%) | 0 (0.0%) |
| Total | 0 (0.0%) | 0 (0.0%) |
Fertility by Education in Retreat
| Educational Attainment | Women with Births | Births / 1,000 Women |
| Less than High School | 0 (0.0%) | 0.0 |
| High School Diploma | 0 (0.0%) | 0.0 |
| College or Associate's Degree | 0 (0.0%) | 0.0 |
| Bachelor's Degree | 0 (0.0%) | 0.0 |
| Graduate Degree | 0 (0.0%) | 0.0 |
| Total | 0 (0.0%) | 0.0 |
Fertility by Education by Marriage Status in Retreat
| Educational Attainment | Married | Unmarried |
| Less than High School | 0 (0.0%) | 0 (0.0%) |
| High School Diploma | 0 (0.0%) | 0 (0.0%) |
| College or Associate's Degree | 0 (0.0%) | 0 (0.0%) |
| Bachelor's Degree | 0 (0.0%) | 0 (0.0%) |
| Graduate Degree | 0 (0.0%) | 0 (0.0%) |
| Total | 0 (0.0%) | 0 (0.0%) |
Income in Retreat
Income Overview in Retreat
Per Capita Income in Retreat is $33,692, while median incomes of families and households are $101,771 and $97,917 respectively.
| Characteristic | Number | Measure |
| Per Capita Income | 749 | $33,692 |
| Median Family Income | 211 | $101,771 |
| Mean Family Income | 211 | $111,451 |
| Median Household Income | 243 | $97,917 |
| Mean Household Income | 243 | $100,763 |
| Income Deficit | 211 | $0 |
| Wage / Income Gap (%) | 749 | 3.77% |
| Wage / Income Gap ($) | 749 | 96.23¢ per $1 |
| Gini / Inequality Index | 749 | 0.38 |
Earnings by Sex in Retreat
Average Earnings in Retreat are $38,765, $37,879 for men and $39,362 for women, a difference of 3.8%.
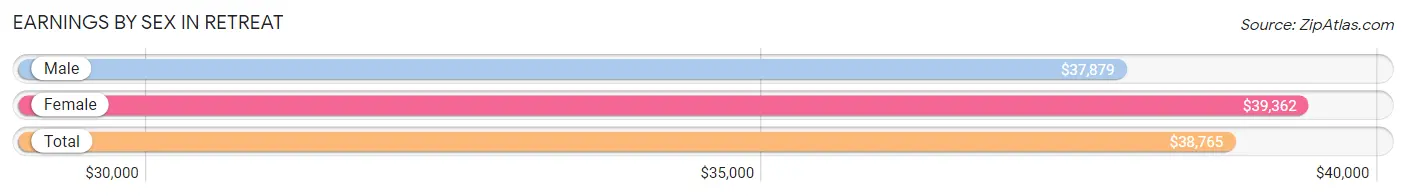
| Sex | Number | Average Earnings |
| Male | 266 (54.2%) | $37,879 |
| Female | 225 (45.8%) | $39,362 |
| Total | 491 (100.0%) | $38,765 |
Earnings by Sex by Income Bracket in Retreat
The most common earnings brackets in Retreat are $25,000 to $29,999 for men (47 | 17.7%) and $35,000 to $39,999 for women (55 | 24.4%).
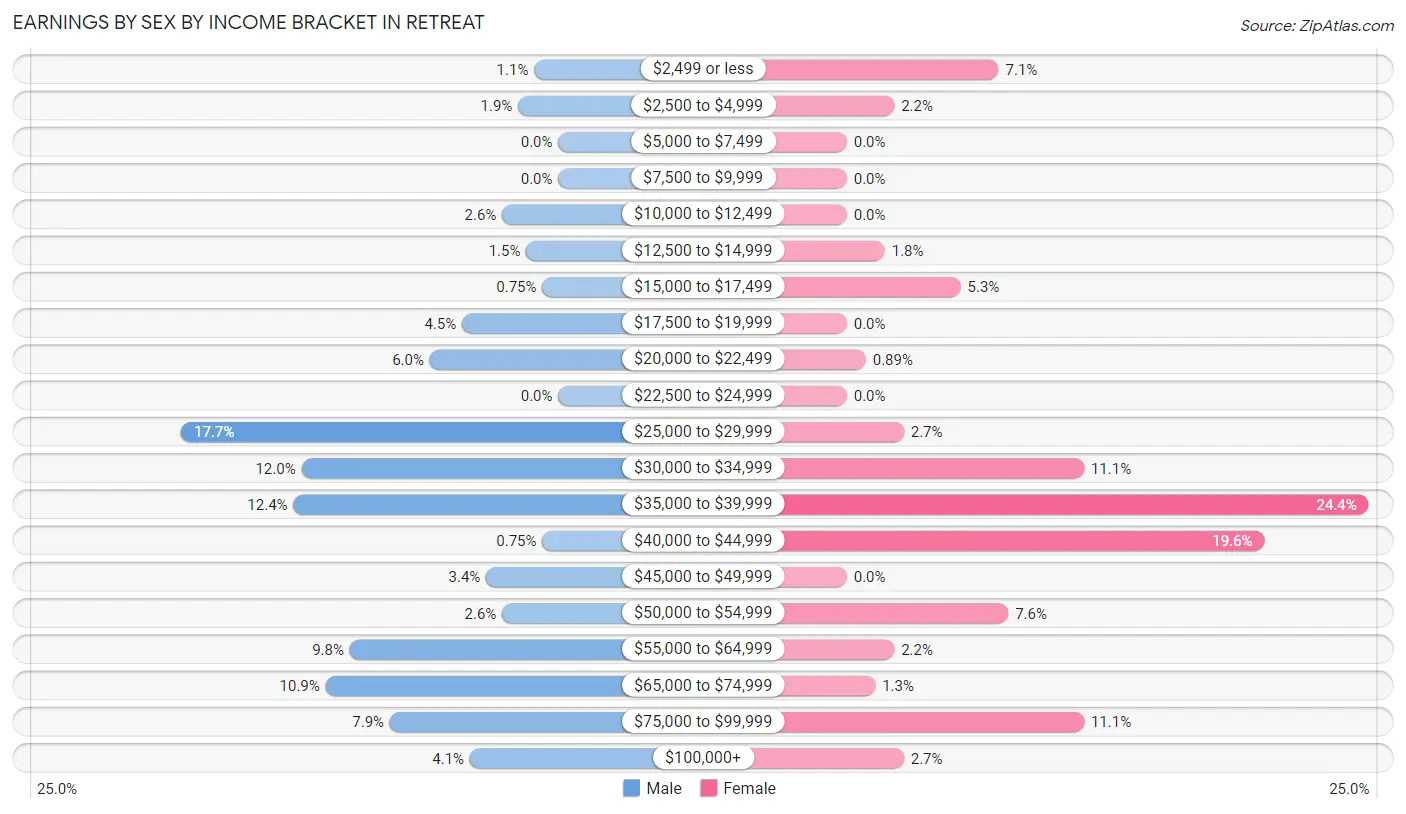
| Income | Male | Female |
| $2,499 or less | 3 (1.1%) | 16 (7.1%) |
| $2,500 to $4,999 | 5 (1.9%) | 5 (2.2%) |
| $5,000 to $7,499 | 0 (0.0%) | 0 (0.0%) |
| $7,500 to $9,999 | 0 (0.0%) | 0 (0.0%) |
| $10,000 to $12,499 | 7 (2.6%) | 0 (0.0%) |
| $12,500 to $14,999 | 4 (1.5%) | 4 (1.8%) |
| $15,000 to $17,499 | 2 (0.7%) | 12 (5.3%) |
| $17,500 to $19,999 | 12 (4.5%) | 0 (0.0%) |
| $20,000 to $22,499 | 16 (6.0%) | 2 (0.9%) |
| $22,500 to $24,999 | 0 (0.0%) | 0 (0.0%) |
| $25,000 to $29,999 | 47 (17.7%) | 6 (2.7%) |
| $30,000 to $34,999 | 32 (12.0%) | 25 (11.1%) |
| $35,000 to $39,999 | 33 (12.4%) | 55 (24.4%) |
| $40,000 to $44,999 | 2 (0.7%) | 44 (19.6%) |
| $45,000 to $49,999 | 9 (3.4%) | 0 (0.0%) |
| $50,000 to $54,999 | 7 (2.6%) | 17 (7.6%) |
| $55,000 to $64,999 | 26 (9.8%) | 5 (2.2%) |
| $65,000 to $74,999 | 29 (10.9%) | 3 (1.3%) |
| $75,000 to $99,999 | 21 (7.9%) | 25 (11.1%) |
| $100,000+ | 11 (4.1%) | 6 (2.7%) |
| Total | 266 (100.0%) | 225 (100.0%) |
Earnings by Sex by Educational Attainment in Retreat
Average earnings in Retreat are $46,528 for men and $39,668 for women, a difference of 14.7%. Men with an educational attainment of bachelor's degree enjoy the highest average annual earnings of $71,250, while those with high school diploma education earn the least with $34,583. Women with an educational attainment of graduate degree earn the most with the average annual earnings of $84,375, while those with high school diploma education have the smallest earnings of $38,776.
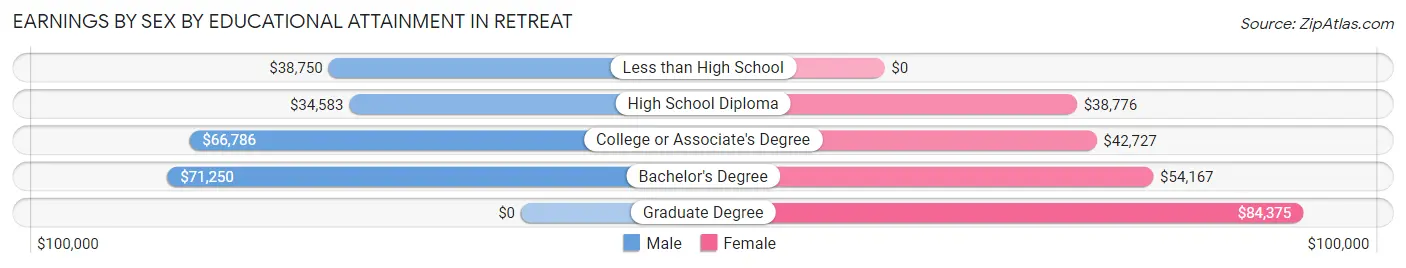
| Educational Attainment | Male Income | Female Income |
| Less than High School | $38,750 | $0 |
| High School Diploma | $34,583 | $38,776 |
| College or Associate's Degree | $66,786 | $42,727 |
| Bachelor's Degree | $71,250 | $54,167 |
| Graduate Degree | - | - |
| Total | $46,528 | $39,668 |
Family Income in Retreat
Family Income Brackets in Retreat
According to the Retreat family income data, there are 78 families falling into the $100,000 to $149,999 income range, which is the most common income bracket and makes up 37.0% of all families.
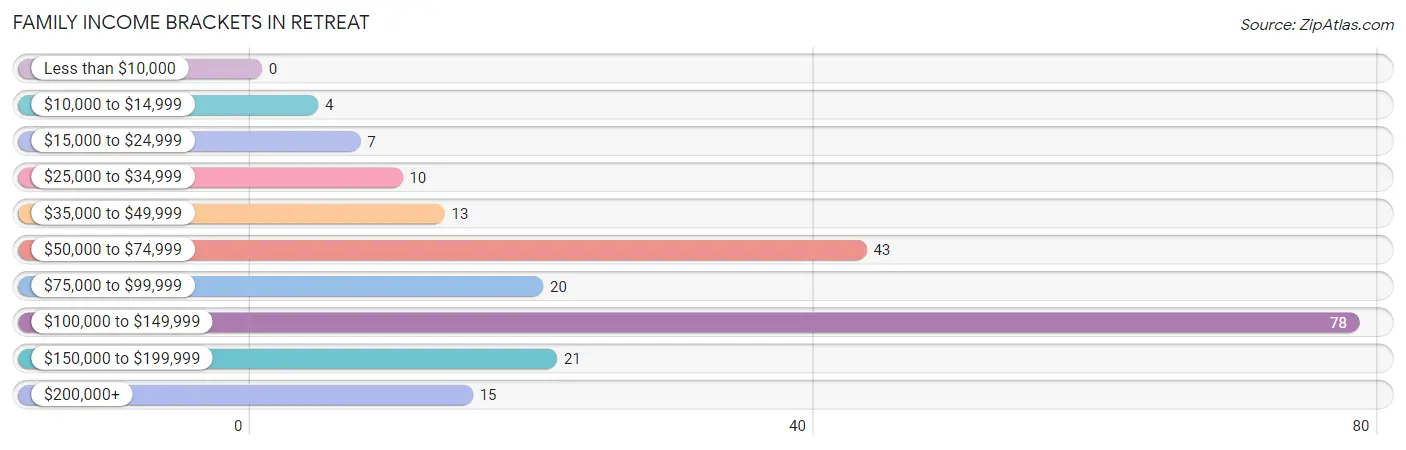
| Income Bracket | # Families | % Families |
| Less than $10,000 | 0 | 0.0% |
| $10,000 to $14,999 | 4 | 1.9% |
| $15,000 to $24,999 | 7 | 3.3% |
| $25,000 to $34,999 | 10 | 4.7% |
| $35,000 to $49,999 | 13 | 6.2% |
| $50,000 to $74,999 | 43 | 20.4% |
| $75,000 to $99,999 | 20 | 9.5% |
| $100,000 to $149,999 | 78 | 37.0% |
| $150,000 to $199,999 | 21 | 10.0% |
| $200,000+ | 15 | 7.1% |
Family Income by Famaliy Size in Retreat
5-person families (12 | 5.7%) account for the highest median family income in Retreat with $238,750 per family, while 5-person families (12 | 5.7%) have the highest median income of $47,750 per family member.
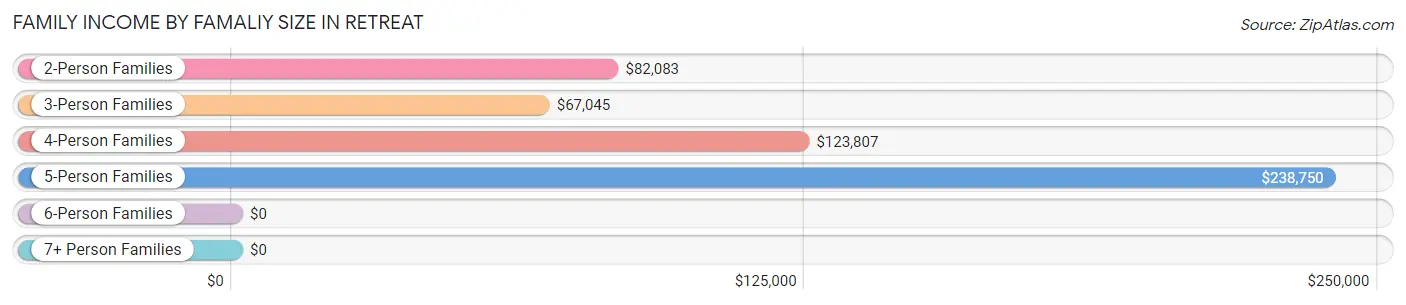
| Income Bracket | # Families | Median Income |
| 2-Person Families | 71 (33.7%) | $82,083 |
| 3-Person Families | 46 (21.8%) | $67,045 |
| 4-Person Families | 76 (36.0%) | $123,807 |
| 5-Person Families | 12 (5.7%) | $238,750 |
| 6-Person Families | 0 (0.0%) | $0 |
| 7+ Person Families | 6 (2.8%) | $0 |
| Total | 211 (100.0%) | $101,771 |
Family Income by Number of Earners in Retreat
The median family income in Retreat is $101,771, with families comprising 3+ earners (74) having the highest median family income of $124,375, while families with no earners (15) have the lowest median family income of $46,250, accounting for 35.1% and 7.1% of families, respectively.
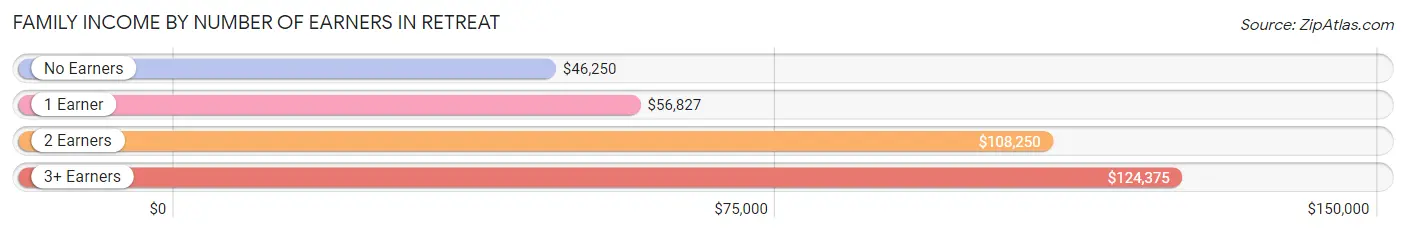
| Number of Earners | # Families | Median Income |
| No Earners | 15 (7.1%) | $46,250 |
| 1 Earner | 73 (34.6%) | $56,827 |
| 2 Earners | 49 (23.2%) | $108,250 |
| 3+ Earners | 74 (35.1%) | $124,375 |
| Total | 211 (100.0%) | $101,771 |
Household Income in Retreat
Household Income Brackets in Retreat
With 78 households falling in the category, the $100,000 to $149,999 income range is the most frequent in Retreat, accounting for 32.1% of all households. In contrast, only 6 households (2.5%) fall into the $10,000 to $14,999 income bracket, making it the least populous group.
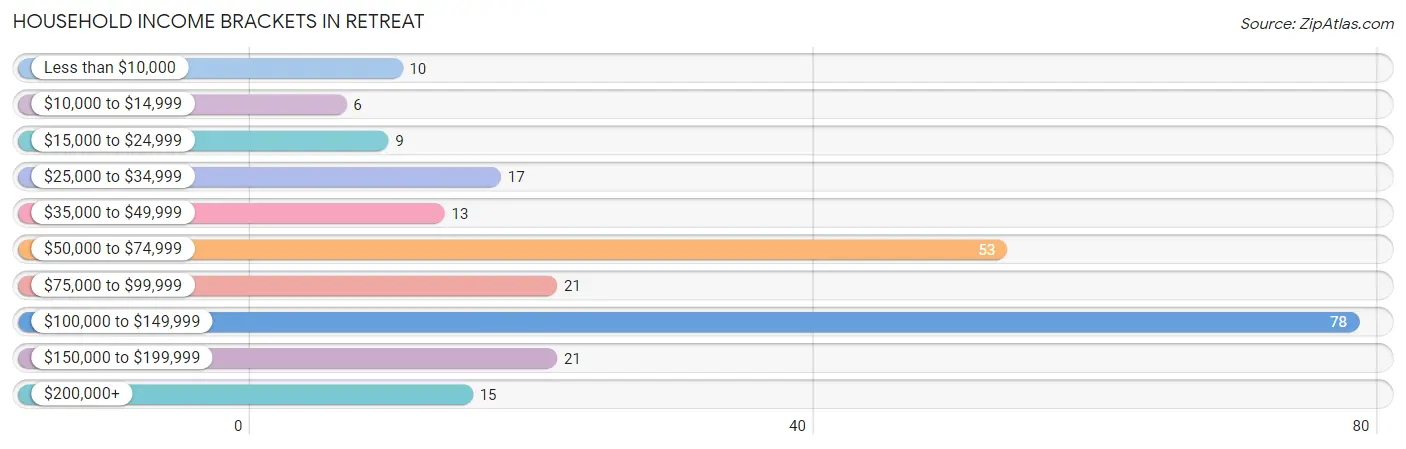
| Income Bracket | # Households | % Households |
| Less than $10,000 | 10 | 4.1% |
| $10,000 to $14,999 | 6 | 2.5% |
| $15,000 to $24,999 | 9 | 3.7% |
| $25,000 to $34,999 | 17 | 7.0% |
| $35,000 to $49,999 | 13 | 5.3% |
| $50,000 to $74,999 | 53 | 21.8% |
| $75,000 to $99,999 | 21 | 8.6% |
| $100,000 to $149,999 | 78 | 32.1% |
| $150,000 to $199,999 | 21 | 8.6% |
| $200,000+ | 15 | 6.2% |
Household Income by Householder Age in Retreat
The median household income in Retreat is $97,917, with the highest median household income of $116,875 found in the 45 to 64 years age bracket for the primary householder. A total of 133 households (54.7%) fall into this category. Meanwhile, the 15 to 24 years age bracket for the primary householder has the lowest median household income of $0, with 3 households (1.2%) in this group.
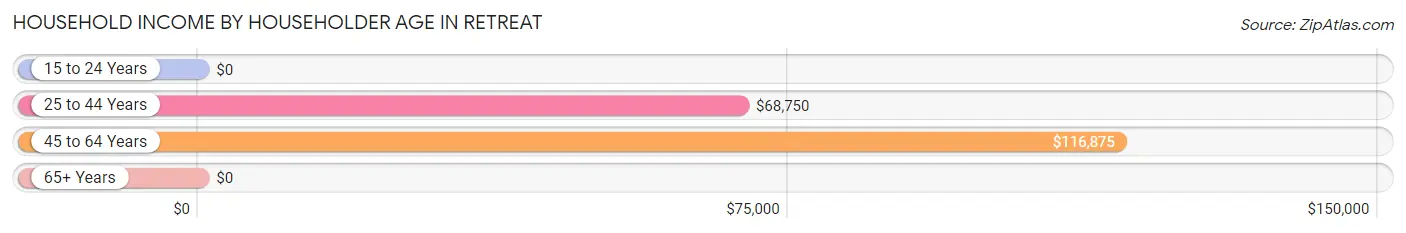
| Income Bracket | # Households | Median Income |
| 15 to 24 Years | 3 (1.2%) | $0 |
| 25 to 44 Years | 62 (25.5%) | $68,750 |
| 45 to 64 Years | 133 (54.7%) | $116,875 |
| 65+ Years | 45 (18.5%) | $0 |
| Total | 243 (100.0%) | $97,917 |
Poverty in Retreat
Income Below Poverty by Sex and Age in Retreat
With 1.8% poverty level for males and 5.7% for females among the residents of Retreat, 75 year old and over males and 65 to 74 year old females are the most vulnerable to poverty, with 3 males (42.9%) and 9 females (28.1%) in their respective age groups living below the poverty level.
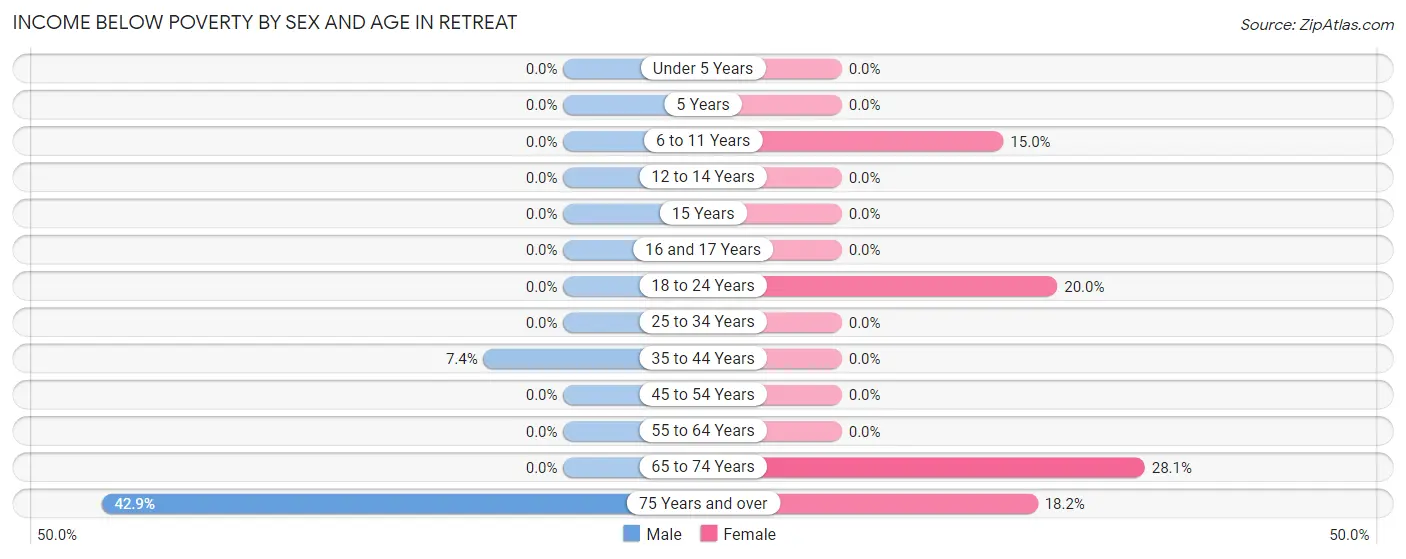
| Age Bracket | Male | Female |
| Under 5 Years | 0 (0.0%) | 0 (0.0%) |
| 5 Years | 0 (0.0%) | 0 (0.0%) |
| 6 to 11 Years | 0 (0.0%) | 6 (15.0%) |
| 12 to 14 Years | 0 (0.0%) | 0 (0.0%) |
| 15 Years | 0 (0.0%) | 0 (0.0%) |
| 16 and 17 Years | 0 (0.0%) | 0 (0.0%) |
| 18 to 24 Years | 0 (0.0%) | 3 (20.0%) |
| 25 to 34 Years | 0 (0.0%) | 0 (0.0%) |
| 35 to 44 Years | 4 (7.4%) | 0 (0.0%) |
| 45 to 54 Years | 0 (0.0%) | 0 (0.0%) |
| 55 to 64 Years | 0 (0.0%) | 0 (0.0%) |
| 65 to 74 Years | 0 (0.0%) | 9 (28.1%) |
| 75 Years and over | 3 (42.9%) | 2 (18.2%) |
| Total | 7 (1.8%) | 20 (5.7%) |
Income Above Poverty by Sex and Age in Retreat
According to the poverty statistics in Retreat, males aged under 5 years and females aged under 5 years are the age groups that are most secure financially, with 100.0% of males and 100.0% of females in these age groups living above the poverty line.
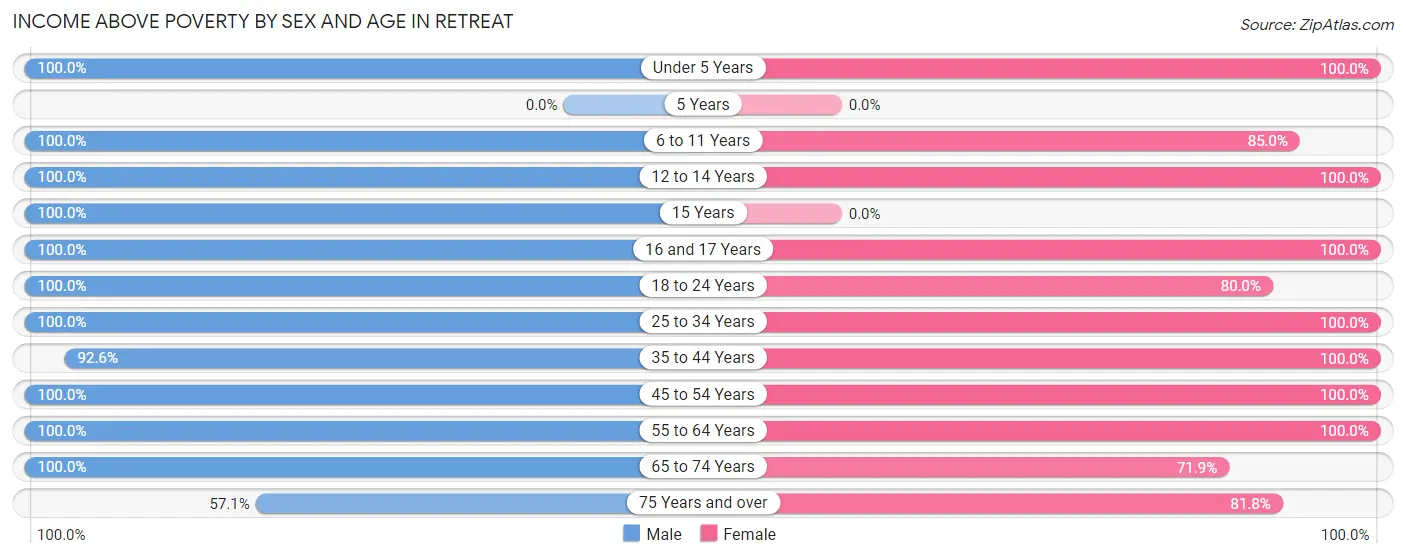
| Age Bracket | Male | Female |
| Under 5 Years | 14 (100.0%) | 22 (100.0%) |
| 5 Years | 0 (0.0%) | 0 (0.0%) |
| 6 to 11 Years | 39 (100.0%) | 34 (85.0%) |
| 12 to 14 Years | 2 (100.0%) | 5 (100.0%) |
| 15 Years | 9 (100.0%) | 0 (0.0%) |
| 16 and 17 Years | 15 (100.0%) | 3 (100.0%) |
| 18 to 24 Years | 73 (100.0%) | 12 (80.0%) |
| 25 to 34 Years | 46 (100.0%) | 42 (100.0%) |
| 35 to 44 Years | 50 (92.6%) | 41 (100.0%) |
| 45 to 54 Years | 49 (100.0%) | 60 (100.0%) |
| 55 to 64 Years | 65 (100.0%) | 80 (100.0%) |
| 65 to 74 Years | 25 (100.0%) | 23 (71.9%) |
| 75 Years and over | 4 (57.1%) | 9 (81.8%) |
| Total | 391 (98.2%) | 331 (94.3%) |
Income Below Poverty Among Married-Couple Families in Retreat
The poverty statistics for married-couple families in Retreat show that 1.2% or 2 of the total 172 families live below the poverty line. Families with no children have the highest poverty rate of 1.5%, comprising of 2 families. On the other hand, families with 1 or 2 children have the lowest poverty rate of 0.0%, which includes 0 families.
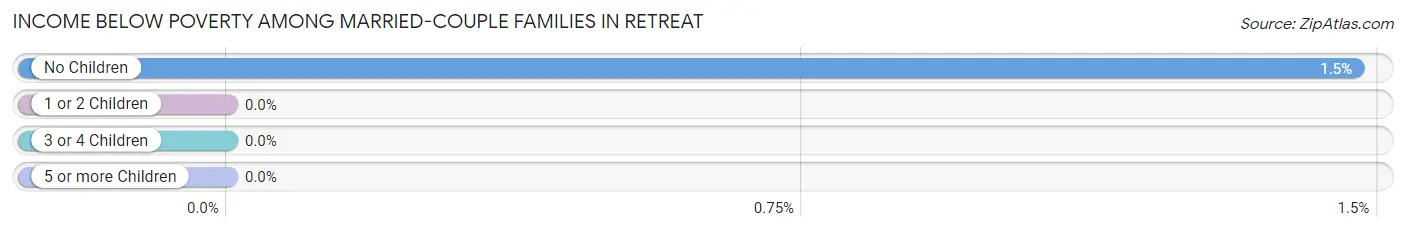
| Children | Above Poverty | Below Poverty |
| No Children | 134 (98.5%) | 2 (1.5%) |
| 1 or 2 Children | 28 (100.0%) | 0 (0.0%) |
| 3 or 4 Children | 6 (100.0%) | 0 (0.0%) |
| 5 or more Children | 2 (100.0%) | 0 (0.0%) |
| Total | 170 (98.8%) | 2 (1.2%) |
Income Below Poverty Among Single-Parent Households in Retreat
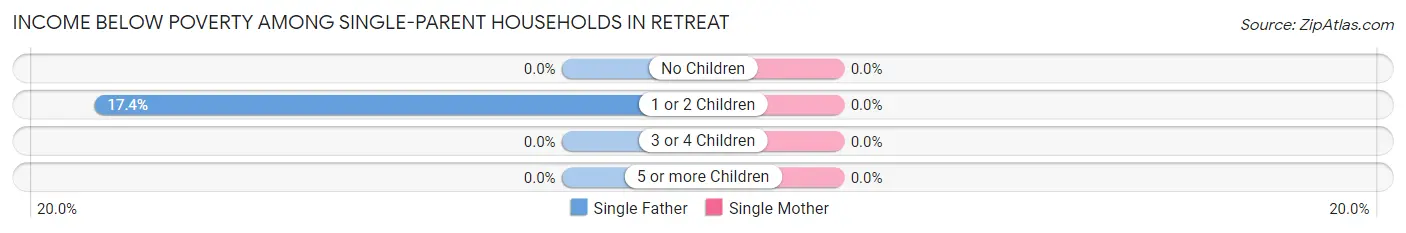
| Children | Single Father | Single Mother |
| No Children | 0 (0.0%) | 0 (0.0%) |
| 1 or 2 Children | 4 (17.4%) | 0 (0.0%) |
| 3 or 4 Children | 0 (0.0%) | 0 (0.0%) |
| 5 or more Children | 0 (0.0%) | 0 (0.0%) |
| Total | 4 (17.4%) | 0 (0.0%) |
Income Below Poverty Among Married-Couple vs Single-Parent Households in Retreat
The poverty data for Retreat shows that 2 of the married-couple family households (1.2%) and 4 of the single-parent households (10.3%) are living below the poverty level. Within the married-couple family households, those with no children have the highest poverty rate, with 2 households (1.5%) falling below the poverty line. Among the single-parent households, those with 1 or 2 children have the highest poverty rate, with 4 household (13.8%) living below poverty.
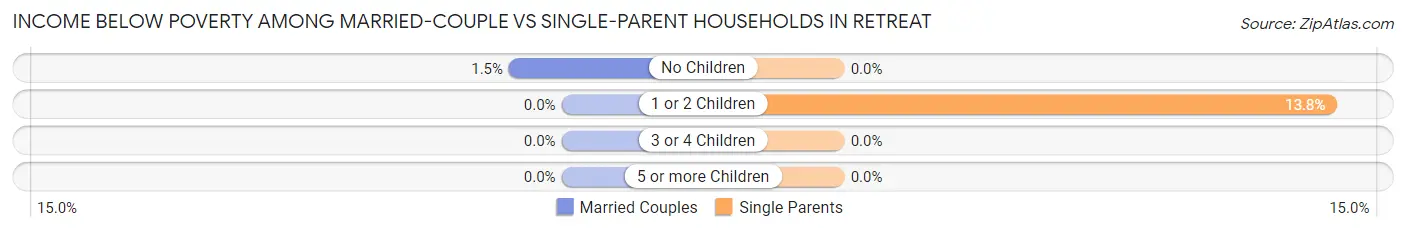
| Children | Married-Couple Families | Single-Parent Households |
| No Children | 2 (1.5%) | 0 (0.0%) |
| 1 or 2 Children | 0 (0.0%) | 4 (13.8%) |
| 3 or 4 Children | 0 (0.0%) | 0 (0.0%) |
| 5 or more Children | 0 (0.0%) | 0 (0.0%) |
| Total | 2 (1.2%) | 4 (10.3%) |
Employment Characteristics in Retreat
Employment by Class of Employer in Retreat
Among the 462 employed individuals in Retreat, private company employees (335 | 72.5%), state government employees (58 | 12.6%), and local government employees (28 | 6.1%) make up the most common classes of employment.
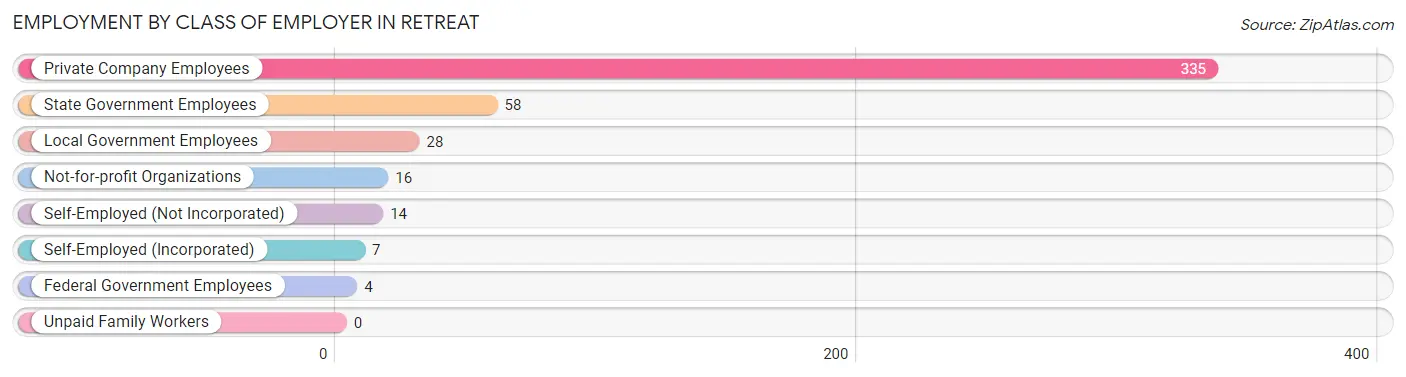
| Employer Class | # Employees | % Employees |
| Private Company Employees | 335 | 72.5% |
| Self-Employed (Incorporated) | 7 | 1.5% |
| Self-Employed (Not Incorporated) | 14 | 3.0% |
| Not-for-profit Organizations | 16 | 3.5% |
| Local Government Employees | 28 | 6.1% |
| State Government Employees | 58 | 12.6% |
| Federal Government Employees | 4 | 0.9% |
| Unpaid Family Workers | 0 | 0.0% |
| Total | 462 | 100.0% |
Employment Status by Age in Retreat
According to the labor force statistics for Retreat, out of the total population over 16 years of age (618), 78.0% or 482 individuals are in the labor force, with 4.1% or 20 of them unemployed. The age group with the highest labor force participation rate is 25 to 29 years, with 100.0% or 42 individuals in the labor force. Within the labor force, the 25 to 29 years age range has the highest percentage of unemployed individuals, with 28.6% or 12 of them being unemployed.
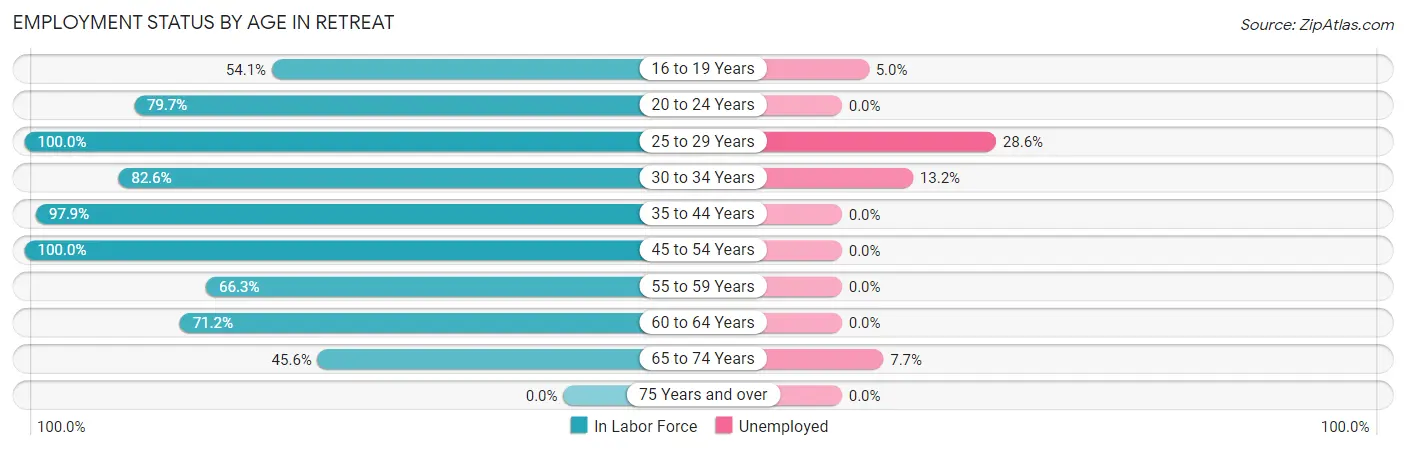
| Age Bracket | In Labor Force | Unemployed |
| 16 to 19 Years | 20 (54.1%) | 1 (5.0%) |
| 20 to 24 Years | 55 (79.7%) | 0 (0.0%) |
| 25 to 29 Years | 42 (100.0%) | 12 (28.6%) |
| 30 to 34 Years | 38 (82.6%) | 5 (13.2%) |
| 35 to 44 Years | 93 (97.9%) | 0 (0.0%) |
| 45 to 54 Years | 109 (100.0%) | 0 (0.0%) |
| 55 to 59 Years | 57 (66.3%) | 0 (0.0%) |
| 60 to 64 Years | 42 (71.2%) | 0 (0.0%) |
| 65 to 74 Years | 26 (45.6%) | 2 (7.7%) |
| 75 Years and over | 0 (0.0%) | 0 (0.0%) |
| Total | 482 (78.0%) | 20 (4.1%) |
Employment Status by Educational Attainment in Retreat
According to labor force statistics for Retreat, 87.2% of individuals (381) out of the total population between 25 and 64 years of age (437) are in the labor force, with 4.5% or 17 of them being unemployed. The group with the highest labor force participation rate are those with the educational attainment of bachelor's degree or higher, with 94.6% or 35 individuals in the labor force. Within the labor force, individuals with high school diploma education have the highest percentage of unemployment, with 8.1% or 14 of them being unemployed.
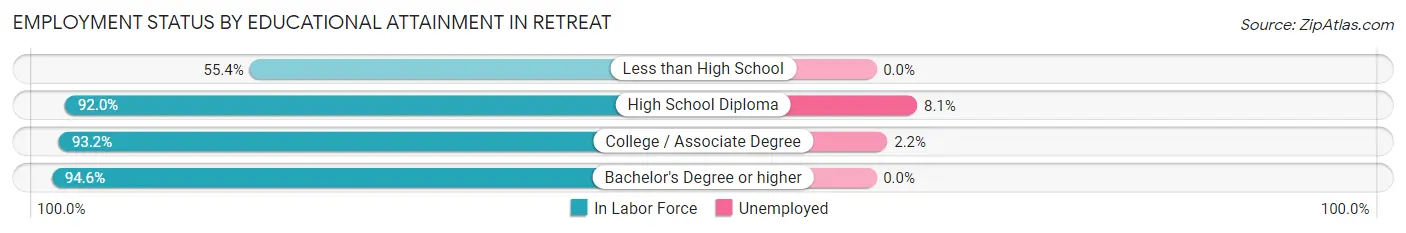
| Educational Attainment | In Labor Force | Unemployed |
| Less than High School | 36 (55.4%) | 0 (0.0%) |
| High School Diploma | 173 (92.0%) | 15 (8.1%) |
| College / Associate Degree | 137 (93.2%) | 3 (2.2%) |
| Bachelor's Degree or higher | 35 (94.6%) | 0 (0.0%) |
| Total | 381 (87.2%) | 20 (4.5%) |
Employment Occupations by Sex in Retreat
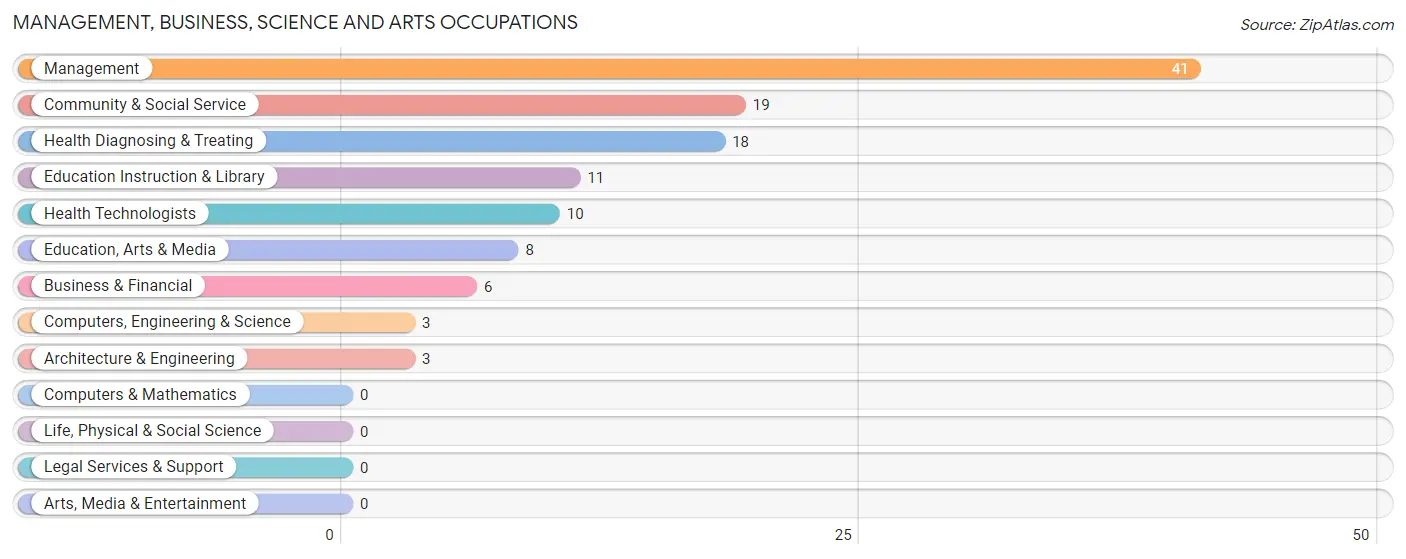
Management, Business, Science and Arts Occupations
The most common Management, Business, Science and Arts occupations in Retreat are Management (41 | 8.9%), Community & Social Service (19 | 4.1%), Health Diagnosing & Treating (18 | 3.9%), Education Instruction & Library (11 | 2.4%), and Health Technologists (10 | 2.2%).
Management, Business, Science and Arts Occupations by Sex
Within the Management, Business, Science and Arts occupations in Retreat, the most male-oriented occupations are Business & Financial (100.0%), Computers, Engineering & Science (100.0%), and Architecture & Engineering (100.0%), while the most female-oriented occupations are Health Diagnosing & Treating (100.0%), Health Technologists (100.0%), and Education Instruction & Library (81.8%).
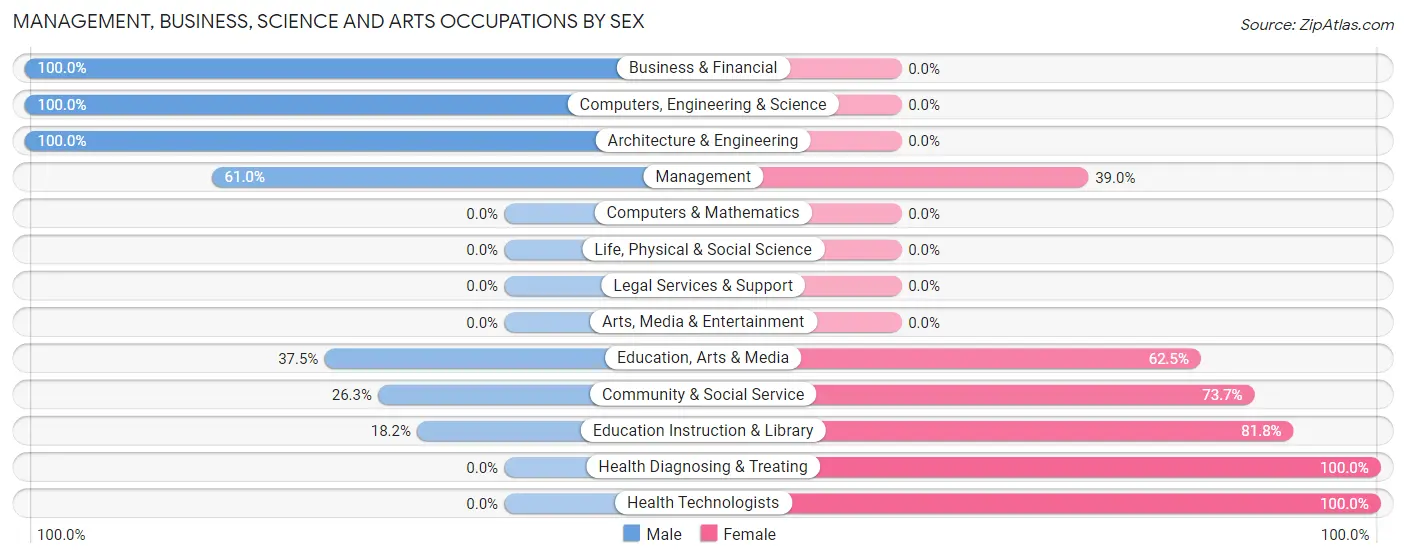
| Occupation | Male | Female |
| Management | 25 (61.0%) | 16 (39.0%) |
| Business & Financial | 6 (100.0%) | 0 (0.0%) |
| Computers, Engineering & Science | 3 (100.0%) | 0 (0.0%) |
| Computers & Mathematics | 0 (0.0%) | 0 (0.0%) |
| Architecture & Engineering | 3 (100.0%) | 0 (0.0%) |
| Life, Physical & Social Science | 0 (0.0%) | 0 (0.0%) |
| Community & Social Service | 5 (26.3%) | 14 (73.7%) |
| Education, Arts & Media | 3 (37.5%) | 5 (62.5%) |
| Legal Services & Support | 0 (0.0%) | 0 (0.0%) |
| Education Instruction & Library | 2 (18.2%) | 9 (81.8%) |
| Arts, Media & Entertainment | 0 (0.0%) | 0 (0.0%) |
| Health Diagnosing & Treating | 0 (0.0%) | 18 (100.0%) |
| Health Technologists | 0 (0.0%) | 10 (100.0%) |
| Total (Category) | 39 (44.8%) | 48 (55.2%) |
| Total (Overall) | 249 (53.9%) | 213 (46.1%) |
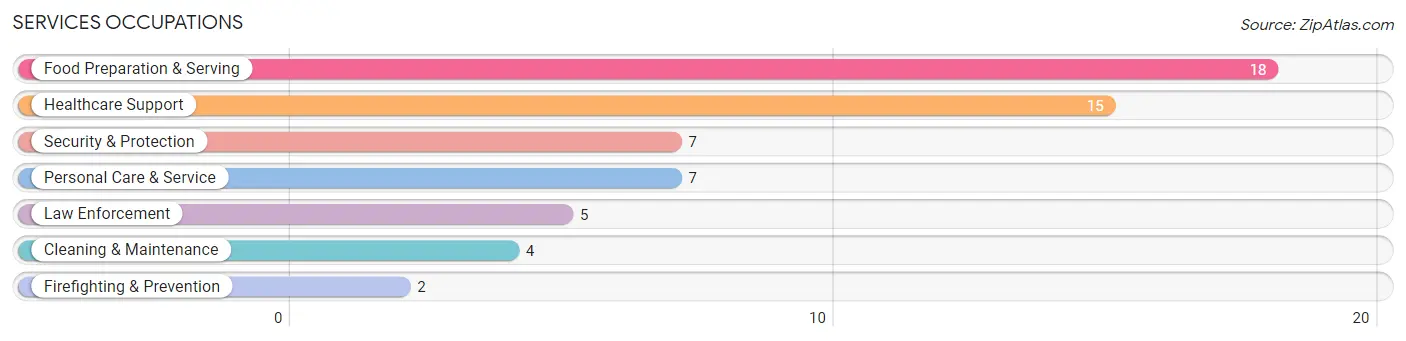
Services Occupations
The most common Services occupations in Retreat are Food Preparation & Serving (18 | 3.9%), Healthcare Support (15 | 3.3%), Security & Protection (7 | 1.5%), Personal Care & Service (7 | 1.5%), and Law Enforcement (5 | 1.1%).
Services Occupations by Sex
Within the Services occupations in Retreat, the most male-oriented occupations are Security & Protection (100.0%), Firefighting & Prevention (100.0%), and Law Enforcement (100.0%), while the most female-oriented occupations are Healthcare Support (100.0%), Personal Care & Service (100.0%), and Food Preparation & Serving (83.3%).
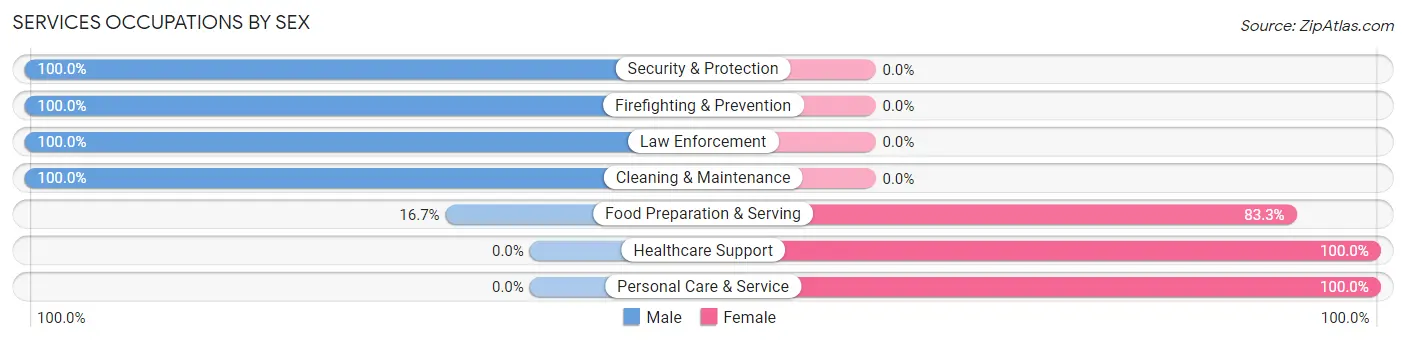
| Occupation | Male | Female |
| Healthcare Support | 0 (0.0%) | 15 (100.0%) |
| Security & Protection | 7 (100.0%) | 0 (0.0%) |
| Firefighting & Prevention | 2 (100.0%) | 0 (0.0%) |
| Law Enforcement | 5 (100.0%) | 0 (0.0%) |
| Food Preparation & Serving | 3 (16.7%) | 15 (83.3%) |
| Cleaning & Maintenance | 4 (100.0%) | 0 (0.0%) |
| Personal Care & Service | 0 (0.0%) | 7 (100.0%) |
| Total (Category) | 14 (27.5%) | 37 (72.6%) |
| Total (Overall) | 249 (53.9%) | 213 (46.1%) |
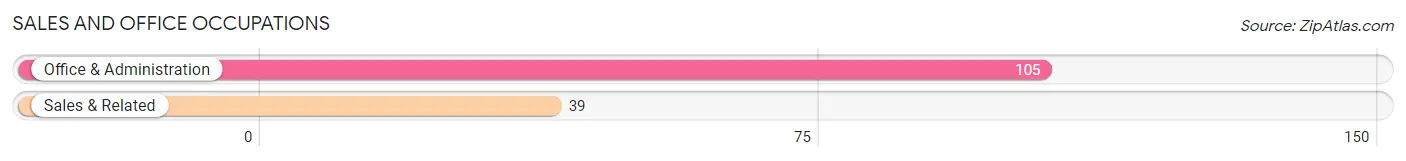
Sales and Office Occupations
The most common Sales and Office occupations in Retreat are Office & Administration (105 | 22.7%), and Sales & Related (39 | 8.4%).
Sales and Office Occupations by Sex
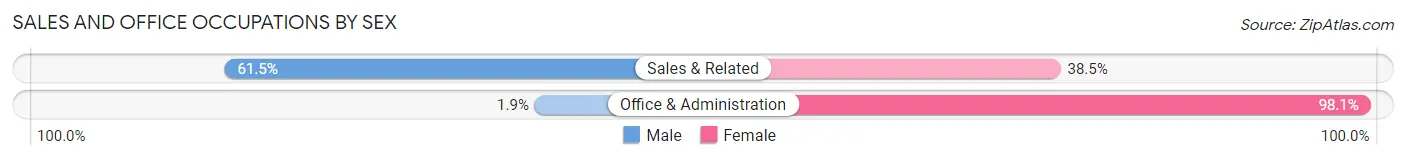
| Occupation | Male | Female |
| Sales & Related | 24 (61.5%) | 15 (38.5%) |
| Office & Administration | 2 (1.9%) | 103 (98.1%) |
| Total (Category) | 26 (18.1%) | 118 (81.9%) |
| Total (Overall) | 249 (53.9%) | 213 (46.1%) |
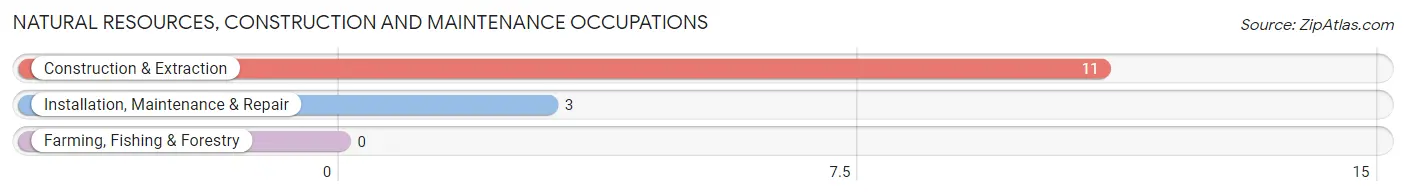
Natural Resources, Construction and Maintenance Occupations
The most common Natural Resources, Construction and Maintenance occupations in Retreat are Construction & Extraction (11 | 2.4%), and Installation, Maintenance & Repair (3 | 0.6%).
Natural Resources, Construction and Maintenance Occupations by Sex
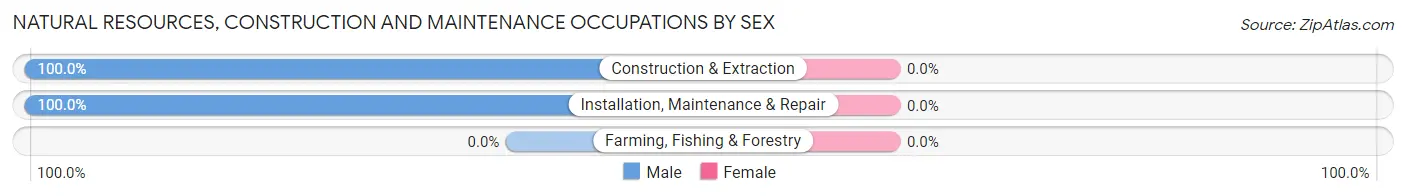
| Occupation | Male | Female |
| Farming, Fishing & Forestry | 0 (0.0%) | 0 (0.0%) |
| Construction & Extraction | 11 (100.0%) | 0 (0.0%) |
| Installation, Maintenance & Repair | 3 (100.0%) | 0 (0.0%) |
| Total (Category) | 14 (100.0%) | 0 (0.0%) |
| Total (Overall) | 249 (53.9%) | 213 (46.1%) |
Production, Transportation and Moving Occupations
The most common Production, Transportation and Moving occupations in Retreat are Production (98 | 21.2%), Material Moving (48 | 10.4%), and Transportation (20 | 4.3%).
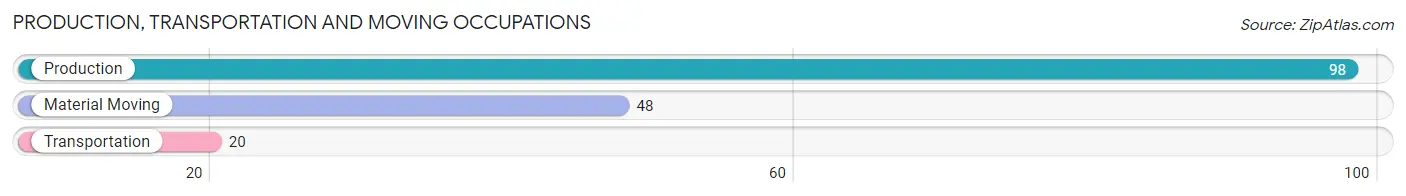
Production, Transportation and Moving Occupations by Sex
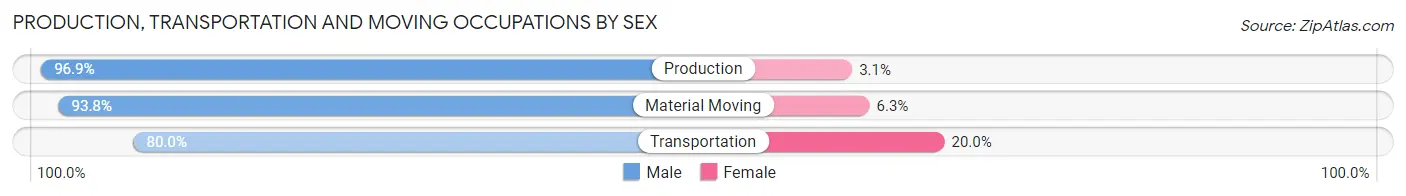
| Occupation | Male | Female |
| Production | 95 (96.9%) | 3 (3.1%) |
| Transportation | 16 (80.0%) | 4 (20.0%) |
| Material Moving | 45 (93.8%) | 3 (6.2%) |
| Total (Category) | 156 (94.0%) | 10 (6.0%) |
| Total (Overall) | 249 (53.9%) | 213 (46.1%) |
Employment Industries by Sex in Retreat
Employment Industries in Retreat
The major employment industries in Retreat include Manufacturing (121 | 26.2%), Public Administration (56 | 12.1%), Health Care & Social Assistance (55 | 11.9%), Educational Services (40 | 8.7%), and Retail Trade (39 | 8.4%).
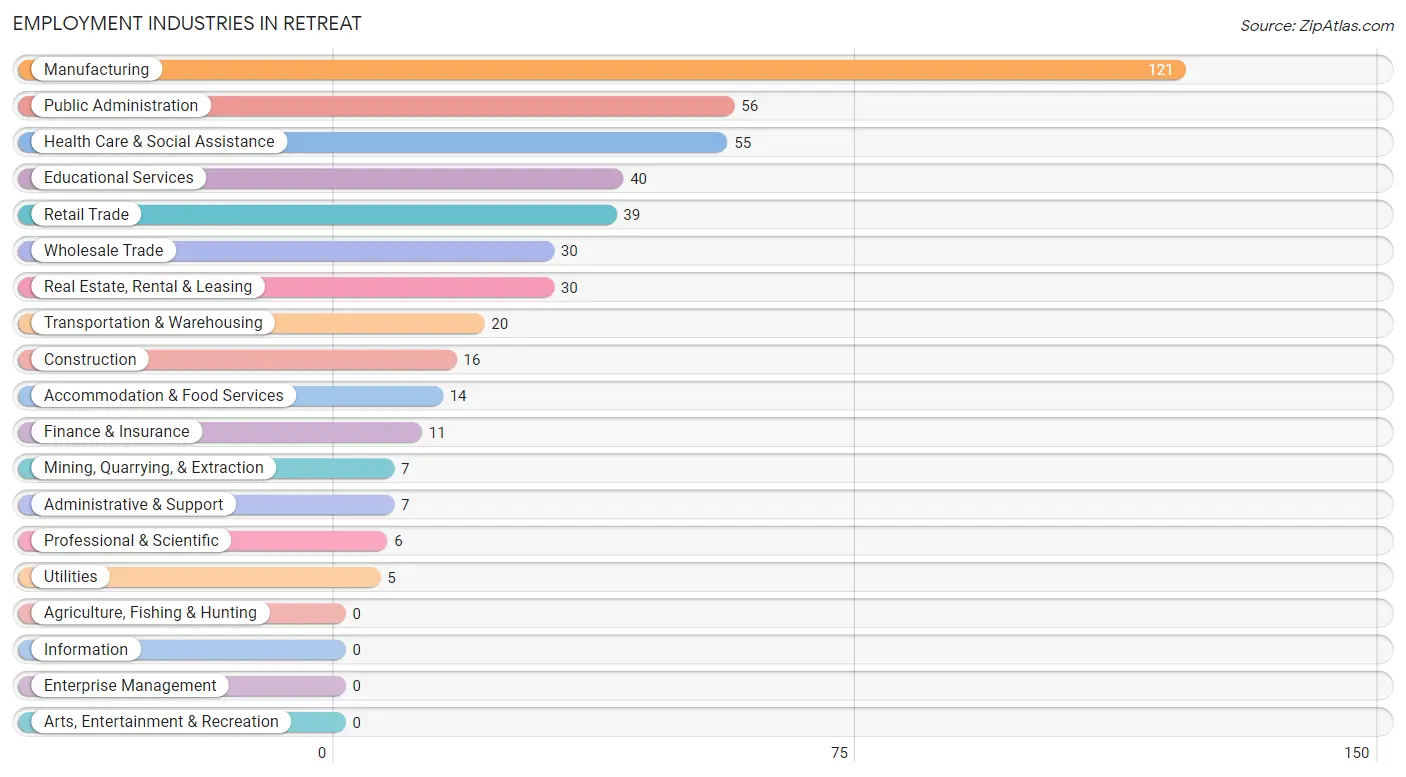
Employment Industries by Sex in Retreat
The Retreat industries that see more men than women are Mining, Quarrying, & Extraction (100.0%), Construction (100.0%), and Utilities (100.0%), whereas the industries that tend to have a higher number of women are Wholesale Trade (100.0%), Finance & Insurance (100.0%), and Administrative & Support (100.0%).
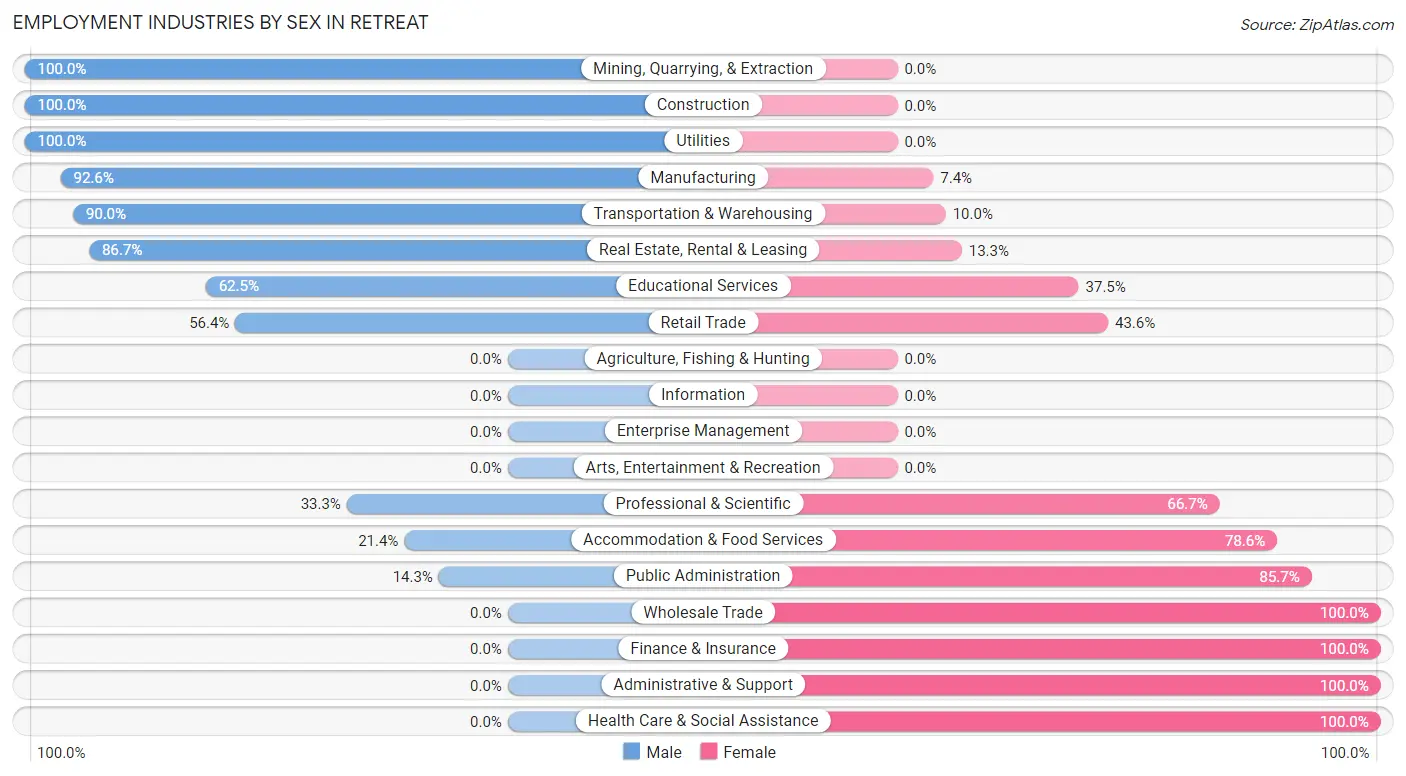
| Industry | Male | Female |
| Agriculture, Fishing & Hunting | 0 (0.0%) | 0 (0.0%) |
| Mining, Quarrying, & Extraction | 7 (100.0%) | 0 (0.0%) |
| Construction | 16 (100.0%) | 0 (0.0%) |
| Manufacturing | 112 (92.6%) | 9 (7.4%) |
| Wholesale Trade | 0 (0.0%) | 30 (100.0%) |
| Retail Trade | 22 (56.4%) | 17 (43.6%) |
| Transportation & Warehousing | 18 (90.0%) | 2 (10.0%) |
| Utilities | 5 (100.0%) | 0 (0.0%) |
| Information | 0 (0.0%) | 0 (0.0%) |
| Finance & Insurance | 0 (0.0%) | 11 (100.0%) |
| Real Estate, Rental & Leasing | 26 (86.7%) | 4 (13.3%) |
| Professional & Scientific | 2 (33.3%) | 4 (66.7%) |
| Enterprise Management | 0 (0.0%) | 0 (0.0%) |
| Administrative & Support | 0 (0.0%) | 7 (100.0%) |
| Educational Services | 25 (62.5%) | 15 (37.5%) |
| Health Care & Social Assistance | 0 (0.0%) | 55 (100.0%) |
| Arts, Entertainment & Recreation | 0 (0.0%) | 0 (0.0%) |
| Accommodation & Food Services | 3 (21.4%) | 11 (78.6%) |
| Public Administration | 8 (14.3%) | 48 (85.7%) |
| Total | 249 (53.9%) | 213 (46.1%) |
Education in Retreat
School Enrollment in Retreat
The most common levels of schooling among the 221 students in Retreat are college / undergraduate (77 | 34.8%), middle school (44 | 19.9%), and high school (27 | 12.2%).
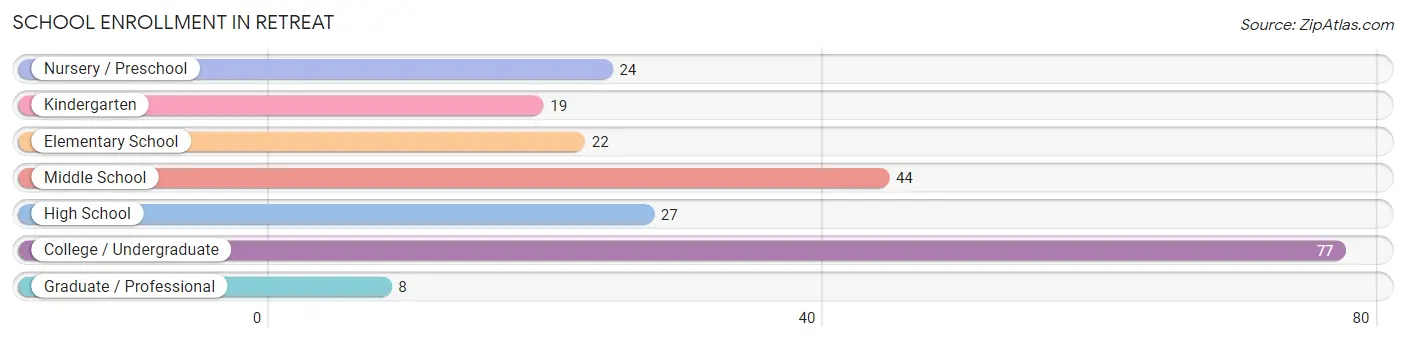
| School Level | # Students | % Students |
| Nursery / Preschool | 24 | 10.9% |
| Kindergarten | 19 | 8.6% |
| Elementary School | 22 | 10.0% |
| Middle School | 44 | 19.9% |
| High School | 27 | 12.2% |
| College / Undergraduate | 77 | 34.8% |
| Graduate / Professional | 8 | 3.6% |
| Total | 221 | 100.0% |
School Enrollment by Age by Funding Source in Retreat
Out of a total of 221 students who are enrolled in schools in Retreat, 30 (13.6%) attend a private institution, while the remaining 191 (86.4%) are enrolled in public schools. The age group of 3 to 4 year olds has the highest likelihood of being enrolled in private schools, with 20 (83.3% in the age bracket) enrolled. Conversely, the age group of 18 to 19 year olds has the lowest likelihood of being enrolled in a private school, with 19 (100.0% in the age bracket) attending a public institution.
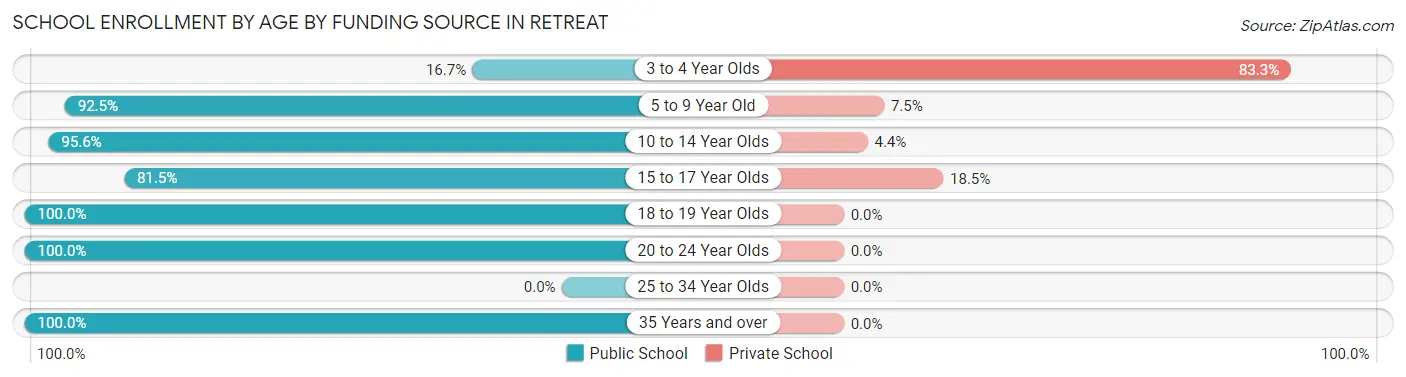
| Age Bracket | Public School | Private School |
| 3 to 4 Year Olds | 4 (16.7%) | 20 (83.3%) |
| 5 to 9 Year Old | 37 (92.5%) | 3 (7.5%) |
| 10 to 14 Year Olds | 43 (95.6%) | 2 (4.4%) |
| 15 to 17 Year Olds | 22 (81.5%) | 5 (18.5%) |
| 18 to 19 Year Olds | 19 (100.0%) | 0 (0.0%) |
| 20 to 24 Year Olds | 58 (100.0%) | 0 (0.0%) |
| 25 to 34 Year Olds | 0 (0.0%) | 0 (0.0%) |
| 35 Years and over | 8 (100.0%) | 0 (0.0%) |
| Total | 191 (86.4%) | 30 (13.6%) |
Educational Attainment by Field of Study in Retreat
Education (14 | 29.8%), visual & performing arts (8 | 17.0%), science & technology (6 | 12.8%), arts & humanities (4 | 8.5%), and bio, nature & agricultural (3 | 6.4%) are the most common fields of study among 47 individuals in Retreat who have obtained a bachelor's degree or higher.
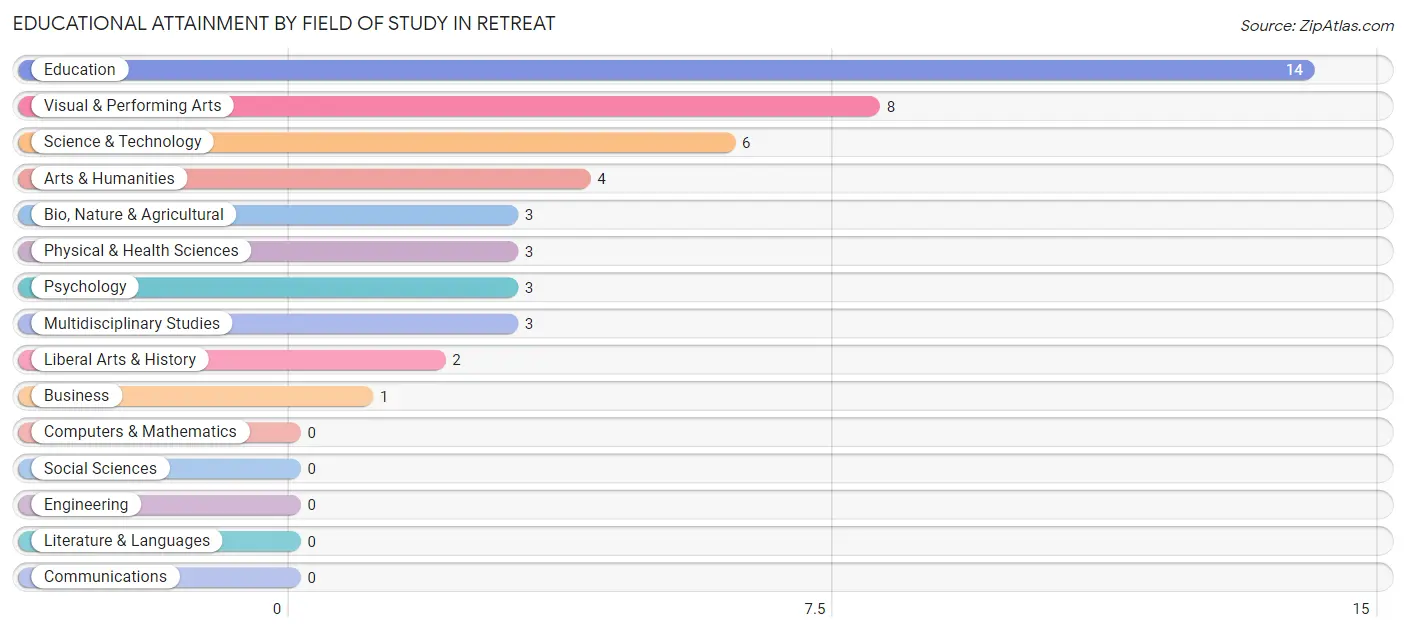
| Field of Study | # Graduates | % Graduates |
| Computers & Mathematics | 0 | 0.0% |
| Bio, Nature & Agricultural | 3 | 6.4% |
| Physical & Health Sciences | 3 | 6.4% |
| Psychology | 3 | 6.4% |
| Social Sciences | 0 | 0.0% |
| Engineering | 0 | 0.0% |
| Multidisciplinary Studies | 3 | 6.4% |
| Science & Technology | 6 | 12.8% |
| Business | 1 | 2.1% |
| Education | 14 | 29.8% |
| Literature & Languages | 0 | 0.0% |
| Liberal Arts & History | 2 | 4.3% |
| Visual & Performing Arts | 8 | 17.0% |
| Communications | 0 | 0.0% |
| Arts & Humanities | 4 | 8.5% |
| Total | 47 | 100.0% |
Transportation & Commute in Retreat
Vehicle Availability by Sex in Retreat
The most prevalent vehicle ownership categories in Retreat are males with 4 vehicles (114, accounting for 45.8%) and females with 4 vehicles (60, making up 53.5%).
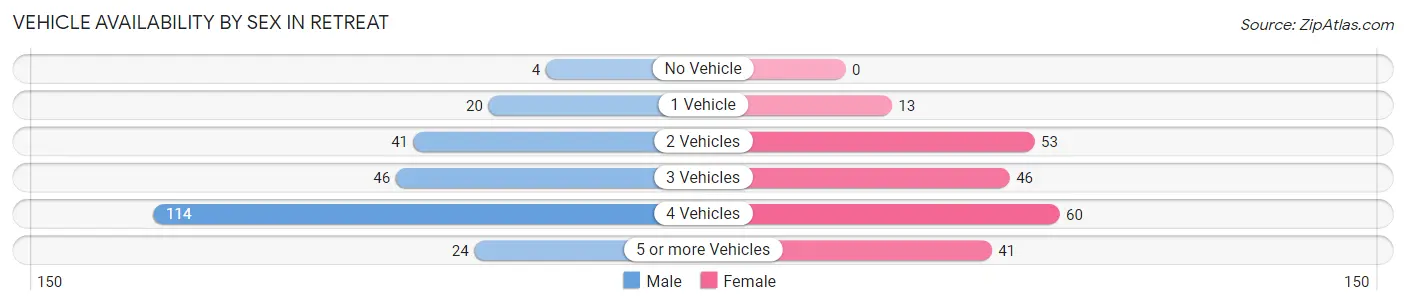
| Vehicles Available | Male | Female |
| No Vehicle | 4 (1.6%) | 0 (0.0%) |
| 1 Vehicle | 20 (8.0%) | 13 (6.1%) |
| 2 Vehicles | 41 (16.5%) | 53 (24.9%) |
| 3 Vehicles | 46 (18.5%) | 46 (21.6%) |
| 4 Vehicles | 114 (45.8%) | 60 (28.2%) |
| 5 or more Vehicles | 24 (9.6%) | 41 (19.3%) |
| Total | 249 (100.0%) | 213 (100.0%) |
Commute Time in Retreat
The most frequently occuring commute durations in Retreat are 10 to 14 minutes (138 commuters, 32.6%), 15 to 19 minutes (118 commuters, 27.8%), and 5 to 9 minutes (37 commuters, 8.7%).
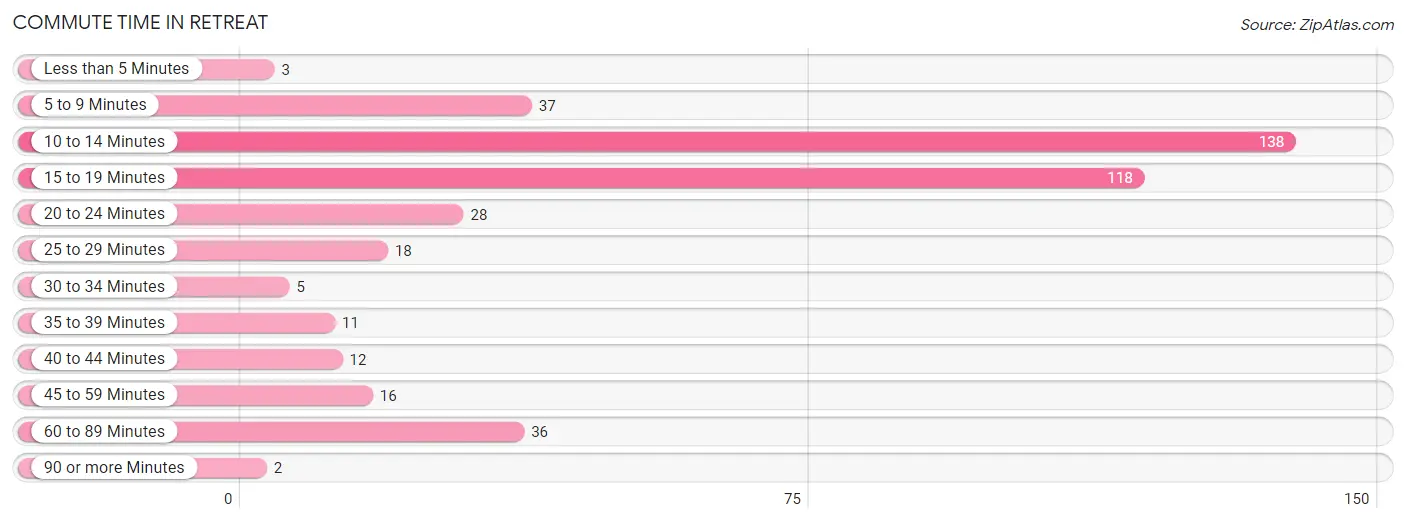
| Commute Time | # Commuters | % Commuters |
| Less than 5 Minutes | 3 | 0.7% |
| 5 to 9 Minutes | 37 | 8.7% |
| 10 to 14 Minutes | 138 | 32.6% |
| 15 to 19 Minutes | 118 | 27.8% |
| 20 to 24 Minutes | 28 | 6.6% |
| 25 to 29 Minutes | 18 | 4.3% |
| 30 to 34 Minutes | 5 | 1.2% |
| 35 to 39 Minutes | 11 | 2.6% |
| 40 to 44 Minutes | 12 | 2.8% |
| 45 to 59 Minutes | 16 | 3.8% |
| 60 to 89 Minutes | 36 | 8.5% |
| 90 or more Minutes | 2 | 0.5% |
Commute Time by Sex in Retreat
The most common commute times in Retreat are 15 to 19 minutes (97 commuters, 39.6%) for males and 10 to 14 minutes (66 commuters, 36.9%) for females.
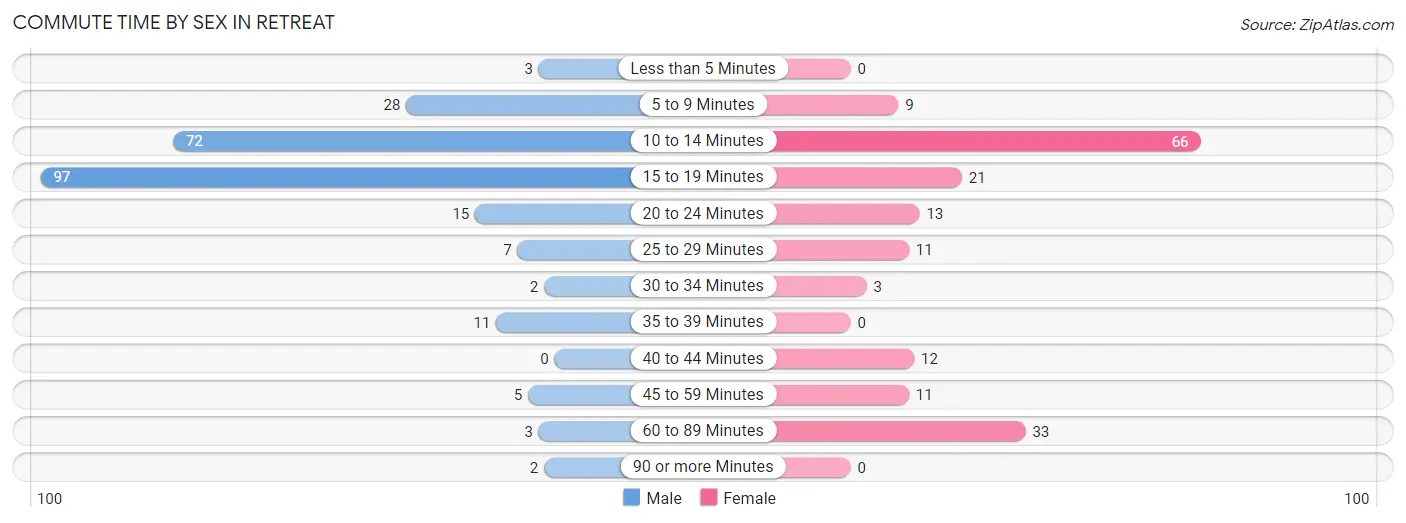
| Commute Time | Male | Female |
| Less than 5 Minutes | 3 (1.2%) | 0 (0.0%) |
| 5 to 9 Minutes | 28 (11.4%) | 9 (5.0%) |
| 10 to 14 Minutes | 72 (29.4%) | 66 (36.9%) |
| 15 to 19 Minutes | 97 (39.6%) | 21 (11.7%) |
| 20 to 24 Minutes | 15 (6.1%) | 13 (7.3%) |
| 25 to 29 Minutes | 7 (2.9%) | 11 (6.1%) |
| 30 to 34 Minutes | 2 (0.8%) | 3 (1.7%) |
| 35 to 39 Minutes | 11 (4.5%) | 0 (0.0%) |
| 40 to 44 Minutes | 0 (0.0%) | 12 (6.7%) |
| 45 to 59 Minutes | 5 (2.0%) | 11 (6.1%) |
| 60 to 89 Minutes | 3 (1.2%) | 33 (18.4%) |
| 90 or more Minutes | 2 (0.8%) | 0 (0.0%) |
Time of Departure to Work by Sex in Retreat
The most frequent times of departure to work in Retreat are 4:00 PM to 11:59 PM (71, 29.0%) for males and 7:00 AM to 7:29 AM (68, 38.0%) for females.
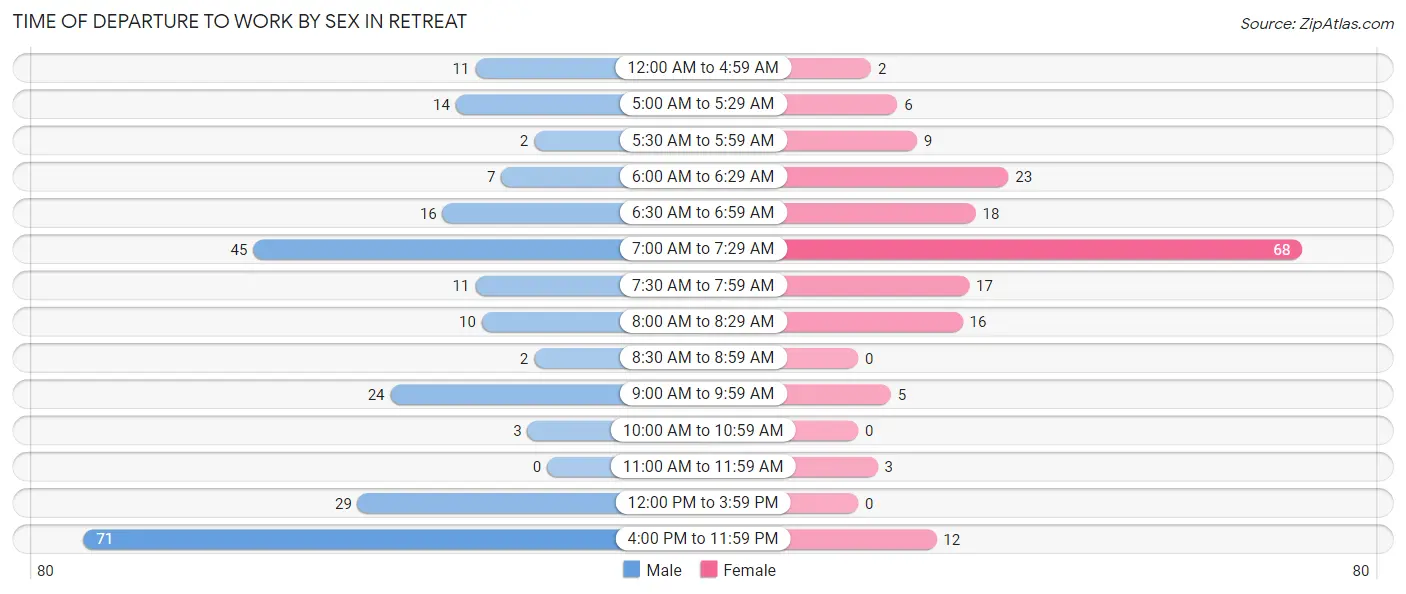
| Time of Departure | Male | Female |
| 12:00 AM to 4:59 AM | 11 (4.5%) | 2 (1.1%) |
| 5:00 AM to 5:29 AM | 14 (5.7%) | 6 (3.4%) |
| 5:30 AM to 5:59 AM | 2 (0.8%) | 9 (5.0%) |
| 6:00 AM to 6:29 AM | 7 (2.9%) | 23 (12.9%) |
| 6:30 AM to 6:59 AM | 16 (6.5%) | 18 (10.1%) |
| 7:00 AM to 7:29 AM | 45 (18.4%) | 68 (38.0%) |
| 7:30 AM to 7:59 AM | 11 (4.5%) | 17 (9.5%) |
| 8:00 AM to 8:29 AM | 10 (4.1%) | 16 (8.9%) |
| 8:30 AM to 8:59 AM | 2 (0.8%) | 0 (0.0%) |
| 9:00 AM to 9:59 AM | 24 (9.8%) | 5 (2.8%) |
| 10:00 AM to 10:59 AM | 3 (1.2%) | 0 (0.0%) |
| 11:00 AM to 11:59 AM | 0 (0.0%) | 3 (1.7%) |
| 12:00 PM to 3:59 PM | 29 (11.8%) | 0 (0.0%) |
| 4:00 PM to 11:59 PM | 71 (29.0%) | 12 (6.7%) |
| Total | 245 (100.0%) | 179 (100.0%) |
Housing Occupancy in Retreat
Occupancy by Ownership in Retreat
Of the total 243 dwellings in Retreat, owner-occupied units account for 221 (90.9%), while renter-occupied units make up 22 (9.0%).
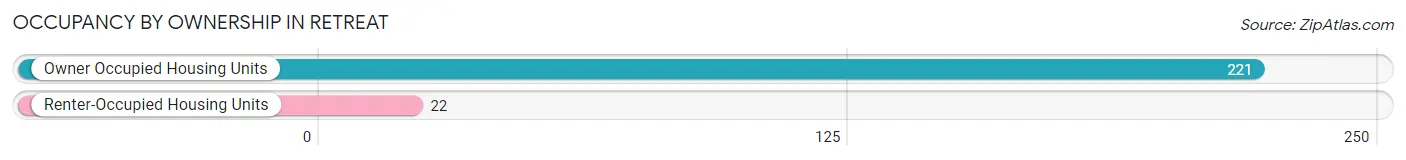
| Occupancy | # Housing Units | % Housing Units |
| Owner Occupied Housing Units | 221 | 90.9% |
| Renter-Occupied Housing Units | 22 | 9.0% |
| Total Occupied Housing Units | 243 | 100.0% |
Occupancy by Household Size in Retreat
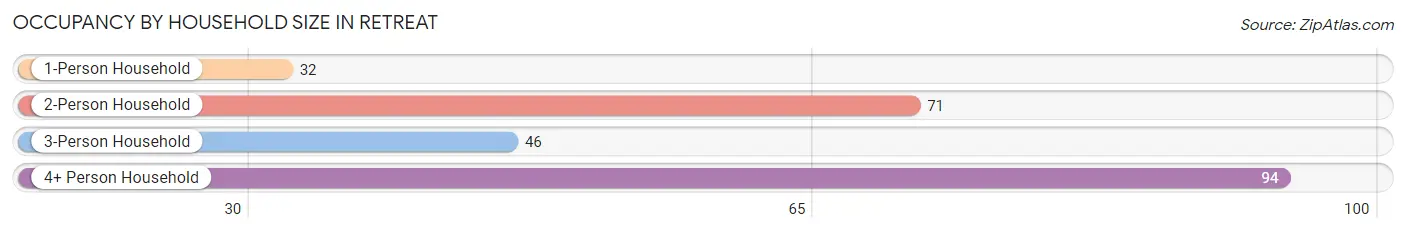
| Household Size | # Housing Units | % Housing Units |
| 1-Person Household | 32 | 13.2% |
| 2-Person Household | 71 | 29.2% |
| 3-Person Household | 46 | 18.9% |
| 4+ Person Household | 94 | 38.7% |
| Total Housing Units | 243 | 100.0% |
Occupancy by Ownership by Household Size in Retreat
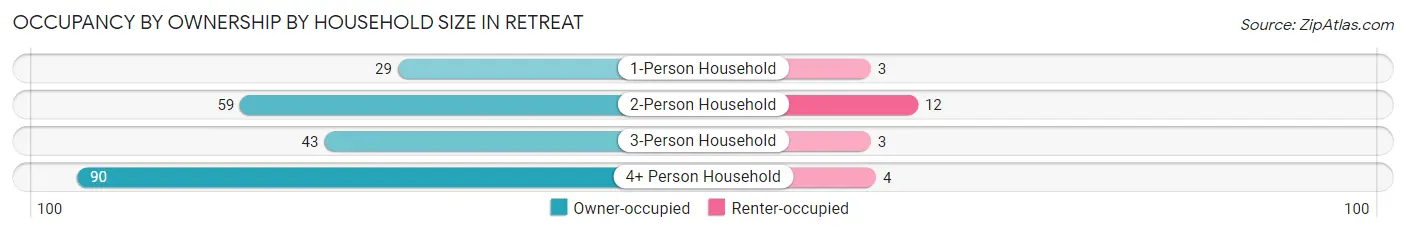
| Household Size | Owner-occupied | Renter-occupied |
| 1-Person Household | 29 (90.6%) | 3 (9.4%) |
| 2-Person Household | 59 (83.1%) | 12 (16.9%) |
| 3-Person Household | 43 (93.5%) | 3 (6.5%) |
| 4+ Person Household | 90 (95.7%) | 4 (4.3%) |
| Total Housing Units | 221 (90.9%) | 22 (9.0%) |
Occupancy by Educational Attainment in Retreat
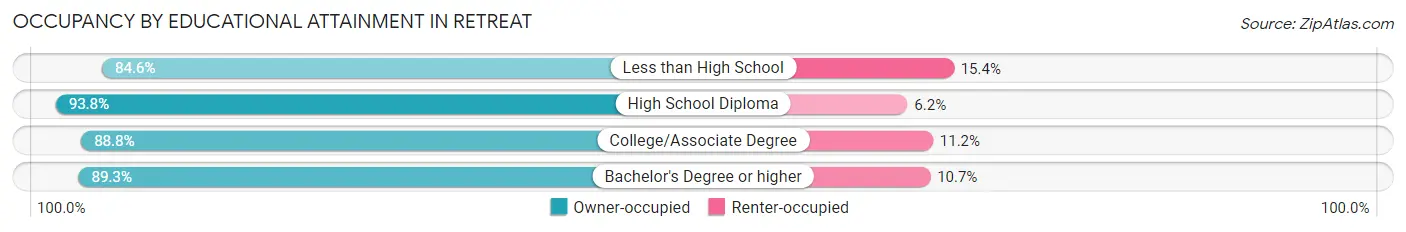
| Household Size | Owner-occupied | Renter-occupied |
| Less than High School | 11 (84.6%) | 2 (15.4%) |
| High School Diploma | 106 (93.8%) | 7 (6.2%) |
| College/Associate Degree | 79 (88.8%) | 10 (11.2%) |
| Bachelor's Degree or higher | 25 (89.3%) | 3 (10.7%) |
Occupancy by Age of Householder in Retreat
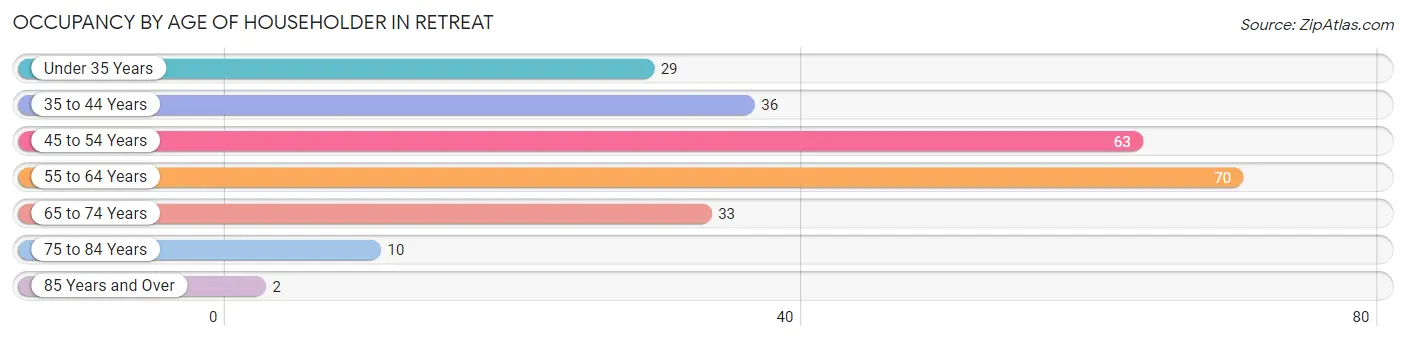
| Age Bracket | # Households | % Households |
| Under 35 Years | 29 | 11.9% |
| 35 to 44 Years | 36 | 14.8% |
| 45 to 54 Years | 63 | 25.9% |
| 55 to 64 Years | 70 | 28.8% |
| 65 to 74 Years | 33 | 13.6% |
| 75 to 84 Years | 10 | 4.1% |
| 85 Years and Over | 2 | 0.8% |
| Total | 243 | 100.0% |
Housing Finances in Retreat
Median Income by Occupancy in Retreat
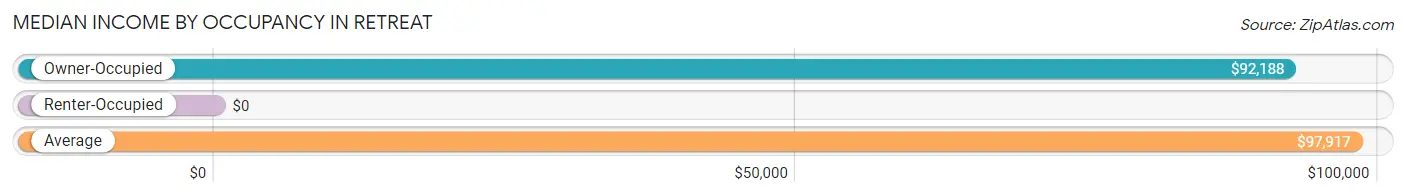
| Occupancy Type | # Households | Median Income |
| Owner-Occupied | 221 (90.9%) | $92,188 |
| Renter-Occupied | 22 (9.0%) | $0 |
| Average | 243 (100.0%) | $97,917 |
Occupancy by Householder Income Bracket in Retreat
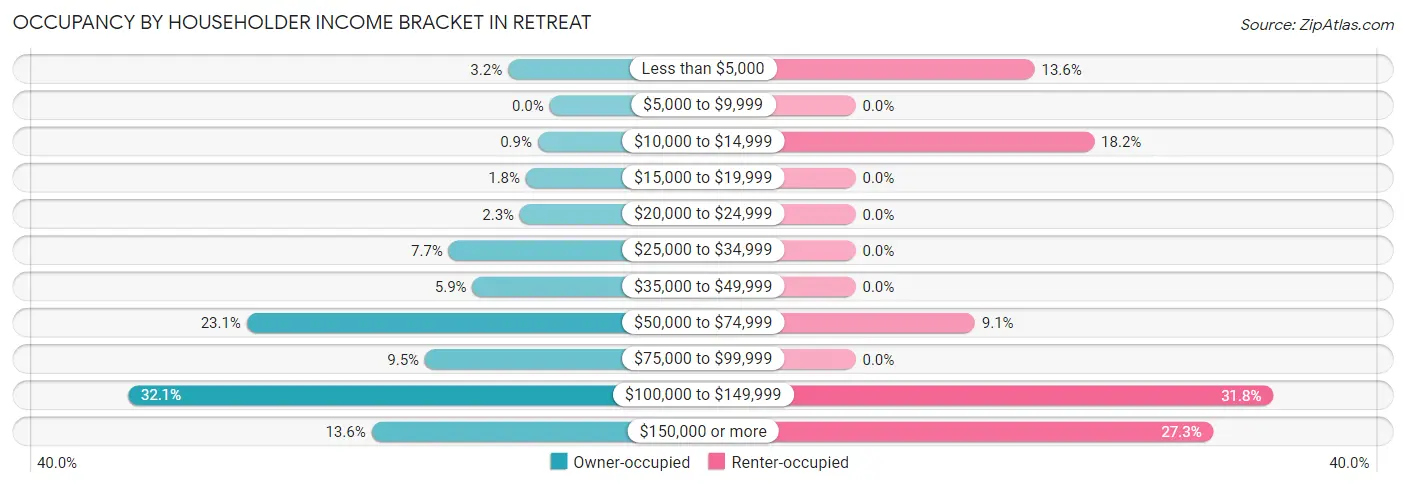
| Income Bracket | Owner-occupied | Renter-occupied |
| Less than $5,000 | 7 (3.2%) | 3 (13.6%) |
| $5,000 to $9,999 | 0 (0.0%) | 0 (0.0%) |
| $10,000 to $14,999 | 2 (0.9%) | 4 (18.2%) |
| $15,000 to $19,999 | 4 (1.8%) | 0 (0.0%) |
| $20,000 to $24,999 | 5 (2.3%) | 0 (0.0%) |
| $25,000 to $34,999 | 17 (7.7%) | 0 (0.0%) |
| $35,000 to $49,999 | 13 (5.9%) | 0 (0.0%) |
| $50,000 to $74,999 | 51 (23.1%) | 2 (9.1%) |
| $75,000 to $99,999 | 21 (9.5%) | 0 (0.0%) |
| $100,000 to $149,999 | 71 (32.1%) | 7 (31.8%) |
| $150,000 or more | 30 (13.6%) | 6 (27.3%) |
| Total | 221 (100.0%) | 22 (100.0%) |
Monthly Housing Cost Tiers in Retreat
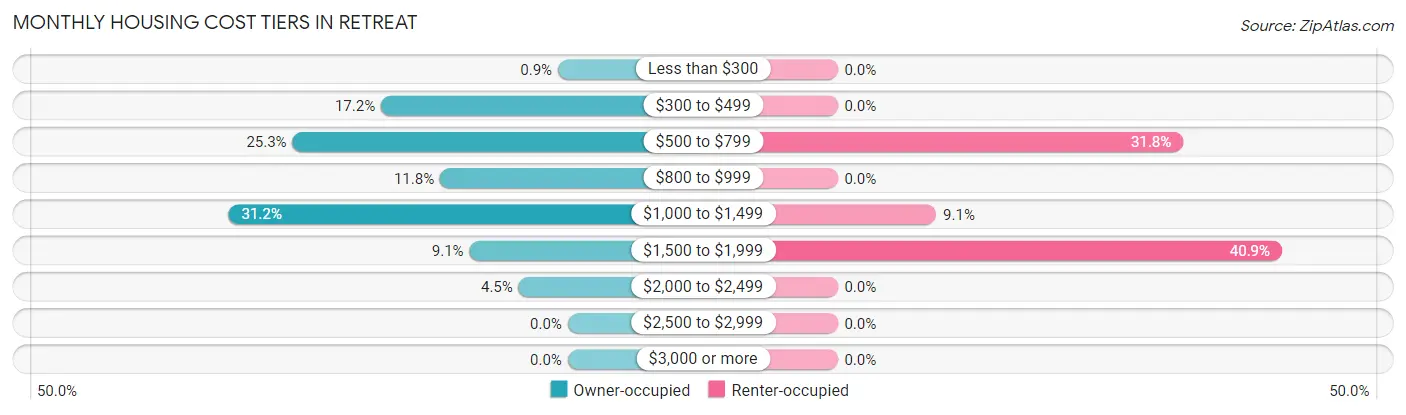
| Monthly Cost | Owner-occupied | Renter-occupied |
| Less than $300 | 2 (0.9%) | 0 (0.0%) |
| $300 to $499 | 38 (17.2%) | 0 (0.0%) |
| $500 to $799 | 56 (25.3%) | 7 (31.8%) |
| $800 to $999 | 26 (11.8%) | 0 (0.0%) |
| $1,000 to $1,499 | 69 (31.2%) | 2 (9.1%) |
| $1,500 to $1,999 | 20 (9.0%) | 9 (40.9%) |
| $2,000 to $2,499 | 10 (4.5%) | 0 (0.0%) |
| $2,500 to $2,999 | 0 (0.0%) | 0 (0.0%) |
| $3,000 or more | 0 (0.0%) | 0 (0.0%) |
| Total | 221 (100.0%) | 22 (100.0%) |
Physical Housing Characteristics in Retreat
Housing Structures in Retreat
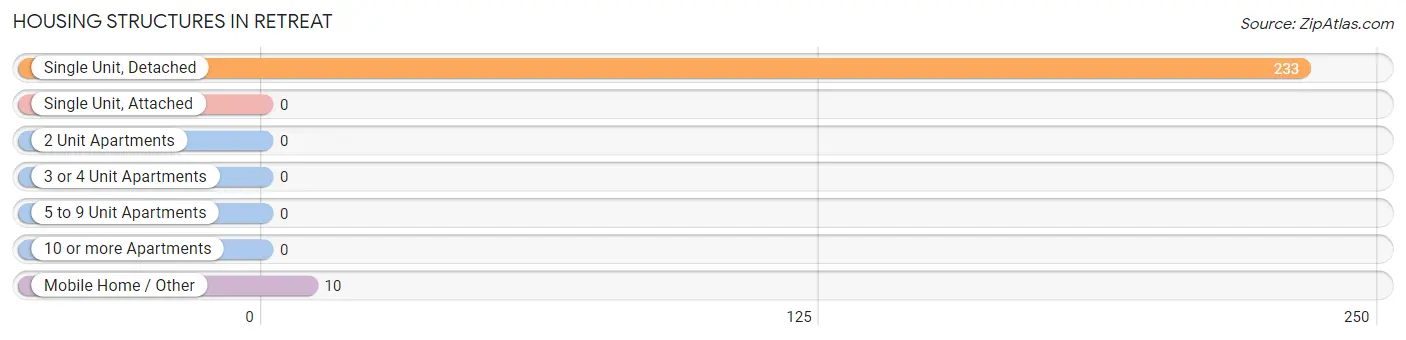
| Structure Type | # Housing Units | % Housing Units |
| Single Unit, Detached | 233 | 95.9% |
| Single Unit, Attached | 0 | 0.0% |
| 2 Unit Apartments | 0 | 0.0% |
| 3 or 4 Unit Apartments | 0 | 0.0% |
| 5 to 9 Unit Apartments | 0 | 0.0% |
| 10 or more Apartments | 0 | 0.0% |
| Mobile Home / Other | 10 | 4.1% |
| Total | 243 | 100.0% |
Housing Structures by Occupancy in Retreat
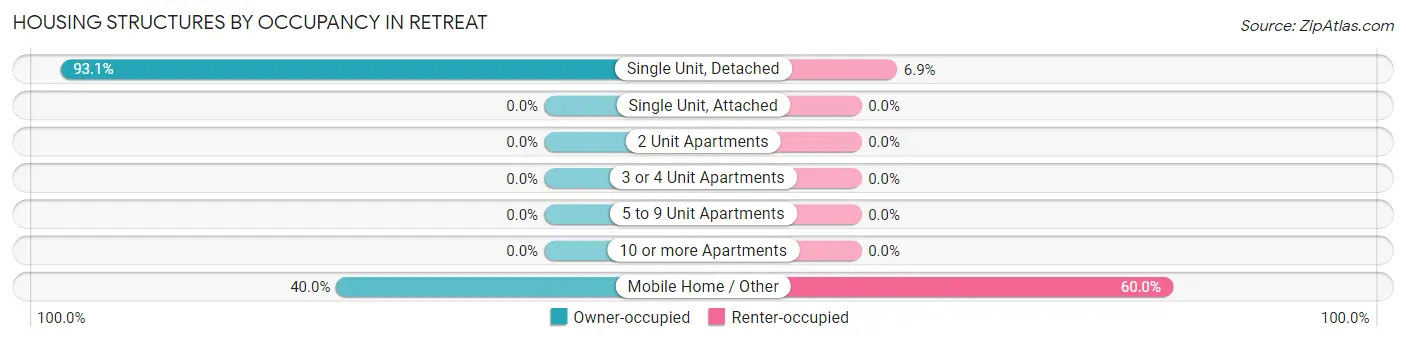
| Structure Type | Owner-occupied | Renter-occupied |
| Single Unit, Detached | 217 (93.1%) | 16 (6.9%) |
| Single Unit, Attached | 0 (0.0%) | 0 (0.0%) |
| 2 Unit Apartments | 0 (0.0%) | 0 (0.0%) |
| 3 or 4 Unit Apartments | 0 (0.0%) | 0 (0.0%) |
| 5 to 9 Unit Apartments | 0 (0.0%) | 0 (0.0%) |
| 10 or more Apartments | 0 (0.0%) | 0 (0.0%) |
| Mobile Home / Other | 4 (40.0%) | 6 (60.0%) |
| Total | 221 (90.9%) | 22 (9.0%) |
Housing Structures by Number of Rooms in Retreat
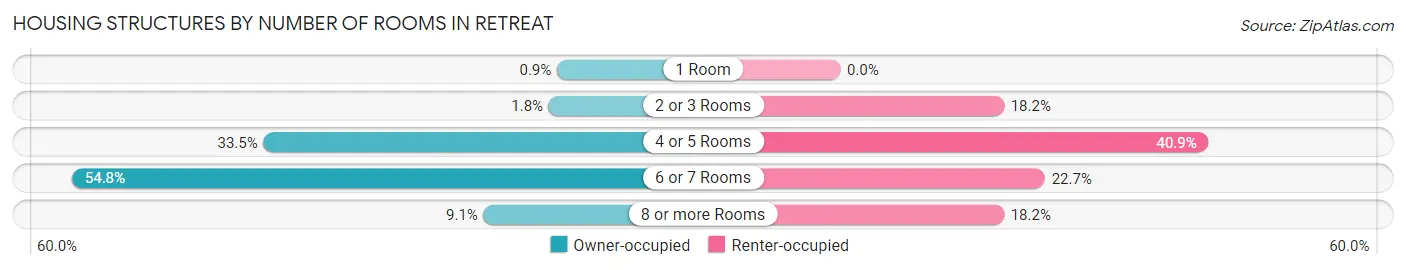
| Number of Rooms | Owner-occupied | Renter-occupied |
| 1 Room | 2 (0.9%) | 0 (0.0%) |
| 2 or 3 Rooms | 4 (1.8%) | 4 (18.2%) |
| 4 or 5 Rooms | 74 (33.5%) | 9 (40.9%) |
| 6 or 7 Rooms | 121 (54.7%) | 5 (22.7%) |
| 8 or more Rooms | 20 (9.0%) | 4 (18.2%) |
| Total | 221 (100.0%) | 22 (100.0%) |
Housing Structure by Heating Type in Retreat
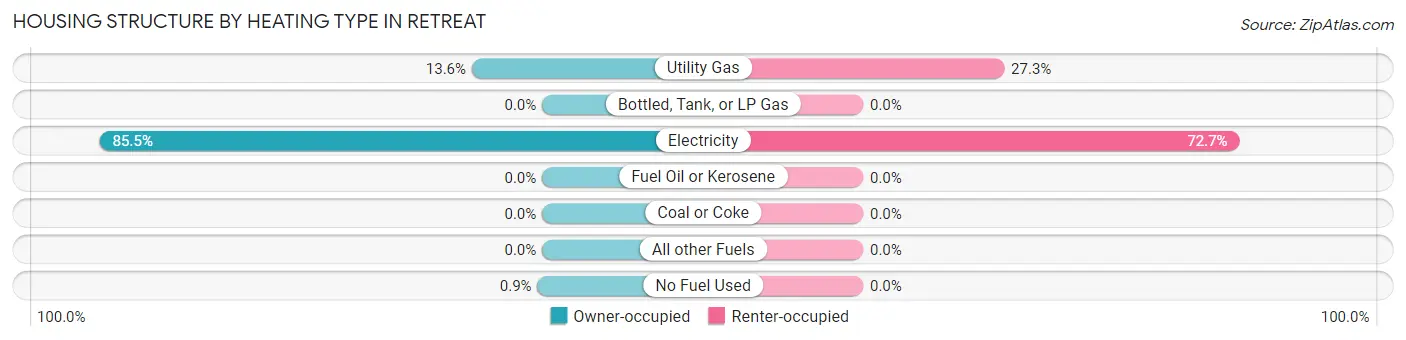
| Heating Type | Owner-occupied | Renter-occupied |
| Utility Gas | 30 (13.6%) | 6 (27.3%) |
| Bottled, Tank, or LP Gas | 0 (0.0%) | 0 (0.0%) |
| Electricity | 189 (85.5%) | 16 (72.7%) |
| Fuel Oil or Kerosene | 0 (0.0%) | 0 (0.0%) |
| Coal or Coke | 0 (0.0%) | 0 (0.0%) |
| All other Fuels | 0 (0.0%) | 0 (0.0%) |
| No Fuel Used | 2 (0.9%) | 0 (0.0%) |
| Total | 221 (100.0%) | 22 (100.0%) |
Household Vehicle Usage in Retreat
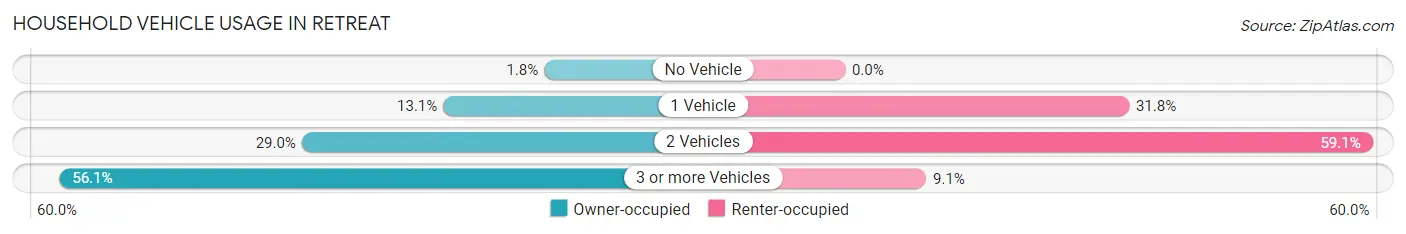
| Vehicles per Household | Owner-occupied | Renter-occupied |
| No Vehicle | 4 (1.8%) | 0 (0.0%) |
| 1 Vehicle | 29 (13.1%) | 7 (31.8%) |
| 2 Vehicles | 64 (29.0%) | 13 (59.1%) |
| 3 or more Vehicles | 124 (56.1%) | 2 (9.1%) |
| Total | 221 (100.0%) | 22 (100.0%) |
Real Estate & Mortgages in Retreat
Real Estate and Mortgage Overview in Retreat
| Characteristic | Without Mortgage | With Mortgage |
| Housing Units | 109 | 112 |
| Median Property Value | $119,900 | $191,300 |
| Median Household Income | $71,563 | $8 |
| Monthly Housing Costs | $566 | $0 |
| Real Estate Taxes | $1,763 | $0 |
Property Value by Mortgage Status in Retreat
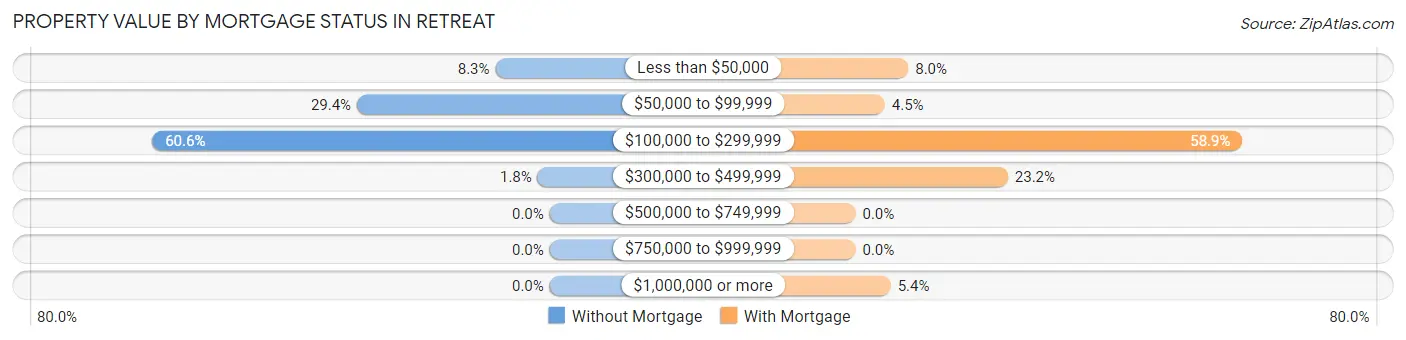
| Property Value | Without Mortgage | With Mortgage |
| Less than $50,000 | 9 (8.3%) | 9 (8.0%) |
| $50,000 to $99,999 | 32 (29.4%) | 5 (4.5%) |
| $100,000 to $299,999 | 66 (60.6%) | 66 (58.9%) |
| $300,000 to $499,999 | 2 (1.8%) | 26 (23.2%) |
| $500,000 to $749,999 | 0 (0.0%) | 0 (0.0%) |
| $750,000 to $999,999 | 0 (0.0%) | 0 (0.0%) |
| $1,000,000 or more | 0 (0.0%) | 6 (5.4%) |
| Total | 109 (100.0%) | 112 (100.0%) |
Household Income by Mortgage Status in Retreat
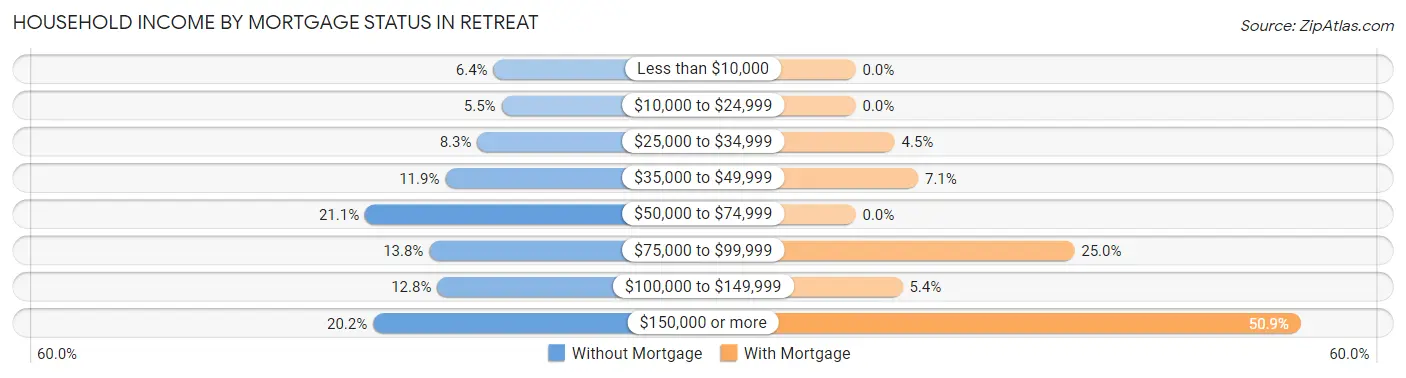
| Household Income | Without Mortgage | With Mortgage |
| Less than $10,000 | 7 (6.4%) | 0 (0.0%) |
| $10,000 to $24,999 | 6 (5.5%) | 0 (0.0%) |
| $25,000 to $34,999 | 9 (8.3%) | 5 (4.5%) |
| $35,000 to $49,999 | 13 (11.9%) | 8 (7.1%) |
| $50,000 to $74,999 | 23 (21.1%) | 0 (0.0%) |
| $75,000 to $99,999 | 15 (13.8%) | 28 (25.0%) |
| $100,000 to $149,999 | 14 (12.8%) | 6 (5.4%) |
| $150,000 or more | 22 (20.2%) | 57 (50.9%) |
| Total | 109 (100.0%) | 112 (100.0%) |
Property Value to Household Income Ratio in Retreat
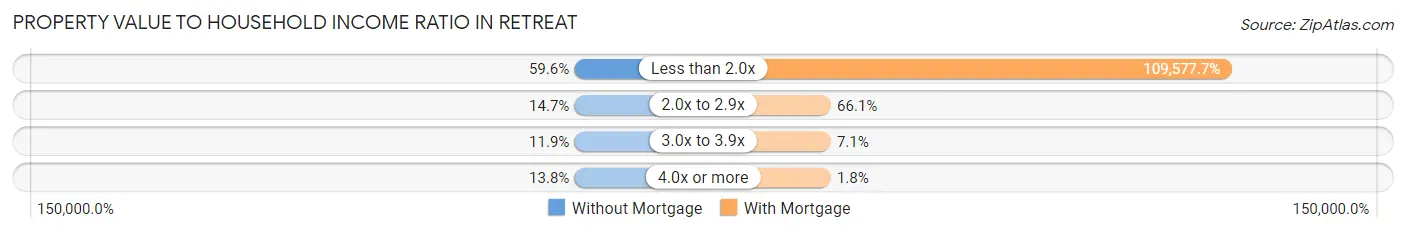
| Value-to-Income Ratio | Without Mortgage | With Mortgage |
| Less than 2.0x | 65 (59.6%) | 122,727 (109,577.7%) |
| 2.0x to 2.9x | 16 (14.7%) | 74 (66.1%) |
| 3.0x to 3.9x | 13 (11.9%) | 8 (7.1%) |
| 4.0x or more | 15 (13.8%) | 2 (1.8%) |
| Total | 109 (100.0%) | 112 (100.0%) |
Real Estate Taxes by Mortgage Status in Retreat
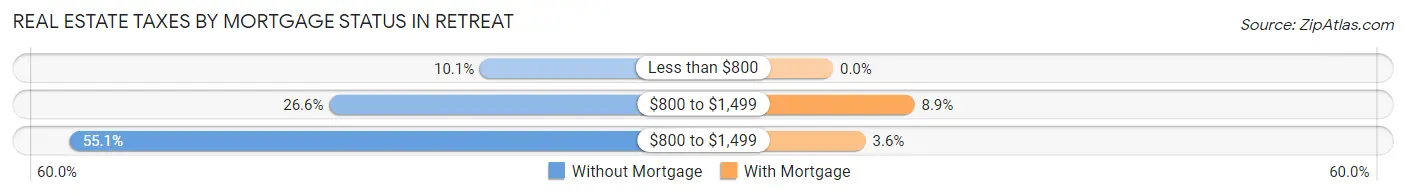
| Property Taxes | Without Mortgage | With Mortgage |
| Less than $800 | 11 (10.1%) | 0 (0.0%) |
| $800 to $1,499 | 29 (26.6%) | 10 (8.9%) |
| $800 to $1,499 | 60 (55.0%) | 4 (3.6%) |
| Total | 109 (100.0%) | 112 (100.0%) |
Health & Disability in Retreat
Health Insurance Coverage by Age in Retreat
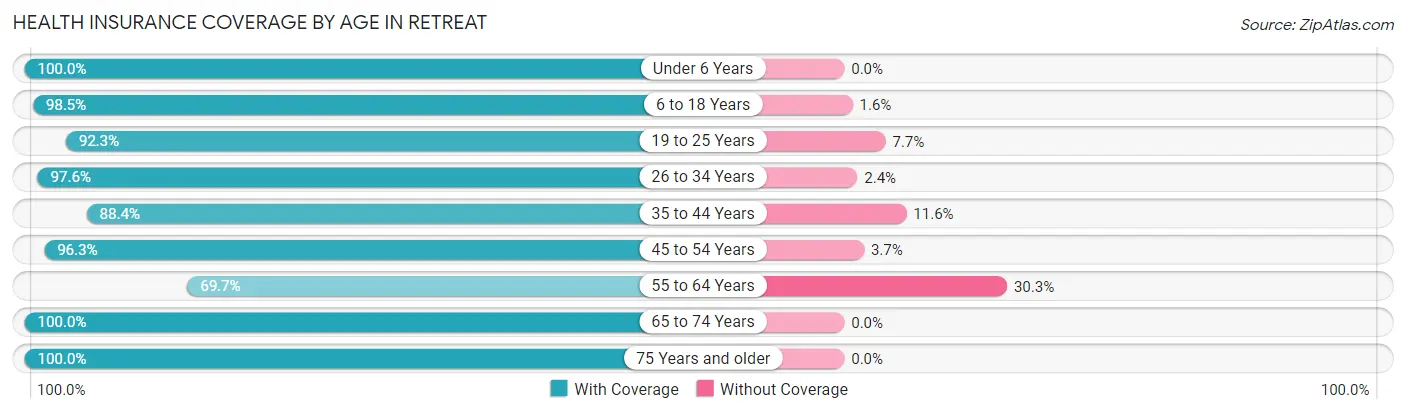
| Age Bracket | With Coverage | Without Coverage |
| Under 6 Years | 36 (100.0%) | 0 (0.0%) |
| 6 to 18 Years | 127 (98.5%) | 2 (1.5%) |
| 19 to 25 Years | 72 (92.3%) | 6 (7.7%) |
| 26 to 34 Years | 80 (97.6%) | 2 (2.4%) |
| 35 to 44 Years | 84 (88.4%) | 11 (11.6%) |
| 45 to 54 Years | 105 (96.3%) | 4 (3.7%) |
| 55 to 64 Years | 101 (69.7%) | 44 (30.3%) |
| 65 to 74 Years | 57 (100.0%) | 0 (0.0%) |
| 75 Years and older | 18 (100.0%) | 0 (0.0%) |
| Total | 680 (90.8%) | 69 (9.2%) |
Health Insurance Coverage by Citizenship Status in Retreat
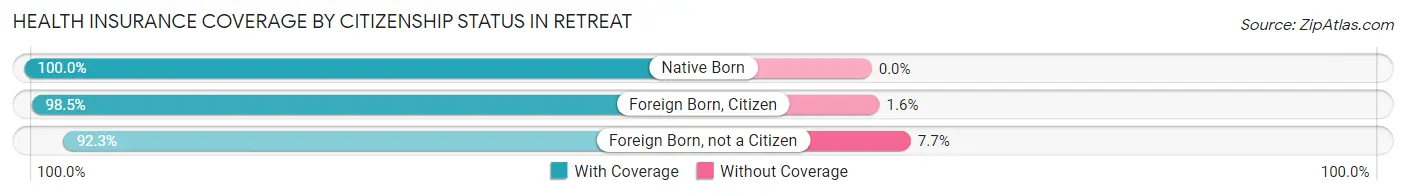
| Citizenship Status | With Coverage | Without Coverage |
| Native Born | 36 (100.0%) | 0 (0.0%) |
| Foreign Born, Citizen | 127 (98.5%) | 2 (1.5%) |
| Foreign Born, not a Citizen | 72 (92.3%) | 6 (7.7%) |
Health Insurance Coverage by Household Income in Retreat
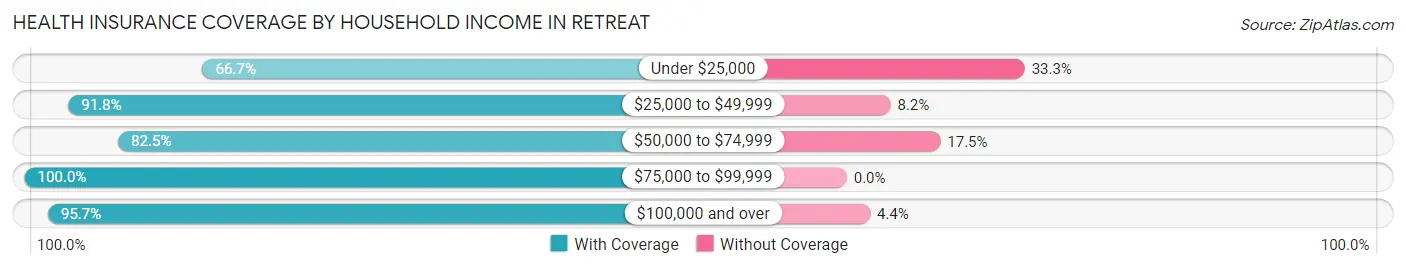
| Household Income | With Coverage | Without Coverage |
| Under $25,000 | 24 (66.7%) | 12 (33.3%) |
| $25,000 to $49,999 | 56 (91.8%) | 5 (8.2%) |
| $50,000 to $74,999 | 160 (82.5%) | 34 (17.5%) |
| $75,000 to $99,999 | 44 (100.0%) | 0 (0.0%) |
| $100,000 and over | 396 (95.7%) | 18 (4.3%) |
Public vs Private Health Insurance Coverage by Age in Retreat
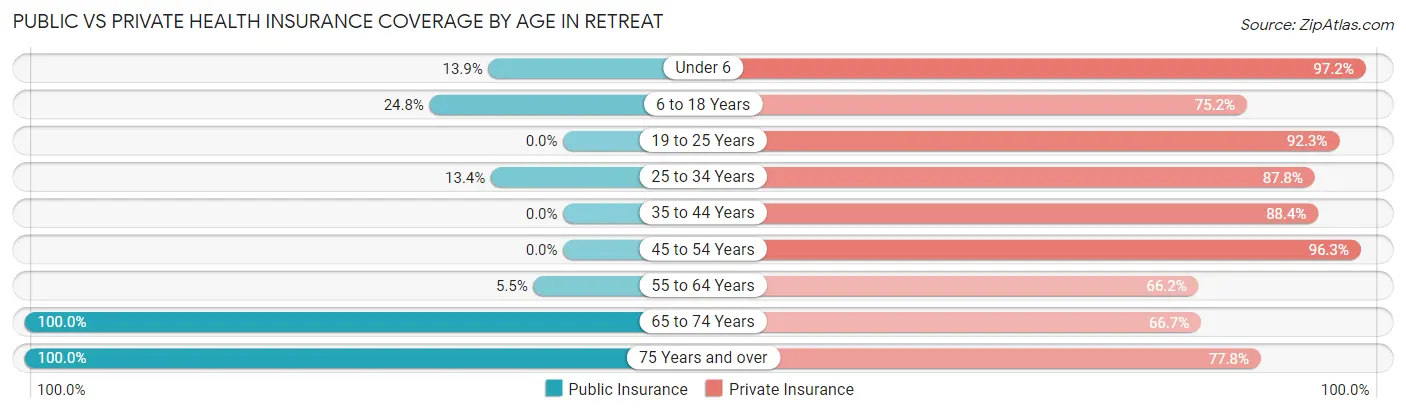
| Age Bracket | Public Insurance | Private Insurance |
| Under 6 | 5 (13.9%) | 35 (97.2%) |
| 6 to 18 Years | 32 (24.8%) | 97 (75.2%) |
| 19 to 25 Years | 0 (0.0%) | 72 (92.3%) |
| 25 to 34 Years | 11 (13.4%) | 72 (87.8%) |
| 35 to 44 Years | 0 (0.0%) | 84 (88.4%) |
| 45 to 54 Years | 0 (0.0%) | 105 (96.3%) |
| 55 to 64 Years | 8 (5.5%) | 96 (66.2%) |
| 65 to 74 Years | 57 (100.0%) | 38 (66.7%) |
| 75 Years and over | 18 (100.0%) | 14 (77.8%) |
| Total | 131 (17.5%) | 613 (81.8%) |
Disability Status by Sex by Age in Retreat
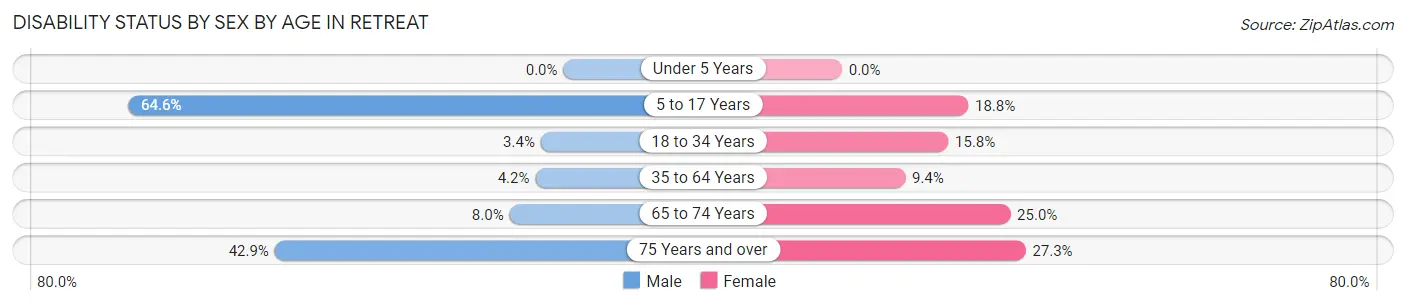
| Age Bracket | Male | Female |
| Under 5 Years | 0 (0.0%) | 0 (0.0%) |
| 5 to 17 Years | 42 (64.6%) | 9 (18.8%) |
| 18 to 34 Years | 4 (3.4%) | 9 (15.8%) |
| 35 to 64 Years | 7 (4.2%) | 17 (9.4%) |
| 65 to 74 Years | 2 (8.0%) | 8 (25.0%) |
| 75 Years and over | 3 (42.9%) | 3 (27.3%) |
Disability Class by Sex by Age in Retreat
Disability Class: Hearing Difficulty
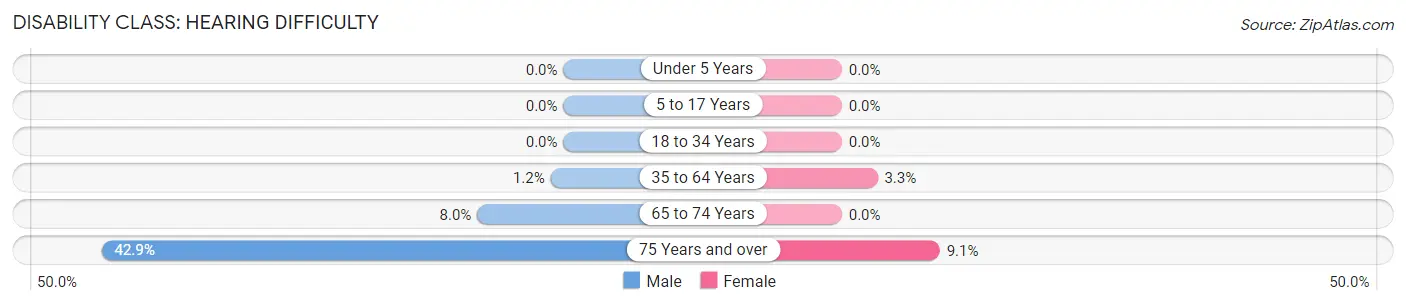
| Age Bracket | Male | Female |
| Under 5 Years | 0 (0.0%) | 0 (0.0%) |
| 5 to 17 Years | 0 (0.0%) | 0 (0.0%) |
| 18 to 34 Years | 0 (0.0%) | 0 (0.0%) |
| 35 to 64 Years | 2 (1.2%) | 6 (3.3%) |
| 65 to 74 Years | 2 (8.0%) | 0 (0.0%) |
| 75 Years and over | 3 (42.9%) | 1 (9.1%) |
Disability Class: Vision Difficulty
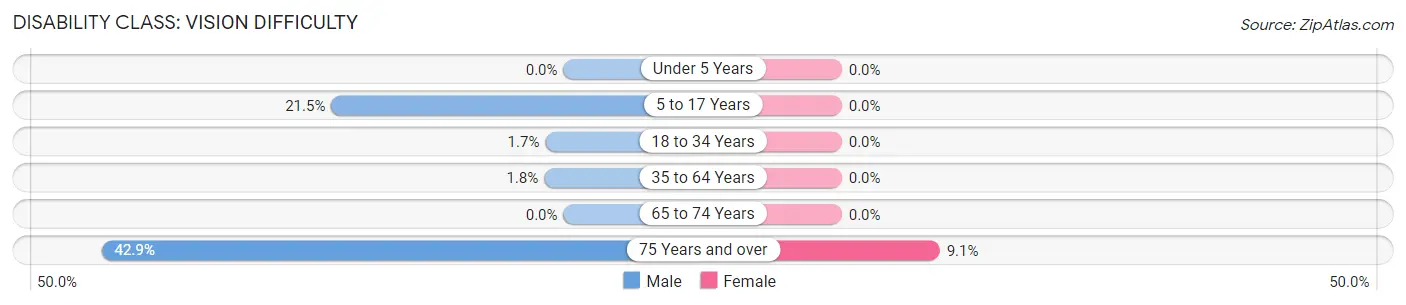
| Age Bracket | Male | Female |
| Under 5 Years | 0 (0.0%) | 0 (0.0%) |
| 5 to 17 Years | 14 (21.5%) | 0 (0.0%) |
| 18 to 34 Years | 2 (1.7%) | 0 (0.0%) |
| 35 to 64 Years | 3 (1.8%) | 0 (0.0%) |
| 65 to 74 Years | 0 (0.0%) | 0 (0.0%) |
| 75 Years and over | 3 (42.9%) | 1 (9.1%) |
Disability Class: Cognitive Difficulty
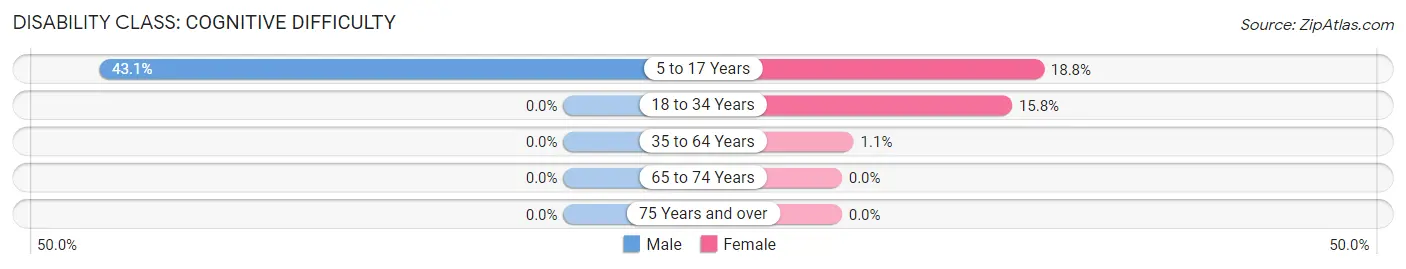
| Age Bracket | Male | Female |
| 5 to 17 Years | 28 (43.1%) | 9 (18.8%) |
| 18 to 34 Years | 0 (0.0%) | 9 (15.8%) |
| 35 to 64 Years | 0 (0.0%) | 2 (1.1%) |
| 65 to 74 Years | 0 (0.0%) | 0 (0.0%) |
| 75 Years and over | 0 (0.0%) | 0 (0.0%) |
Disability Class: Ambulatory Difficulty
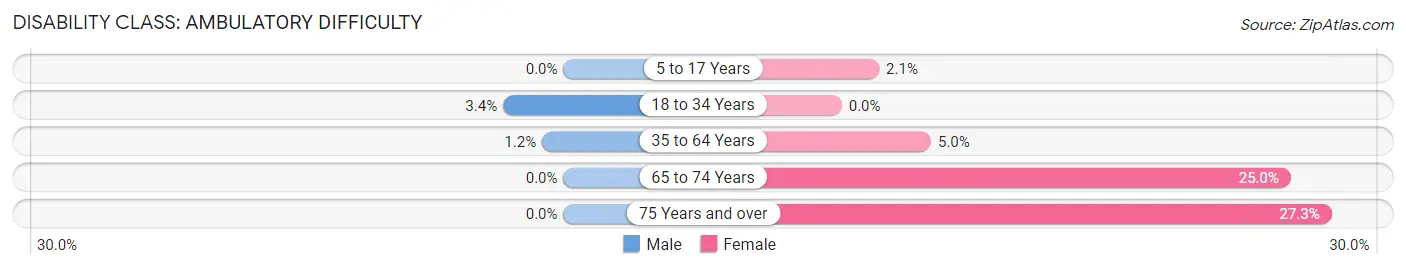
| Age Bracket | Male | Female |
| 5 to 17 Years | 0 (0.0%) | 1 (2.1%) |
| 18 to 34 Years | 4 (3.4%) | 0 (0.0%) |
| 35 to 64 Years | 2 (1.2%) | 9 (5.0%) |
| 65 to 74 Years | 0 (0.0%) | 8 (25.0%) |
| 75 Years and over | 0 (0.0%) | 3 (27.3%) |
Disability Class: Self-Care Difficulty
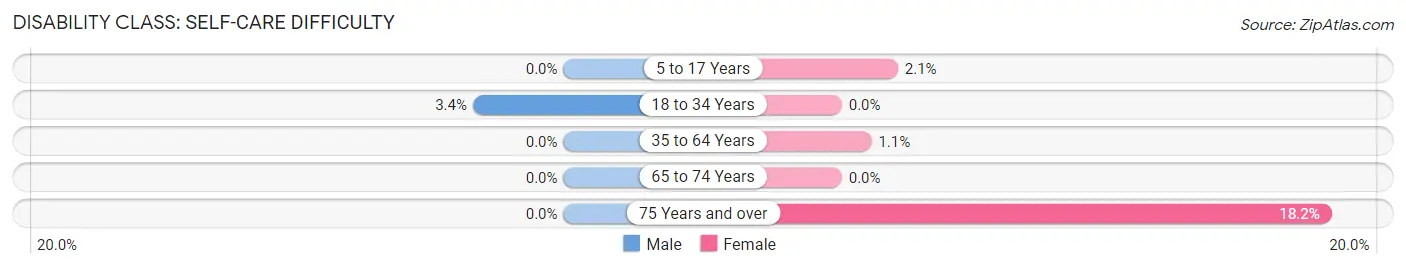
| Age Bracket | Male | Female |
| 5 to 17 Years | 0 (0.0%) | 1 (2.1%) |
| 18 to 34 Years | 4 (3.4%) | 0 (0.0%) |
| 35 to 64 Years | 0 (0.0%) | 2 (1.1%) |
| 65 to 74 Years | 0 (0.0%) | 0 (0.0%) |
| 75 Years and over | 0 (0.0%) | 2 (18.2%) |
Technology Access in Retreat
Computing Device Access in Retreat
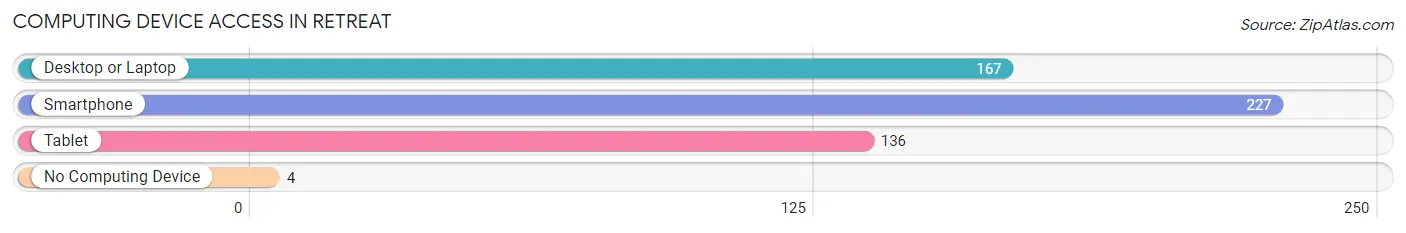
| Device Type | # Households | % Households |
| Desktop or Laptop | 167 | 68.7% |
| Smartphone | 227 | 93.4% |
| Tablet | 136 | 56.0% |
| No Computing Device | 4 | 1.7% |
| Total | 243 | 100.0% |
Internet Access in Retreat
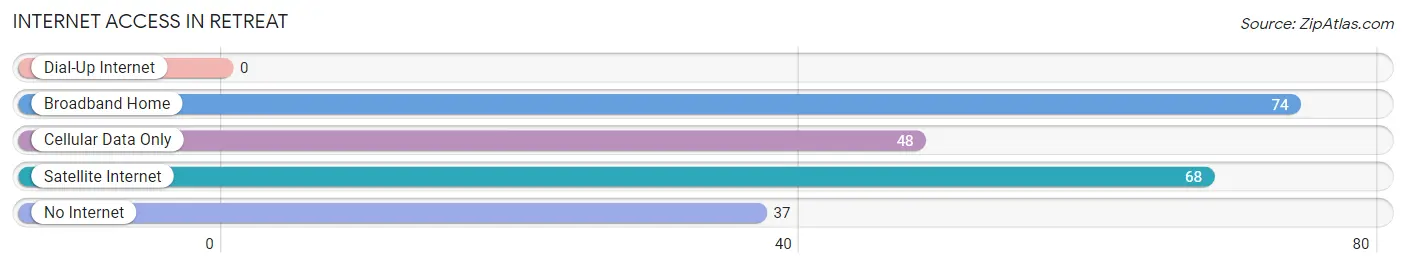
| Internet Type | # Households | % Households |
| Dial-Up Internet | 0 | 0.0% |
| Broadband Home | 74 | 30.4% |
| Cellular Data Only | 48 | 19.8% |
| Satellite Internet | 68 | 28.0% |
| No Internet | 37 | 15.2% |
| Total | 243 | 100.0% |
Retreat Summary
Retreat, Texas is a small town located in the southeastern corner of Texas, in the county of Wharton. It is situated on the banks of the Colorado River, about 40 miles south of Houston. The town has a population of just over 1,000 people, and is part of the Houston–The Woodlands–Sugar Land metropolitan area.
History
Retreat was founded in 1845 by a group of settlers from the nearby town of Richmond. The settlers were looking for a place to settle and start a new life, and they chose the area around the Colorado River. The town was originally called “Retreat” because the settlers wanted to retreat from the hustle and bustle of the city. The town was officially incorporated in 1848, and the first post office was established in 1849.
In the late 1800s, Retreat was a thriving agricultural community, with cotton, corn, and other crops being grown in the area. The town also had a number of businesses, including a general store, a blacksmith shop, and a hotel.
In the early 1900s, the town began to decline as the railroad bypassed it and the population began to move away. By the 1950s, the population had dropped to just over 500 people.
Geography
Retreat is located in the southeastern corner of Texas, in the county of Wharton. It is situated on the banks of the Colorado River, about 40 miles south of Houston. The town is surrounded by rolling hills and farmland, and is located in the Gulf Coastal Plain region of Texas.
The climate in Retreat is humid subtropical, with hot summers and mild winters. The average annual temperature is around 70 degrees Fahrenheit, and the average annual precipitation is around 40 inches.
Economy
Retreat’s economy is largely based on agriculture and tourism. The town is home to several farms, which produce cotton, corn, and other crops. The town also has a number of small businesses, including a general store, a blacksmith shop, and a hotel.
Tourism is also an important part of the local economy. The town is home to several historic sites, including the Retreat Cemetery, which dates back to the 1800s. The town also has a number of parks and recreational areas, including the Colorado River State Park.
Demographics
As of the 2010 census, Retreat had a population of 1,072 people. The racial makeup of the town was 79.3% White, 15.2% Hispanic or Latino, 2.2% African American, 0.7% Native American, 0.2% Asian, and 2.6% from other races.
Retreat is a small, rural town with a close-knit community. The town is home to a number of churches, and the local school district serves the town and the surrounding area. The town also has a number of parks and recreational areas, including the Colorado River State Park.
Common Questions
What is the Total Population of Retreat?
Total Population of Retreat is 749.
What is the Total Male Population of Retreat?
Total Male Population of Retreat is 398.
What is the Total Female Population of Retreat?
Total Female Population of Retreat is 351.
What is the Ratio of Males per 100 Females in Retreat?
There are 113.39 Males per 100 Females in Retreat.
What is the Ratio of Females per 100 Males in Retreat?
There are 88.19 Females per 100 Males in Retreat.
What is the Median Population Age in Retreat?
Median Population Age in Retreat is 38.3 Years.
What is the Average Family Size in Retreat
Average Family Size in Retreat is 3.4 People.
What is the Average Household Size in Retreat
Average Household Size in Retreat is 3.1 People.
What is Per Capita Income in Retreat?
Per Capita income in Retreat is $33,692.
What is the Median Family Income in Retreat?
Median Family Income in Retreat is $101,771.
What is the Median Household income in Retreat?
Median Household Income in Retreat is $97,917.
What is Income or Wage Gap in Retreat?
Income or Wage Gap in Retreat is 3.8%.
Women in Retreat earn 96.2 cents for every dollar earned by a man.
What is Inequality or Gini Index in Retreat?
Inequality or Gini Index in Retreat is 0.38.
How Large is the Labor Force in Retreat?
There are 482 People in the Labor Forcein in Retreat.
What is the Percentage of People in the Labor Force in Retreat?
78.0% of People are in the Labor Force in Retreat.
What is the Unemployment Rate in Retreat?
Unemployment Rate in Retreat is 4.1%.