Cities with the Highest Percentage of Immigrants from El Salvador in Texas
RELATED REPORTS & OPTIONS
El Salvador
Texas
Compare Cities
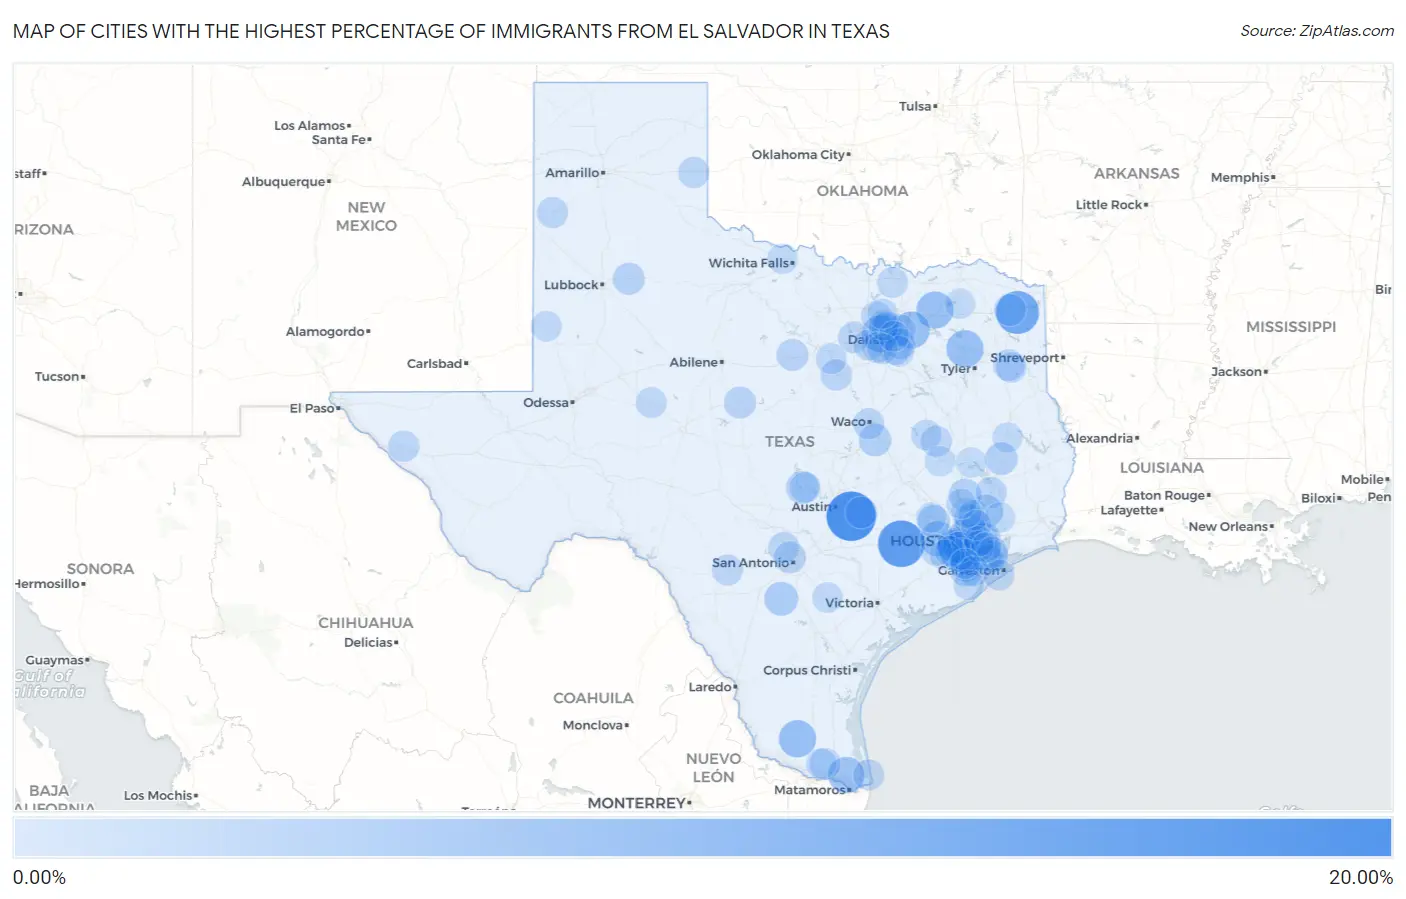
Map of Cities with the Highest Percentage of Immigrants from El Salvador in Texas
0.00%
20.00%
Cities with the Highest Percentage of Immigrants from El Salvador in Texas
| City | El Salvador | vs State | vs National | |
| 1. | Wyldwood | 18.68% | 0.77%(+17.9)#-1 | 0.43%(+18.3)#0 |
| 2. | Glidden | 15.91% | 0.77%(+15.1)#0 | 0.43%(+15.5)#1 |
| 3. | Marietta | 12.62% | 0.77%(+11.9)#1 | 0.43%(+12.2)#2 |
| 4. | Fifth Street | 9.72% | 0.77%(+8.95)#2 | 0.43%(+9.29)#3 |
| 5. | Delmita | 7.32% | 0.77%(+6.55)#3 | 0.43%(+6.89)#4 |
| 6. | Mineola | 7.30% | 0.77%(+6.53)#4 | 0.43%(+6.87)#5 |
| 7. | Neylandville | 7.25% | 0.77%(+6.48)#5 | 0.43%(+6.82)#6 |
| 8. | Mobile City | 7.22% | 0.77%(+6.45)#6 | 0.43%(+6.79)#7 |
| 9. | Rosanky | 6.59% | 0.77%(+5.82)#7 | 0.43%(+6.17)#8 |
| 10. | Irving | 6.50% | 0.77%(+5.73)#38 | 0.43%(+6.07)#1,728 |
| 11. | Green Valley Farms | 6.41% | 0.77%(+5.64)#39 | 0.43%(+5.98)#1,729 |
| 12. | Petronilla | 5.80% | 0.77%(+5.03)#40 | 0.43%(+5.37)#1,730 |
| 13. | Brookshire | 5.34% | 0.77%(+4.57)#41 | 0.43%(+4.91)#1,731 |
| 14. | Charlotte | 4.31% | 0.77%(+3.54)#42 | 0.43%(+3.88)#1,732 |
| 15. | Cloverleaf | 3.74% | 0.77%(+2.98)#43 | 0.43%(+3.32)#1,733 |
| 16. | Mission Bend | 3.70% | 0.77%(+2.93)#44 | 0.43%(+3.27)#1,734 |
| 17. | Plum Grove | 3.66% | 0.77%(+2.89)#45 | 0.43%(+3.23)#1,735 |
| 18. | Four Corners | 3.58% | 0.77%(+2.81)#46 | 0.43%(+3.16)#1,736 |
| 19. | Bonney | 3.55% | 0.77%(+2.79)#47 | 0.43%(+3.13)#1,737 |
| 20. | Cottonwood Shores | 3.51% | 0.77%(+2.74)#48 | 0.43%(+3.09)#1,738 |
| 21. | Aldine | 3.44% | 0.77%(+2.68)#49 | 0.43%(+3.02)#1,739 |
| 22. | Willis | 3.31% | 0.77%(+2.54)#50 | 0.43%(+2.88)#1,740 |
| 23. | Chilton | 3.29% | 0.77%(+2.52)#51 | 0.43%(+2.86)#1,741 |
| 24. | Corrigan | 3.22% | 0.77%(+2.45)#52 | 0.43%(+2.80)#1,742 |
| 25. | Deerwood | 3.21% | 0.77%(+2.45)#53 | 0.43%(+2.79)#1,743 |
| 26. | Farmers Branch | 3.11% | 0.77%(+2.34)#54 | 0.43%(+2.69)#1,744 |
| 27. | Pine Island | 3.10% | 0.77%(+2.33)#55 | 0.43%(+2.67)#1,745 |
| 28. | Webster | 3.07% | 0.77%(+2.31)#56 | 0.43%(+2.65)#1,746 |
| 29. | Arcola | 3.00% | 0.77%(+2.23)#57 | 0.43%(+2.57)#1,747 |
| 30. | Houston | 2.82% | 0.77%(+2.05)#58 | 0.43%(+2.39)#1,748 |
| 31. | Ralls | 2.82% | 0.77%(+2.05)#59 | 0.43%(+2.39)#1,749 |
| 32. | Fresno | 2.70% | 0.77%(+1.93)#60 | 0.43%(+2.28)#1,750 |
| 33. | Naples | 2.66% | 0.77%(+1.90)#61 | 0.43%(+2.24)#1,751 |
| 34. | Channelview | 2.65% | 0.77%(+1.88)#62 | 0.43%(+2.22)#1,752 |
| 35. | Hutchins | 2.61% | 0.77%(+1.84)#63 | 0.43%(+2.18)#1,753 |
| 36. | Strawn | 2.59% | 0.77%(+1.83)#64 | 0.43%(+2.17)#1,754 |
| 37. | Coleman | 2.59% | 0.77%(+1.82)#65 | 0.43%(+2.17)#1,755 |
| 38. | Spring | 2.49% | 0.77%(+1.72)#66 | 0.43%(+2.07)#1,756 |
| 39. | Balcones Heights | 2.49% | 0.77%(+1.72)#67 | 0.43%(+2.07)#1,757 |
| 40. | Camp Swift | 2.39% | 0.77%(+1.62)#68 | 0.43%(+1.96)#1,758 |
| 41. | Lakeport | 2.28% | 0.77%(+1.51)#69 | 0.43%(+1.85)#1,759 |
| 42. | Rosharon | 2.25% | 0.77%(+1.48)#70 | 0.43%(+1.82)#1,760 |
| 43. | Missouri City | 2.17% | 0.77%(+1.40)#71 | 0.43%(+1.74)#1,761 |
| 44. | Bacliff | 2.08% | 0.77%(+1.31)#72 | 0.43%(+1.65)#1,762 |
| 45. | Addison | 2.06% | 0.77%(+1.29)#73 | 0.43%(+1.63)#1,763 |
| 46. | Meadows Place | 2.06% | 0.77%(+1.29)#74 | 0.43%(+1.63)#1,764 |
| 47. | La Villa | 2.05% | 0.77%(+1.29)#75 | 0.43%(+1.63)#1,765 |
| 48. | Glen Rose | 2.04% | 0.77%(+1.27)#76 | 0.43%(+1.61)#1,766 |
| 49. | Dickinson | 2.03% | 0.77%(+1.26)#77 | 0.43%(+1.60)#1,767 |
| 50. | Sierra Blanca | 2.02% | 0.77%(+1.25)#78 | 0.43%(+1.60)#1,768 |
| 51. | Orchard | 2.02% | 0.77%(+1.25)#79 | 0.43%(+1.59)#1,769 |
| 52. | Shamrock | 1.95% | 0.77%(+1.18)#80 | 0.43%(+1.52)#1,770 |
| 53. | Friona | 1.94% | 0.77%(+1.17)#81 | 0.43%(+1.51)#1,771 |
| 54. | Garland | 1.94% | 0.77%(+1.17)#82 | 0.43%(+1.51)#1,848 |
| 55. | Lake Worth | 1.94% | 0.77%(+1.17)#83 | 0.43%(+1.51)#1,849 |
| 56. | Centerville | 1.90% | 0.77%(+1.13)#84 | 0.43%(+1.47)#1,850 |
| 57. | Beverly Hills | 1.89% | 0.77%(+1.12)#85 | 0.43%(+1.46)#1,851 |
| 58. | Shepherd | 1.86% | 0.77%(+1.09)#86 | 0.43%(+1.43)#1,852 |
| 59. | Grand Prairie | 1.85% | 0.77%(+1.08)#87 | 0.43%(+1.43)#1,853 |
| 60. | South Padre Island | 1.84% | 0.77%(+1.08)#88 | 0.43%(+1.42)#1,854 |
| 61. | Seabrook | 1.84% | 0.77%(+1.07)#89 | 0.43%(+1.41)#1,855 |
| 62. | Cross Mountain | 1.84% | 0.77%(+1.07)#90 | 0.43%(+1.41)#1,856 |
| 63. | Galveston | 1.81% | 0.77%(+1.04)#91 | 0.43%(+1.38)#1,857 |
| 64. | Balch Springs | 1.80% | 0.77%(+1.04)#92 | 0.43%(+1.38)#1,858 |
| 65. | Knippa | 1.80% | 0.77%(+1.03)#93 | 0.43%(+1.38)#1,859 |
| 66. | South Houston | 1.79% | 0.77%(+1.02)#94 | 0.43%(+1.36)#1,860 |
| 67. | Sterling City | 1.67% | 0.77%(+0.906)#95 | 0.43%(+1.25)#1,861 |
| 68. | Marble Falls | 1.67% | 0.77%(+0.902)#96 | 0.43%(+1.24)#1,862 |
| 69. | Dalworthington Gardens | 1.64% | 0.77%(+0.874)#97 | 0.43%(+1.22)#1,863 |
| 70. | Southmayd | 1.61% | 0.77%(+0.843)#98 | 0.43%(+1.19)#1,864 |
| 71. | Hickory Creek | 1.53% | 0.77%(+0.761)#99 | 0.43%(+1.10)#1,865 |
| 72. | Wilmer | 1.53% | 0.77%(+0.759)#100 | 0.43%(+1.10)#1,866 |
| 73. | Lake Cherokee | 1.50% | 0.77%(+0.729)#101 | 0.43%(+1.07)#1,867 |
| 74. | Oak Trail Shores | 1.49% | 0.77%(+0.721)#102 | 0.43%(+1.06)#1,868 |
| 75. | Alvin | 1.46% | 0.77%(+0.689)#103 | 0.43%(+1.03)#1,869 |
| 76. | Denver City | 1.43% | 0.77%(+0.658)#104 | 0.43%(+1.00)#1,870 |
| 77. | Jewett | 1.42% | 0.77%(+0.652)#105 | 0.43%(+0.994)#1,871 |
| 78. | Karnes City | 1.41% | 0.77%(+0.645)#106 | 0.43%(+0.988)#1,872 |
| 79. | Porter Heights | 1.40% | 0.77%(+0.631)#107 | 0.43%(+0.973)#1,873 |
| 80. | Carrollton | 1.38% | 0.77%(+0.610)#108 | 0.43%(+0.952)#1,874 |
| 81. | Trinity | 1.36% | 0.77%(+0.596)#109 | 0.43%(+0.938)#1,875 |
| 82. | Tira | 1.36% | 0.77%(+0.596)#110 | 0.43%(+0.938)#1,876 |
| 83. | Duncanville | 1.36% | 0.77%(+0.588)#111 | 0.43%(+0.930)#1,877 |
| 84. | Kenefick | 1.35% | 0.77%(+0.584)#112 | 0.43%(+0.926)#1,878 |
| 85. | Dallas | 1.34% | 0.77%(+0.569)#113 | 0.43%(+0.911)#1,879 |
| 86. | Rosenberg | 1.34% | 0.77%(+0.568)#114 | 0.43%(+0.910)#1,880 |
| 87. | Elsa | 1.33% | 0.77%(+0.561)#115 | 0.43%(+0.903)#1,881 |
| 88. | Iowa Park | 1.29% | 0.77%(+0.519)#116 | 0.43%(+0.861)#1,882 |
| 89. | Galena Park | 1.28% | 0.77%(+0.511)#117 | 0.43%(+0.853)#1,883 |
| 90. | Madisonville | 1.27% | 0.77%(+0.505)#118 | 0.43%(+0.847)#1,884 |
| 91. | Richmond | 1.27% | 0.77%(+0.498)#119 | 0.43%(+0.840)#1,885 |
| 92. | Shenandoah | 1.26% | 0.77%(+0.496)#120 | 0.43%(+0.839)#1,886 |
| 93. | Richwood | 1.25% | 0.77%(+0.485)#121 | 0.43%(+0.827)#1,887 |
| 94. | Humble | 1.19% | 0.77%(+0.422)#122 | 0.43%(+0.764)#1,888 |
| 95. | Hackberry | 1.19% | 0.77%(+0.420)#123 | 0.43%(+0.763)#1,889 |
| 96. | Lufkin | 1.15% | 0.77%(+0.386)#124 | 0.43%(+0.728)#1,890 |
| 97. | Hempstead | 1.14% | 0.77%(+0.376)#125 | 0.43%(+0.718)#1,891 |
| 98. | Pasadena | 1.13% | 0.77%(+0.362)#126 | 0.43%(+0.704)#1,892 |
| 99. | Sandy Point | 1.12% | 0.77%(+0.350)#127 | 0.43%(+0.692)#1,893 |
| 100. | Conroe | 1.11% | 0.77%(+0.344)#128 | 0.43%(+0.686)#1,894 |
Common Questions
What are the Top 10 Cities with the Highest Percentage of Immigrants from El Salvador in Texas?
Top 10 Cities with the Highest Percentage of Immigrants from El Salvador in Texas are:
#1
18.68%
#2
15.91%
#3
12.62%
#4
9.72%
#5
7.32%
#6
7.30%
#7
7.25%
#8
7.22%
#9
6.50%
#10
6.41%
What city has the Highest Percentage of Immigrants from El Salvador in Texas?
Wyldwood has the Highest Percentage of Immigrants from El Salvador in Texas with 18.68%.
What is the Percentage of Immigrants from El Salvador in the State of Texas?
Percentage of Immigrants from El Salvador in Texas is 0.77%.
What is the Percentage of Immigrants from El Salvador in the United States?
Percentage of Immigrants from El Salvador in the United States is 0.43%.