Cities with the Most Immigrants from Canada in Indiana
RELATED REPORTS & OPTIONS
Canada
Indiana
Compare Cities
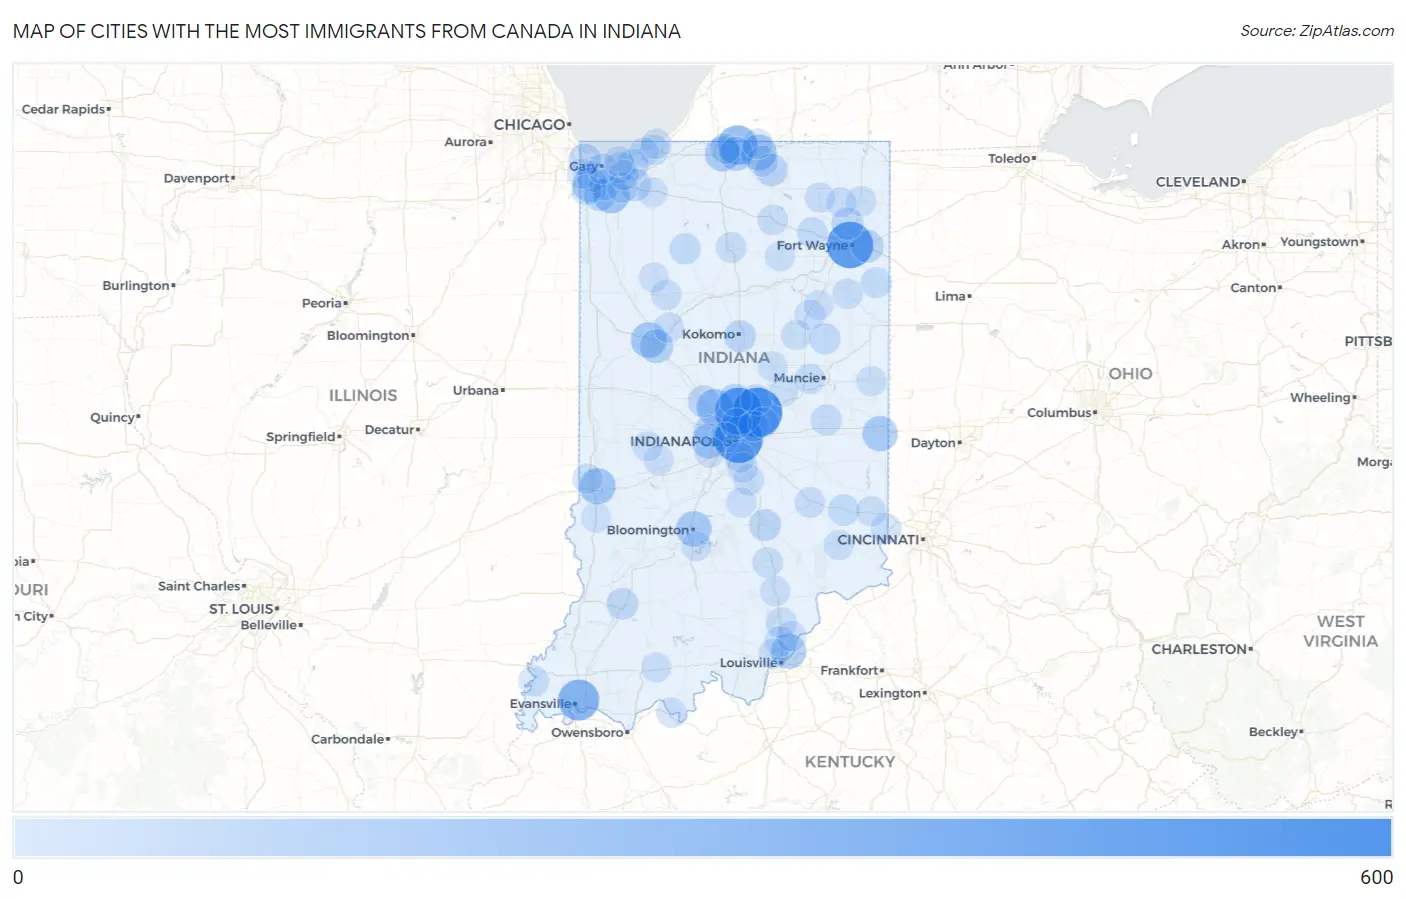
Map of Cities with the Most Immigrants from Canada in Indiana
0
600
Cities with the Most Immigrants from Canada in Indiana
| City | Canada | vs State | vs National | |
| 1. | Fishers | 544 | 7,834(6.94%)#1 | 821,792(0.07%)#191 |
| 2. | Indianapolis | 510 | 7,834(6.51%)#2 | 821,792(0.06%)#206 |
| 3. | Carmel | 478 | 7,834(6.10%)#3 | 821,792(0.06%)#228 |
| 4. | Fort Wayne | 456 | 7,834(5.82%)#4 | 821,792(0.06%)#241 |
| 5. | Evansville | 301 | 7,834(3.84%)#5 | 821,792(0.04%)#407 |
| 6. | Granger | 255 | 7,834(3.26%)#6 | 821,792(0.03%)#493 |
| 7. | Zionsville | 184 | 7,834(2.35%)#7 | 821,792(0.02%)#712 |
| 8. | Winfield | 178 | 7,834(2.27%)#8 | 821,792(0.02%)#732 |
| 9. | Terre Haute | 170 | 7,834(2.17%)#9 | 821,792(0.02%)#755 |
| 10. | West Lafayette | 156 | 7,834(1.99%)#10 | 821,792(0.02%)#824 |
| 11. | Elkhart | 155 | 7,834(1.98%)#11 | 821,792(0.02%)#831 |
| 12. | Bloomington | 148 | 7,834(1.89%)#12 | 821,792(0.02%)#880 |
| 13. | South Bend | 140 | 7,834(1.79%)#13 | 821,792(0.02%)#928 |
| 14. | Richmond | 140 | 7,834(1.79%)#14 | 821,792(0.02%)#931 |
| 15. | Jeffersonville | 139 | 7,834(1.77%)#15 | 821,792(0.02%)#933 |
| 16. | Schererville | 131 | 7,834(1.67%)#16 | 821,792(0.02%)#981 |
| 17. | Avon | 121 | 7,834(1.54%)#17 | 821,792(0.01%)#1,057 |
| 18. | Mishawaka | 111 | 7,834(1.42%)#18 | 821,792(0.01%)#1,151 |
| 19. | Lafayette | 101 | 7,834(1.29%)#19 | 821,792(0.01%)#1,252 |
| 20. | Hammond | 72 | 7,834(0.92%)#20 | 821,792(0.01%)#1,658 |
| 21. | Westfield | 72 | 7,834(0.92%)#21 | 821,792(0.01%)#1,660 |
| 22. | Goshen | 72 | 7,834(0.92%)#22 | 821,792(0.01%)#1,662 |
| 23. | New Haven | 70 | 7,834(0.89%)#23 | 821,792(0.01%)#1,702 |
| 24. | Brownsburg | 63 | 7,834(0.80%)#24 | 821,792(0.01%)#1,833 |
| 25. | Crown Point | 62 | 7,834(0.79%)#25 | 821,792(0.01%)#1,854 |
| 26. | Valparaiso | 61 | 7,834(0.78%)#26 | 821,792(0.01%)#1,877 |
| 27. | Huntertown | 59 | 7,834(0.75%)#27 | 821,792(0.01%)#1,932 |
| 28. | Columbus | 54 | 7,834(0.69%)#28 | 821,792(0.01%)#2,030 |
| 29. | Lebanon | 52 | 7,834(0.66%)#29 | 821,792(0.01%)#2,102 |
| 30. | Kokomo | 50 | 7,834(0.64%)#30 | 821,792(0.01%)#2,148 |
| 31. | Chesterton | 48 | 7,834(0.61%)#31 | 821,792(0.01%)#2,220 |
| 32. | Washington | 45 | 7,834(0.57%)#32 | 821,792(0.01%)#2,334 |
| 33. | Portage | 38 | 7,834(0.49%)#33 | 821,792(0.00%)#2,605 |
| 34. | Batesville | 38 | 7,834(0.49%)#34 | 821,792(0.00%)#2,626 |
| 35. | Griffith | 36 | 7,834(0.46%)#35 | 821,792(0.00%)#2,709 |
| 36. | Winamac | 36 | 7,834(0.46%)#36 | 821,792(0.00%)#2,742 |
| 37. | Noblesville | 32 | 7,834(0.41%)#37 | 821,792(0.00%)#2,916 |
| 38. | Hartford City | 32 | 7,834(0.41%)#38 | 821,792(0.00%)#2,951 |
| 39. | Decatur | 31 | 7,834(0.40%)#39 | 821,792(0.00%)#3,000 |
| 40. | New Castle | 26 | 7,834(0.33%)#40 | 821,792(0.00%)#3,294 |
| 41. | Columbia City | 24 | 7,834(0.31%)#41 | 821,792(0.00%)#3,451 |
| 42. | Merrillville | 23 | 7,834(0.29%)#42 | 821,792(0.00%)#3,510 |
| 43. | Seymour | 22 | 7,834(0.28%)#43 | 821,792(0.00%)#3,604 |
| 44. | Yorktown | 22 | 7,834(0.28%)#44 | 821,792(0.00%)#3,616 |
| 45. | Henryville | 21 | 7,834(0.27%)#45 | 821,792(0.00%)#3,760 |
| 46. | Dunlap | 20 | 7,834(0.26%)#46 | 821,792(0.00%)#3,827 |
| 47. | Rochester | 20 | 7,834(0.26%)#47 | 821,792(0.00%)#3,830 |
| 48. | Franklin | 18 | 7,834(0.23%)#48 | 821,792(0.00%)#3,991 |
| 49. | Hidden Valley | 18 | 7,834(0.23%)#49 | 821,792(0.00%)#4,042 |
| 50. | Sellersburg | 17 | 7,834(0.22%)#50 | 821,792(0.00%)#4,126 |
| 51. | Shorewood Forest | 17 | 7,834(0.22%)#51 | 821,792(0.00%)#4,177 |
| 52. | Lawrence | 16 | 7,834(0.20%)#52 | 821,792(0.00%)#4,210 |
| 53. | Warsaw | 16 | 7,834(0.20%)#53 | 821,792(0.00%)#4,225 |
| 54. | Greensburg | 16 | 7,834(0.20%)#54 | 821,792(0.00%)#4,234 |
| 55. | Bluffton | 16 | 7,834(0.20%)#55 | 821,792(0.00%)#4,239 |
| 56. | Monticello | 16 | 7,834(0.20%)#56 | 821,792(0.00%)#4,263 |
| 57. | Greenwood | 15 | 7,834(0.19%)#57 | 821,792(0.00%)#4,333 |
| 58. | Meridian Hills | 14 | 7,834(0.18%)#58 | 821,792(0.00%)#4,581 |
| 59. | New Harmony | 14 | 7,834(0.18%)#59 | 821,792(0.00%)#4,595 |
| 60. | South Haven | 13 | 7,834(0.17%)#60 | 821,792(0.00%)#4,660 |
| 61. | Americus | 13 | 7,834(0.17%)#61 | 821,792(0.00%)#4,747 |
| 62. | Munster | 12 | 7,834(0.15%)#62 | 821,792(0.00%)#4,759 |
| 63. | Greencastle | 12 | 7,834(0.15%)#63 | 821,792(0.00%)#4,793 |
| 64. | Auburn | 11 | 7,834(0.14%)#64 | 821,792(0.00%)#4,935 |
| 65. | New Albany | 10 | 7,834(0.13%)#65 | 821,792(0.00%)#5,071 |
| 66. | St John | 10 | 7,834(0.13%)#66 | 821,792(0.00%)#5,086 |
| 67. | Speedway | 10 | 7,834(0.13%)#67 | 821,792(0.00%)#5,104 |
| 68. | Charlestown | 10 | 7,834(0.13%)#68 | 821,792(0.00%)#5,131 |
| 69. | Austin | 10 | 7,834(0.13%)#69 | 821,792(0.00%)#5,182 |
| 70. | Romney | 10 | 7,834(0.13%)#70 | 821,792(0.00%)#5,268 |
| 71. | Michigan City | 9 | 7,834(0.11%)#71 | 821,792(0.00%)#5,291 |
| 72. | Elwood | 9 | 7,834(0.11%)#72 | 821,792(0.00%)#5,347 |
| 73. | Smithville Sanders | 9 | 7,834(0.11%)#73 | 821,792(0.00%)#5,417 |
| 74. | Versailles | 9 | 7,834(0.11%)#74 | 821,792(0.00%)#5,461 |
| 75. | St Leon | 9 | 7,834(0.11%)#75 | 821,792(0.00%)#5,489 |
| 76. | Gary | 8 | 7,834(0.10%)#76 | 821,792(0.00%)#5,523 |
| 77. | Plainfield | 8 | 7,834(0.10%)#77 | 821,792(0.00%)#5,527 |
| 78. | Mccordsville | 8 | 7,834(0.10%)#78 | 821,792(0.00%)#5,588 |
| 79. | Simonton Lake | 8 | 7,834(0.10%)#79 | 821,792(0.00%)#5,632 |
| 80. | Albion | 8 | 7,834(0.10%)#80 | 821,792(0.00%)#5,659 |
| 81. | Jonesboro | 8 | 7,834(0.10%)#81 | 821,792(0.00%)#5,696 |
| 82. | Roseland | 8 | 7,834(0.10%)#82 | 821,792(0.00%)#5,736 |
| 83. | St Mary Of The Woods | 8 | 7,834(0.10%)#83 | 821,792(0.00%)#5,737 |
| 84. | Southport | 7 | 7,834(0.09%)#84 | 821,792(0.00%)#5,905 |
| 85. | Prince S Lakes | 7 | 7,834(0.09%)#85 | 821,792(0.00%)#5,938 |
| 86. | Beverly Shores | 7 | 7,834(0.09%)#86 | 821,792(0.00%)#5,965 |
| 87. | Avilla | 6 | 7,834(0.08%)#87 | 821,792(0.00%)#6,109 |
| 88. | Cannelton | 6 | 7,834(0.08%)#88 | 821,792(0.00%)#6,160 |
| 89. | Ogden Dunes | 6 | 7,834(0.08%)#89 | 821,792(0.00%)#6,172 |
| 90. | Long Beach | 6 | 7,834(0.08%)#90 | 821,792(0.00%)#6,179 |
| 91. | Van Buren | 6 | 7,834(0.08%)#91 | 821,792(0.00%)#6,192 |
| 92. | Van Bibber Lake | 6 | 7,834(0.08%)#92 | 821,792(0.00%)#6,238 |
| 93. | Winchester | 5 | 7,834(0.06%)#93 | 821,792(0.00%)#6,331 |
| 94. | Ferdinand | 5 | 7,834(0.06%)#94 | 821,792(0.00%)#6,398 |
| 95. | North Manchester | 4 | 7,834(0.05%)#95 | 821,792(0.00%)#6,578 |
| 96. | Edgewood | 4 | 7,834(0.05%)#96 | 821,792(0.00%)#6,630 |
| 97. | Monon | 4 | 7,834(0.05%)#97 | 821,792(0.00%)#6,642 |
| 98. | Warren | 4 | 7,834(0.05%)#98 | 821,792(0.00%)#6,682 |
| 99. | Farmersburg | 4 | 7,834(0.05%)#99 | 821,792(0.00%)#6,693 |
| 100. | Wanatah | 4 | 7,834(0.05%)#100 | 821,792(0.00%)#6,699 |
Common Questions
What are the Top 10 Cities with the Most Immigrants from Canada in Indiana?
Top 10 Cities with the Most Immigrants from Canada in Indiana are:
#1
544
#2
510
#3
478
#4
456
#5
301
#6
255
#7
184
#8
178
#9
170
#10
156
What city has the Most Immigrants from Canada in Indiana?
Fishers has the Most Immigrants from Canada in Indiana with 544.
What is the Total Immigrants from Canada in the State of Indiana?
Total Immigrants from Canada in Indiana is 7,834.
What is the Total Immigrants from Canada in the United States?
Total Immigrants from Canada in the United States is 821,792.