Cities with the Most Immigrants from Canada in Michigan
RELATED REPORTS & OPTIONS
Canada
Michigan
Compare Cities
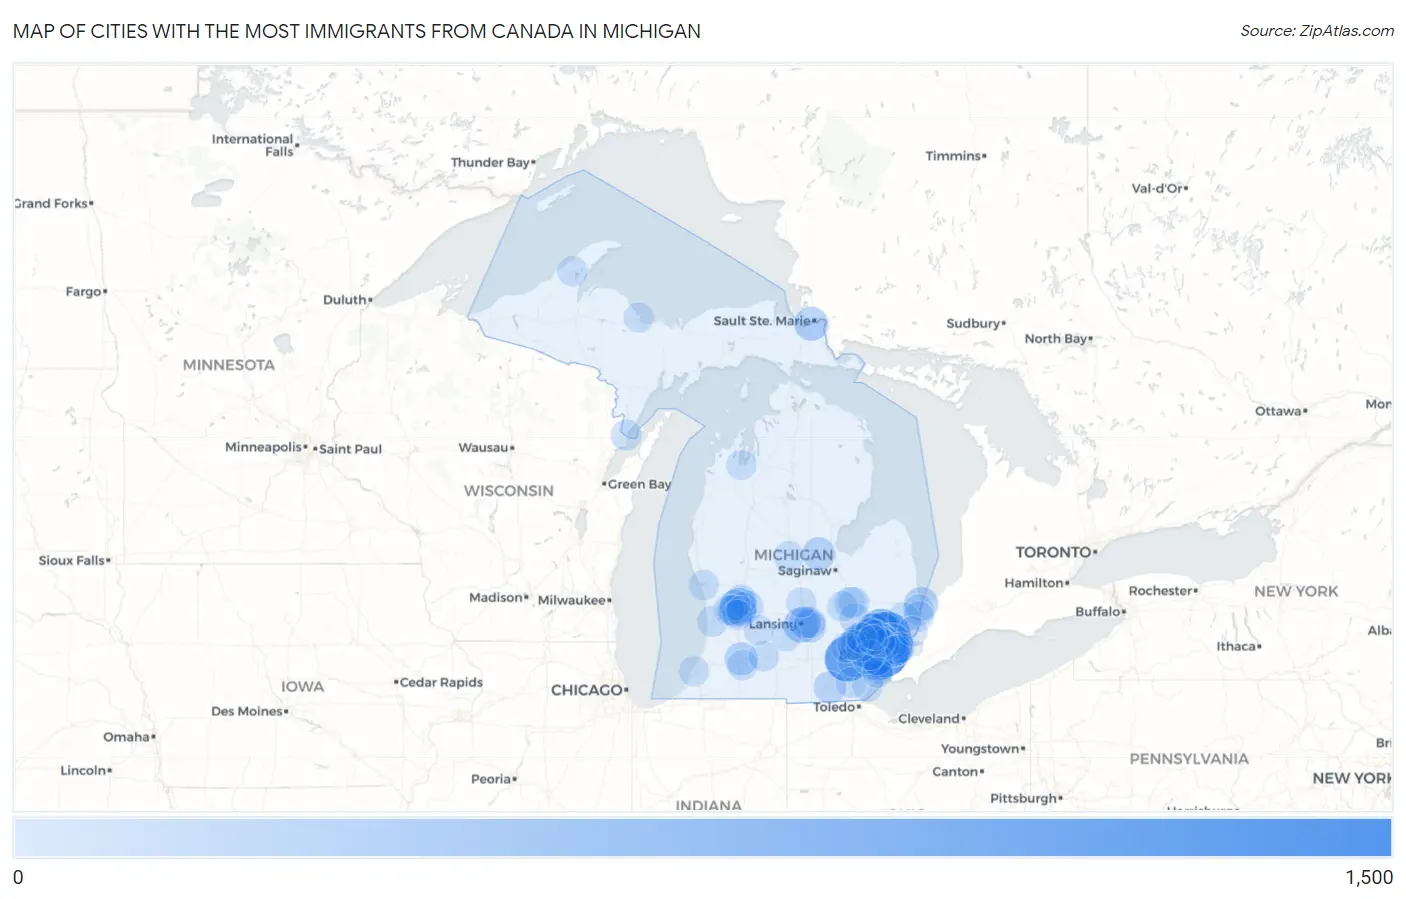
Map of Cities with the Most Immigrants from Canada in Michigan
0
1,500
Cities with the Most Immigrants from Canada in Michigan
| City | Canada | vs State | vs National | |
| 1. | Detroit | 1,126 | 35,052(3.21%)#1 | 821,792(0.14%)#59 |
| 2. | Sterling Heights | 927 | 35,052(2.64%)#2 | 821,792(0.11%)#79 |
| 3. | Ann Arbor | 888 | 35,052(2.53%)#3 | 821,792(0.11%)#90 |
| 4. | Troy | 780 | 35,052(2.23%)#4 | 821,792(0.09%)#109 |
| 5. | Novi | 624 | 35,052(1.78%)#5 | 821,792(0.08%)#158 |
| 6. | Rochester Hills | 582 | 35,052(1.66%)#6 | 821,792(0.07%)#170 |
| 7. | Farmington Hills | 578 | 35,052(1.65%)#7 | 821,792(0.07%)#176 |
| 8. | Warren | 490 | 35,052(1.40%)#8 | 821,792(0.06%)#217 |
| 9. | Livonia | 485 | 35,052(1.38%)#9 | 821,792(0.06%)#221 |
| 10. | Dearborn | 444 | 35,052(1.27%)#10 | 821,792(0.05%)#248 |
| 11. | Royal Oak | 440 | 35,052(1.26%)#11 | 821,792(0.05%)#256 |
| 12. | Southfield | 415 | 35,052(1.18%)#12 | 821,792(0.05%)#276 |
| 13. | Grand Rapids | 369 | 35,052(1.05%)#13 | 821,792(0.04%)#314 |
| 14. | Grosse Pointe Woods | 359 | 35,052(1.02%)#14 | 821,792(0.04%)#333 |
| 15. | St Clair Shores | 329 | 35,052(0.94%)#15 | 821,792(0.04%)#367 |
| 16. | Lansing | 310 | 35,052(0.88%)#16 | 821,792(0.04%)#392 |
| 17. | Dearborn Heights | 306 | 35,052(0.87%)#17 | 821,792(0.04%)#396 |
| 18. | Roseville | 280 | 35,052(0.80%)#18 | 821,792(0.03%)#442 |
| 19. | Madison Heights | 252 | 35,052(0.72%)#19 | 821,792(0.03%)#506 |
| 20. | Sault Ste Marie | 243 | 35,052(0.69%)#20 | 821,792(0.03%)#528 |
| 21. | Birmingham | 240 | 35,052(0.68%)#21 | 821,792(0.03%)#537 |
| 22. | Port Huron | 233 | 35,052(0.66%)#22 | 821,792(0.03%)#559 |
| 23. | Taylor | 211 | 35,052(0.60%)#23 | 821,792(0.03%)#617 |
| 24. | Ferndale | 196 | 35,052(0.56%)#24 | 821,792(0.02%)#665 |
| 25. | Midland | 192 | 35,052(0.55%)#25 | 821,792(0.02%)#680 |
| 26. | Kalamazoo | 191 | 35,052(0.54%)#26 | 821,792(0.02%)#683 |
| 27. | Southgate | 189 | 35,052(0.54%)#27 | 821,792(0.02%)#690 |
| 28. | Pontiac | 170 | 35,052(0.48%)#28 | 821,792(0.02%)#754 |
| 29. | Wyandotte | 168 | 35,052(0.48%)#29 | 821,792(0.02%)#764 |
| 30. | Westland | 163 | 35,052(0.47%)#30 | 821,792(0.02%)#784 |
| 31. | Oak Park | 158 | 35,052(0.45%)#31 | 821,792(0.02%)#811 |
| 32. | Adrian | 157 | 35,052(0.45%)#32 | 821,792(0.02%)#818 |
| 33. | Okemos | 155 | 35,052(0.44%)#33 | 821,792(0.02%)#833 |
| 34. | Auburn Hills | 146 | 35,052(0.42%)#34 | 821,792(0.02%)#890 |
| 35. | Lincoln Park | 145 | 35,052(0.41%)#35 | 821,792(0.02%)#891 |
| 36. | East Lansing | 141 | 35,052(0.40%)#36 | 821,792(0.02%)#922 |
| 37. | Farmington | 129 | 35,052(0.37%)#37 | 821,792(0.02%)#999 |
| 38. | Beverly Hills | 129 | 35,052(0.37%)#38 | 821,792(0.02%)#1,000 |
| 39. | Eastpointe | 118 | 35,052(0.34%)#39 | 821,792(0.01%)#1,084 |
| 40. | Ypsilanti | 118 | 35,052(0.34%)#40 | 821,792(0.01%)#1,087 |
| 41. | Rochester | 117 | 35,052(0.33%)#41 | 821,792(0.01%)#1,099 |
| 42. | Wyoming | 116 | 35,052(0.33%)#42 | 821,792(0.01%)#1,102 |
| 43. | Fraser | 101 | 35,052(0.29%)#43 | 821,792(0.01%)#1,259 |
| 44. | Forest Hills | 98 | 35,052(0.28%)#44 | 821,792(0.01%)#1,295 |
| 45. | East Grand Rapids | 89 | 35,052(0.25%)#45 | 821,792(0.01%)#1,398 |
| 46. | Flint | 86 | 35,052(0.25%)#46 | 821,792(0.01%)#1,431 |
| 47. | Haslett | 86 | 35,052(0.25%)#47 | 821,792(0.01%)#1,435 |
| 48. | Center Line | 85 | 35,052(0.24%)#48 | 821,792(0.01%)#1,458 |
| 49. | Burton | 84 | 35,052(0.24%)#49 | 821,792(0.01%)#1,466 |
| 50. | Grosse Pointe Park | 84 | 35,052(0.24%)#50 | 821,792(0.01%)#1,473 |
| 51. | Holly | 84 | 35,052(0.24%)#51 | 821,792(0.01%)#1,475 |
| 52. | Berkley | 83 | 35,052(0.24%)#52 | 821,792(0.01%)#1,481 |
| 53. | Marysville | 83 | 35,052(0.24%)#53 | 821,792(0.01%)#1,483 |
| 54. | Plymouth | 82 | 35,052(0.23%)#54 | 821,792(0.01%)#1,498 |
| 55. | Holland | 81 | 35,052(0.23%)#55 | 821,792(0.01%)#1,506 |
| 56. | Northview | 80 | 35,052(0.23%)#56 | 821,792(0.01%)#1,535 |
| 57. | Trenton | 76 | 35,052(0.22%)#57 | 821,792(0.01%)#1,600 |
| 58. | Menominee | 76 | 35,052(0.22%)#58 | 821,792(0.01%)#1,604 |
| 59. | Dundee | 75 | 35,052(0.21%)#59 | 821,792(0.01%)#1,616 |
| 60. | Clawson | 74 | 35,052(0.21%)#60 | 821,792(0.01%)#1,629 |
| 61. | Richmond | 68 | 35,052(0.19%)#61 | 821,792(0.01%)#1,748 |
| 62. | Monroe | 66 | 35,052(0.19%)#62 | 821,792(0.01%)#1,779 |
| 63. | Wixom | 66 | 35,052(0.19%)#63 | 821,792(0.01%)#1,782 |
| 64. | Walker | 65 | 35,052(0.19%)#64 | 821,792(0.01%)#1,799 |
| 65. | Wayne | 63 | 35,052(0.18%)#65 | 821,792(0.01%)#1,834 |
| 66. | Portage | 62 | 35,052(0.18%)#66 | 821,792(0.01%)#1,850 |
| 67. | Jenison | 61 | 35,052(0.17%)#67 | 821,792(0.01%)#1,888 |
| 68. | Grosse Pointe | 60 | 35,052(0.17%)#68 | 821,792(0.01%)#1,915 |
| 69. | Muskegon | 59 | 35,052(0.17%)#69 | 821,792(0.01%)#1,920 |
| 70. | Hazel Park | 57 | 35,052(0.16%)#70 | 821,792(0.01%)#1,963 |
| 71. | Mount Pleasant | 54 | 35,052(0.15%)#71 | 821,792(0.01%)#2,038 |
| 72. | Swartz Creek | 54 | 35,052(0.15%)#72 | 821,792(0.01%)#2,050 |
| 73. | Walled Lake | 51 | 35,052(0.15%)#73 | 821,792(0.01%)#2,139 |
| 74. | Sylvan Lake | 51 | 35,052(0.15%)#74 | 821,792(0.01%)#2,145 |
| 75. | Village Of Grosse Pointe Shores | 49 | 35,052(0.14%)#75 | 821,792(0.01%)#2,207 |
| 76. | Battle Creek | 48 | 35,052(0.14%)#76 | 821,792(0.01%)#2,210 |
| 77. | Grosse Pointe Farms | 48 | 35,052(0.14%)#77 | 821,792(0.01%)#2,224 |
| 78. | Northville | 48 | 35,052(0.14%)#78 | 821,792(0.01%)#2,229 |
| 79. | Allen Park | 47 | 35,052(0.13%)#79 | 821,792(0.01%)#2,244 |
| 80. | Gibraltar | 47 | 35,052(0.13%)#80 | 821,792(0.01%)#2,260 |
| 81. | Houghton | 46 | 35,052(0.13%)#81 | 821,792(0.01%)#2,295 |
| 82. | Grandville | 45 | 35,052(0.13%)#82 | 821,792(0.01%)#2,326 |
| 83. | Kentwood | 44 | 35,052(0.13%)#83 | 821,792(0.01%)#2,362 |
| 84. | Whitmore Lake | 44 | 35,052(0.13%)#84 | 821,792(0.01%)#2,380 |
| 85. | St Clair | 44 | 35,052(0.13%)#85 | 821,792(0.01%)#2,384 |
| 86. | Charlotte | 42 | 35,052(0.12%)#86 | 821,792(0.01%)#2,457 |
| 87. | Traverse City | 41 | 35,052(0.12%)#87 | 821,792(0.00%)#2,485 |
| 88. | Huntington Woods | 41 | 35,052(0.12%)#88 | 821,792(0.00%)#2,497 |
| 89. | Keego Harbor | 41 | 35,052(0.12%)#89 | 821,792(0.00%)#2,513 |
| 90. | Garden City | 40 | 35,052(0.11%)#90 | 821,792(0.00%)#2,525 |
| 91. | Marquette | 40 | 35,052(0.11%)#91 | 821,792(0.00%)#2,527 |
| 92. | Cutlerville | 40 | 35,052(0.11%)#92 | 821,792(0.00%)#2,529 |
| 93. | South Lyon | 40 | 35,052(0.11%)#93 | 821,792(0.00%)#2,539 |
| 94. | St Johns | 40 | 35,052(0.11%)#94 | 821,792(0.00%)#2,545 |
| 95. | Hastings | 40 | 35,052(0.11%)#95 | 821,792(0.00%)#2,546 |
| 96. | Wolverine Lake | 40 | 35,052(0.11%)#96 | 821,792(0.00%)#2,552 |
| 97. | Pearl Beach | 39 | 35,052(0.11%)#97 | 821,792(0.00%)#2,588 |
| 98. | Benton Harbor | 38 | 35,052(0.11%)#98 | 821,792(0.00%)#2,621 |
| 99. | Bloomfield Hills | 38 | 35,052(0.11%)#99 | 821,792(0.00%)#2,634 |
| 100. | Franklin | 36 | 35,052(0.10%)#100 | 821,792(0.00%)#2,739 |
Common Questions
What are the Top 10 Cities with the Most Immigrants from Canada in Michigan?
Top 10 Cities with the Most Immigrants from Canada in Michigan are:
#1
1,126
#2
927
#3
888
#4
780
#5
624
#6
582
#7
578
#8
490
#9
485
#10
444
What city has the Most Immigrants from Canada in Michigan?
Detroit has the Most Immigrants from Canada in Michigan with 1,126.
What is the Total Immigrants from Canada in the State of Michigan?
Total Immigrants from Canada in Michigan is 35,052.
What is the Total Immigrants from Canada in the United States?
Total Immigrants from Canada in the United States is 821,792.