Cities with the Most Immigrants from Canada in Tennessee
RELATED REPORTS & OPTIONS
Canada
Tennessee
Compare Cities
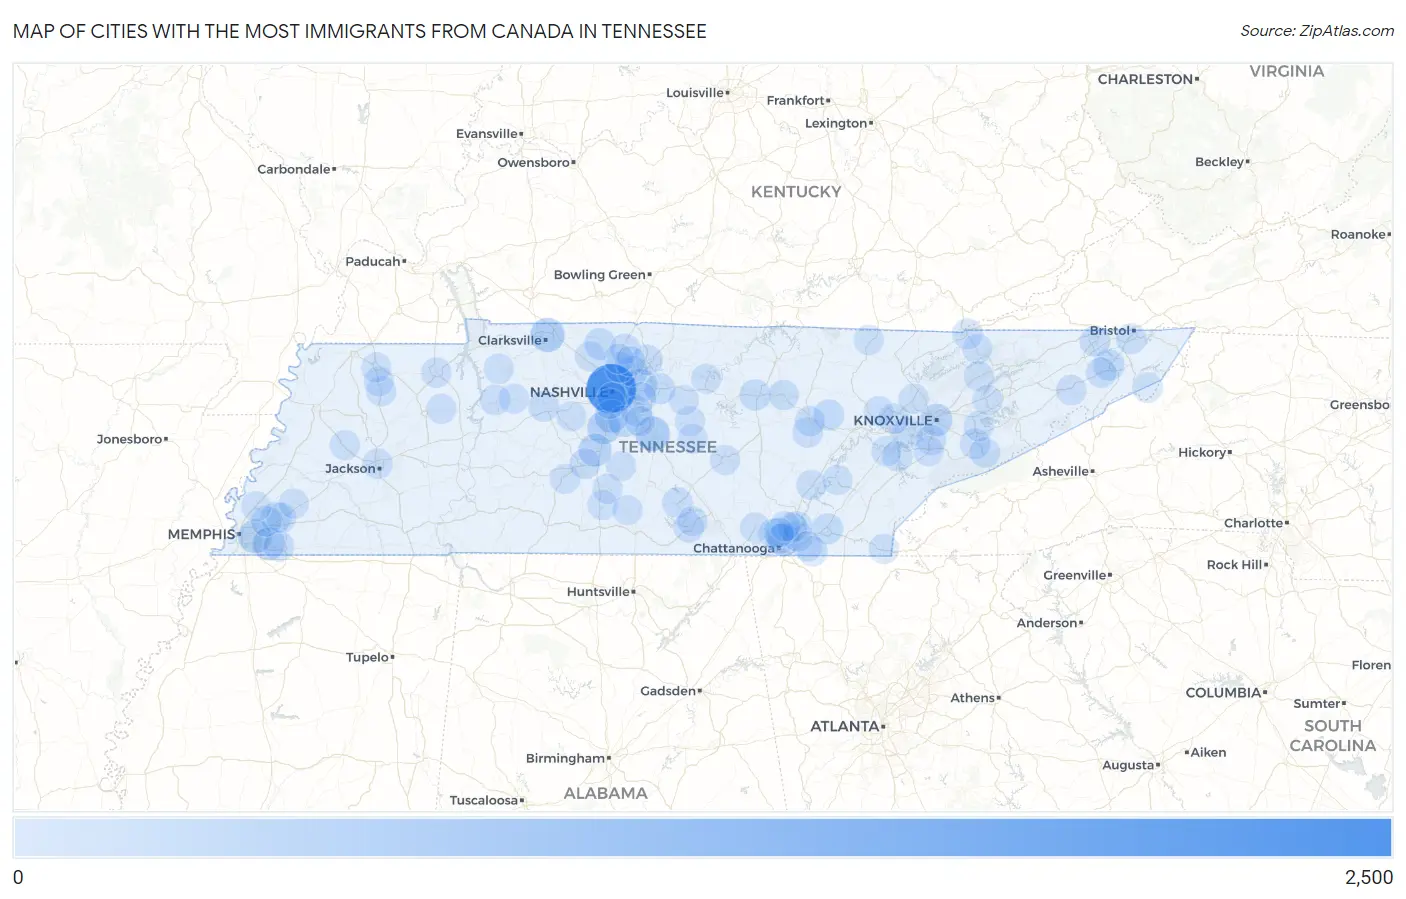
Map of Cities with the Most Immigrants from Canada in Tennessee
0
2,500
Cities with the Most Immigrants from Canada in Tennessee
| City | Canada | vs State | vs National | |
| 1. | Nashville | 2,099 | 10,295(20.39%)#1 | 821,792(0.26%)#18 |
| 2. | Murfreesboro | 462 | 10,295(4.49%)#2 | 821,792(0.06%)#238 |
| 3. | Clarksville | 412 | 10,295(4.00%)#3 | 821,792(0.05%)#278 |
| 4. | Memphis | 365 | 10,295(3.55%)#4 | 821,792(0.04%)#322 |
| 5. | Brentwood | 308 | 10,295(2.99%)#5 | 821,792(0.04%)#394 |
| 6. | Franklin | 300 | 10,295(2.91%)#6 | 821,792(0.04%)#410 |
| 7. | Spring Hill | 292 | 10,295(2.84%)#7 | 821,792(0.04%)#426 |
| 8. | Chattanooga | 272 | 10,295(2.64%)#8 | 821,792(0.03%)#452 |
| 9. | Germantown | 264 | 10,295(2.56%)#9 | 821,792(0.03%)#472 |
| 10. | Knoxville | 249 | 10,295(2.42%)#10 | 821,792(0.03%)#510 |
| 11. | Mount Juliet | 191 | 10,295(1.86%)#11 | 821,792(0.02%)#684 |
| 12. | Johnson City | 125 | 10,295(1.21%)#12 | 821,792(0.02%)#1,025 |
| 13. | Springfield | 113 | 10,295(1.10%)#13 | 821,792(0.01%)#1,137 |
| 14. | Cookeville | 111 | 10,295(1.08%)#14 | 821,792(0.01%)#1,152 |
| 15. | Lebanon | 100 | 10,295(0.97%)#15 | 821,792(0.01%)#1,265 |
| 16. | Cleveland | 95 | 10,295(0.92%)#16 | 821,792(0.01%)#1,321 |
| 17. | Nolensville | 95 | 10,295(0.92%)#17 | 821,792(0.01%)#1,324 |
| 18. | Fairfield Glade | 93 | 10,295(0.90%)#18 | 821,792(0.01%)#1,348 |
| 19. | Farragut | 85 | 10,295(0.83%)#19 | 821,792(0.01%)#1,452 |
| 20. | Lakeland | 80 | 10,295(0.78%)#20 | 821,792(0.01%)#1,536 |
| 21. | Collierville | 74 | 10,295(0.72%)#21 | 821,792(0.01%)#1,620 |
| 22. | Hendersonville | 73 | 10,295(0.71%)#22 | 821,792(0.01%)#1,639 |
| 23. | Tullahoma | 71 | 10,295(0.69%)#23 | 821,792(0.01%)#1,680 |
| 24. | Dickson | 70 | 10,295(0.68%)#24 | 821,792(0.01%)#1,700 |
| 25. | Gallatin | 64 | 10,295(0.62%)#25 | 821,792(0.01%)#1,809 |
| 26. | Bartlett | 60 | 10,295(0.58%)#26 | 821,792(0.01%)#1,899 |
| 27. | Columbia | 56 | 10,295(0.54%)#27 | 821,792(0.01%)#1,988 |
| 28. | Kingsport | 55 | 10,295(0.53%)#28 | 821,792(0.01%)#2,008 |
| 29. | Oak Ridge | 48 | 10,295(0.47%)#29 | 821,792(0.01%)#2,212 |
| 30. | Pigeon Forge | 44 | 10,295(0.43%)#30 | 821,792(0.01%)#2,382 |
| 31. | Waverly | 40 | 10,295(0.39%)#31 | 821,792(0.00%)#2,554 |
| 32. | Jonesborough | 39 | 10,295(0.38%)#32 | 821,792(0.00%)#2,586 |
| 33. | Signal Mountain | 38 | 10,295(0.37%)#33 | 821,792(0.00%)#2,623 |
| 34. | Jackson | 37 | 10,295(0.36%)#34 | 821,792(0.00%)#2,646 |
| 35. | Tusculum | 37 | 10,295(0.36%)#35 | 821,792(0.00%)#2,691 |
| 36. | Lake Tansi | 33 | 10,295(0.32%)#36 | 821,792(0.00%)#2,896 |
| 37. | Goodlettsville | 32 | 10,295(0.31%)#37 | 821,792(0.00%)#2,931 |
| 38. | Alcoa | 32 | 10,295(0.31%)#38 | 821,792(0.00%)#2,939 |
| 39. | Paris | 26 | 10,295(0.25%)#39 | 821,792(0.00%)#3,299 |
| 40. | Gatlinburg | 26 | 10,295(0.25%)#40 | 821,792(0.00%)#3,320 |
| 41. | La Vergne | 25 | 10,295(0.24%)#41 | 821,792(0.00%)#3,346 |
| 42. | Crossville | 25 | 10,295(0.24%)#42 | 821,792(0.00%)#3,367 |
| 43. | Harrogate | 24 | 10,295(0.23%)#43 | 821,792(0.00%)#3,474 |
| 44. | Rural Hill | 24 | 10,295(0.23%)#44 | 821,792(0.00%)#3,486 |
| 45. | White House | 23 | 10,295(0.22%)#45 | 821,792(0.00%)#3,528 |
| 46. | Red Bank | 23 | 10,295(0.22%)#46 | 821,792(0.00%)#3,531 |
| 47. | Winchester | 23 | 10,295(0.22%)#47 | 821,792(0.00%)#3,535 |
| 48. | Harrison | 23 | 10,295(0.22%)#48 | 821,792(0.00%)#3,540 |
| 49. | Lakesite | 22 | 10,295(0.21%)#49 | 821,792(0.00%)#3,665 |
| 50. | Oak Hill | 21 | 10,295(0.20%)#50 | 821,792(0.00%)#3,747 |
| 51. | Bristol | 20 | 10,295(0.19%)#51 | 821,792(0.00%)#3,784 |
| 52. | Tellico Village | 20 | 10,295(0.19%)#52 | 821,792(0.00%)#3,831 |
| 53. | Monterey | 20 | 10,295(0.19%)#53 | 821,792(0.00%)#3,854 |
| 54. | Middle Valley | 19 | 10,295(0.18%)#54 | 821,792(0.00%)#3,909 |
| 55. | Smyrna | 18 | 10,295(0.17%)#55 | 821,792(0.00%)#3,981 |
| 56. | Shackle Island | 17 | 10,295(0.17%)#56 | 821,792(0.00%)#4,164 |
| 57. | Oneida | 16 | 10,295(0.16%)#57 | 821,792(0.00%)#4,279 |
| 58. | Alamo | 15 | 10,295(0.15%)#58 | 821,792(0.00%)#4,455 |
| 59. | Maryville | 14 | 10,295(0.14%)#59 | 821,792(0.00%)#4,485 |
| 60. | Sevierville | 14 | 10,295(0.14%)#60 | 821,792(0.00%)#4,493 |
| 61. | Arlington | 14 | 10,295(0.14%)#61 | 821,792(0.00%)#4,505 |
| 62. | Millersville | 14 | 10,295(0.14%)#62 | 821,792(0.00%)#4,542 |
| 63. | Coopertown | 14 | 10,295(0.14%)#63 | 821,792(0.00%)#4,551 |
| 64. | Roan Mountain | 14 | 10,295(0.14%)#64 | 821,792(0.00%)#4,587 |
| 65. | Tennessee Ridge | 13 | 10,295(0.13%)#65 | 821,792(0.00%)#4,716 |
| 66. | Clinton | 12 | 10,295(0.12%)#66 | 821,792(0.00%)#4,791 |
| 67. | Coalfield | 12 | 10,295(0.12%)#67 | 821,792(0.00%)#4,853 |
| 68. | Dayton | 11 | 10,295(0.11%)#68 | 821,792(0.00%)#4,964 |
| 69. | Apison | 11 | 10,295(0.11%)#69 | 821,792(0.00%)#4,985 |
| 70. | Greenfield | 11 | 10,295(0.11%)#70 | 821,792(0.00%)#5,015 |
| 71. | Falling Water | 11 | 10,295(0.11%)#71 | 821,792(0.00%)#5,024 |
| 72. | Decherd | 10 | 10,295(0.10%)#72 | 821,792(0.00%)#5,203 |
| 73. | Tazewell | 10 | 10,295(0.10%)#73 | 821,792(0.00%)#5,214 |
| 74. | Mcminnville | 9 | 10,295(0.09%)#74 | 821,792(0.00%)#5,314 |
| 75. | Mount Pleasant | 9 | 10,295(0.09%)#75 | 821,792(0.00%)#5,389 |
| 76. | Berry Hill | 9 | 10,295(0.09%)#76 | 821,792(0.00%)#5,451 |
| 77. | Rutledge | 9 | 10,295(0.09%)#77 | 821,792(0.00%)#5,465 |
| 78. | Collegedale | 8 | 10,295(0.08%)#78 | 821,792(0.00%)#5,572 |
| 79. | Millington | 8 | 10,295(0.08%)#79 | 821,792(0.00%)#5,575 |
| 80. | Fairview | 8 | 10,295(0.08%)#80 | 821,792(0.00%)#5,584 |
| 81. | Loudon | 8 | 10,295(0.08%)#81 | 821,792(0.00%)#5,611 |
| 82. | Cornersville | 7 | 10,295(0.07%)#82 | 821,792(0.00%)#5,921 |
| 83. | Carthage | 6 | 10,295(0.06%)#83 | 821,792(0.00%)#6,117 |
| 84. | Sharon | 6 | 10,295(0.06%)#84 | 821,792(0.00%)#6,180 |
| 85. | Braden | 6 | 10,295(0.06%)#85 | 821,792(0.00%)#6,242 |
| 86. | Jefferson City | 5 | 10,295(0.05%)#86 | 821,792(0.00%)#6,305 |
| 87. | Chapel Hill | 5 | 10,295(0.05%)#87 | 821,792(0.00%)#6,444 |
| 88. | Auburntown | 5 | 10,295(0.05%)#88 | 821,792(0.00%)#6,508 |
| 89. | Prospect | 5 | 10,295(0.05%)#89 | 821,792(0.00%)#6,534 |
| 90. | Lewisburg | 4 | 10,295(0.04%)#90 | 821,792(0.00%)#6,558 |
| 91. | Whitwell | 4 | 10,295(0.04%)#91 | 821,792(0.00%)#6,654 |
| 92. | Martin | 3 | 10,295(0.03%)#92 | 821,792(0.00%)#6,811 |
| 93. | Woodbury | 3 | 10,295(0.03%)#93 | 821,792(0.00%)#6,833 |
| 94. | Hollow Rock | 3 | 10,295(0.03%)#94 | 821,792(0.00%)#6,991 |
| 95. | Decatur | 2 | 10,295(0.02%)#95 | 821,792(0.00%)#7,161 |
| 96. | Mcewen | 2 | 10,295(0.02%)#96 | 821,792(0.00%)#7,165 |
| 97. | Walden | 2 | 10,295(0.02%)#97 | 821,792(0.00%)#7,166 |
| 98. | Watertown | 2 | 10,295(0.02%)#98 | 821,792(0.00%)#7,172 |
| 99. | Petersburg | 2 | 10,295(0.02%)#99 | 821,792(0.00%)#7,326 |
| 100. | Ducktown | 2 | 10,295(0.02%)#100 | 821,792(0.00%)#7,339 |
Common Questions
What are the Top 10 Cities with the Most Immigrants from Canada in Tennessee?
Top 10 Cities with the Most Immigrants from Canada in Tennessee are:
#1
2,099
#2
462
#3
412
#4
365
#5
308
#6
300
#7
292
#8
272
#9
264
#10
249
What city has the Most Immigrants from Canada in Tennessee?
Nashville has the Most Immigrants from Canada in Tennessee with 2,099.
What is the Total Immigrants from Canada in the State of Tennessee?
Total Immigrants from Canada in Tennessee is 10,295.
What is the Total Immigrants from Canada in the United States?
Total Immigrants from Canada in the United States is 821,792.