Cities with the Most Immigrants from Canada in Connecticut
RELATED REPORTS & OPTIONS
Canada
Connecticut
Compare Cities
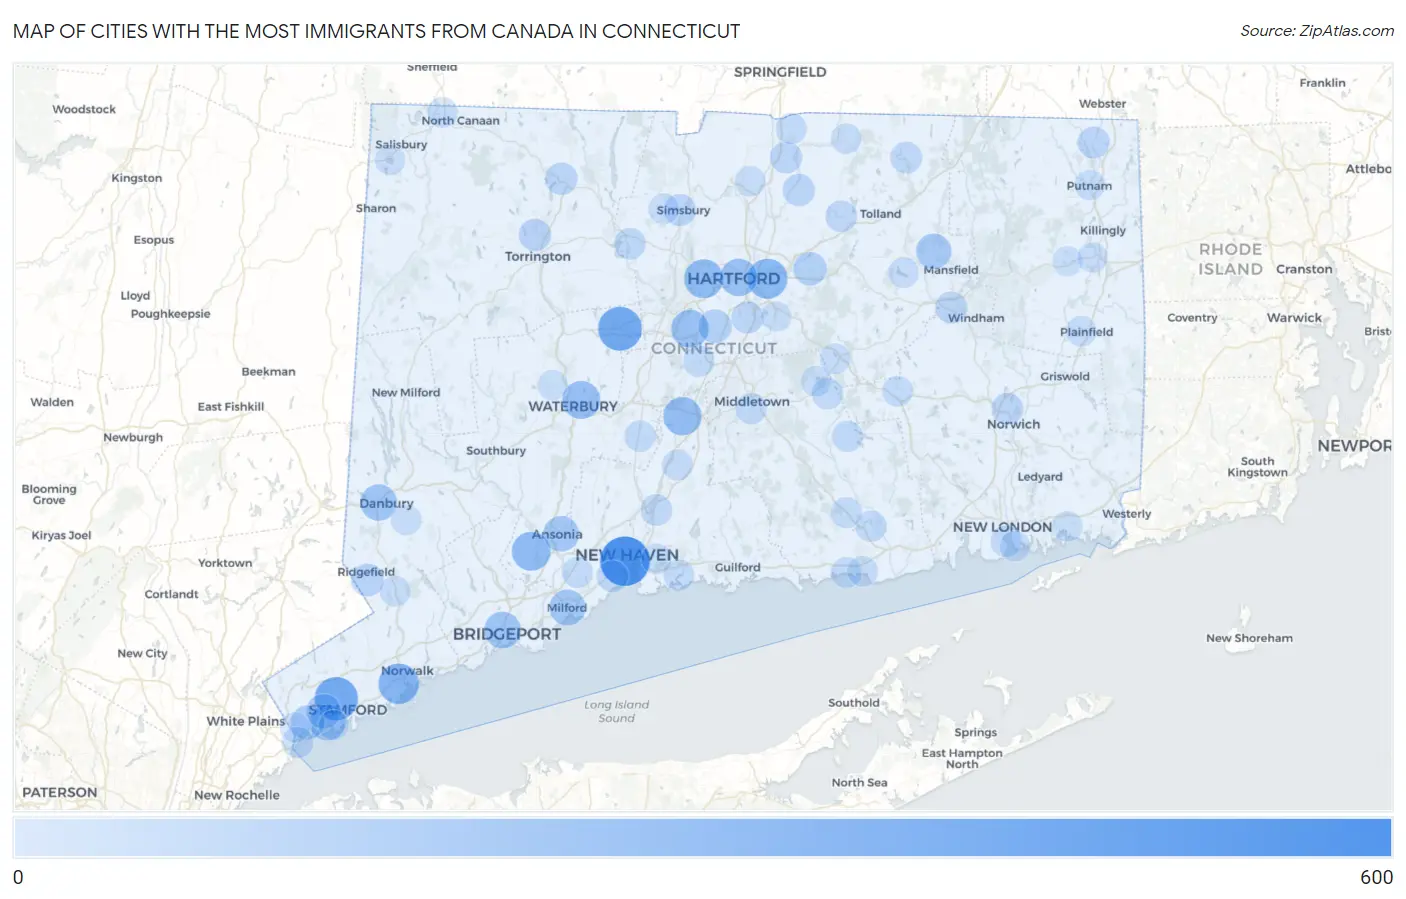
Map of Cities with the Most Immigrants from Canada in Connecticut
0
600
Cities with the Most Immigrants from Canada in Connecticut
| City | Canada | vs State | vs National | |
| 1. | New Haven | 538 | 12,380(4.35%)#1 | 821,792(0.07%)#194 |
| 2. | Bristol | 377 | 12,380(3.05%)#2 | 821,792(0.05%)#306 |
| 3. | Stamford | 367 | 12,380(2.96%)#3 | 821,792(0.04%)#316 |
| 4. | Norwalk | 286 | 12,380(2.31%)#4 | 821,792(0.03%)#434 |
| 5. | East Hartford | 271 | 12,380(2.19%)#5 | 821,792(0.03%)#455 |
| 6. | West Hartford | 244 | 12,380(1.97%)#6 | 821,792(0.03%)#520 |
| 7. | Shelton | 242 | 12,380(1.95%)#7 | 821,792(0.03%)#530 |
| 8. | Meriden | 223 | 12,380(1.80%)#8 | 821,792(0.03%)#585 |
| 9. | Waterbury | 219 | 12,380(1.77%)#9 | 821,792(0.03%)#594 |
| 10. | New Britain | 210 | 12,380(1.70%)#10 | 821,792(0.03%)#621 |
| 11. | Hartford | 202 | 12,380(1.63%)#11 | 821,792(0.02%)#646 |
| 12. | Bridgeport | 178 | 12,380(1.44%)#12 | 821,792(0.02%)#727 |
| 13. | Danbury | 175 | 12,380(1.41%)#13 | 821,792(0.02%)#738 |
| 14. | Riverside | 165 | 12,380(1.33%)#14 | 821,792(0.02%)#777 |
| 15. | Milford City Balance | 161 | 12,380(1.30%)#15 | 821,792(0.02%)#796 |
| 16. | Ansonia | 151 | 12,380(1.22%)#16 | 821,792(0.02%)#858 |
| 17. | Storrs | 144 | 12,380(1.16%)#17 | 821,792(0.02%)#900 |
| 18. | Staples | 136 | 12,380(1.10%)#18 | 821,792(0.02%)#954 |
| 19. | Cos Cob | 128 | 12,380(1.03%)#19 | 821,792(0.02%)#1,009 |
| 20. | Greenwich | 115 | 12,380(0.93%)#20 | 821,792(0.01%)#1,122 |
| 21. | Newington | 100 | 12,380(0.81%)#21 | 821,792(0.01%)#1,266 |
| 22. | New Canaan | 96 | 12,380(0.78%)#22 | 821,792(0.01%)#1,316 |
| 23. | Manchester | 95 | 12,380(0.77%)#23 | 821,792(0.01%)#1,323 |
| 24. | Ridgebury | 82 | 12,380(0.66%)#24 | 821,792(0.01%)#1,500 |
| 25. | Ridgefield | 76 | 12,380(0.61%)#25 | 821,792(0.01%)#1,605 |
| 26. | Naugatuck Borough | 70 | 12,380(0.57%)#26 | 821,792(0.01%)#1,695 |
| 27. | Ball Pond | 70 | 12,380(0.57%)#27 | 821,792(0.01%)#1,705 |
| 28. | Torrington | 68 | 12,380(0.55%)#28 | 821,792(0.01%)#1,731 |
| 29. | Winsted | 66 | 12,380(0.53%)#29 | 821,792(0.01%)#1,785 |
| 30. | Broad Brook | 63 | 12,380(0.51%)#30 | 821,792(0.01%)#1,843 |
| 31. | Simsbury Center | 57 | 12,380(0.46%)#31 | 821,792(0.01%)#1,975 |
| 32. | Wethersfield | 56 | 12,380(0.45%)#32 | 821,792(0.01%)#1,990 |
| 33. | Southwood Acres | 54 | 12,380(0.44%)#33 | 821,792(0.01%)#2,047 |
| 34. | Westport | 54 | 12,380(0.44%)#34 | 821,792(0.01%)#2,057 |
| 35. | North Grosvenor Dale | 54 | 12,380(0.44%)#35 | 821,792(0.01%)#2,059 |
| 36. | Willimantic | 53 | 12,380(0.43%)#36 | 821,792(0.01%)#2,069 |
| 37. | Norwich | 50 | 12,380(0.40%)#37 | 821,792(0.01%)#2,150 |
| 38. | West Haven | 49 | 12,380(0.40%)#38 | 821,792(0.01%)#2,188 |
| 39. | Stafford Springs | 49 | 12,380(0.40%)#39 | 821,792(0.01%)#2,201 |
| 40. | Old Hill | 48 | 12,380(0.39%)#40 | 821,792(0.01%)#2,236 |
| 41. | Rockville | 45 | 12,380(0.36%)#41 | 821,792(0.01%)#2,344 |
| 42. | North Haven | 44 | 12,380(0.36%)#42 | 821,792(0.01%)#2,368 |
| 43. | Collinsville | 44 | 12,380(0.36%)#43 | 821,792(0.01%)#2,391 |
| 44. | Woodmont Borough | 43 | 12,380(0.35%)#44 | 821,792(0.01%)#2,436 |
| 45. | New London | 40 | 12,380(0.32%)#45 | 821,792(0.00%)#2,524 |
| 46. | Kensington | 39 | 12,380(0.32%)#46 | 821,792(0.00%)#2,581 |
| 47. | Byram | 38 | 12,380(0.31%)#47 | 821,792(0.00%)#2,631 |
| 48. | Cheshire Village | 37 | 12,380(0.30%)#48 | 821,792(0.00%)#2,682 |
| 49. | Knollcrest | 37 | 12,380(0.30%)#49 | 821,792(0.00%)#2,698 |
| 50. | East Hampton | 35 | 12,380(0.28%)#50 | 821,792(0.00%)#2,789 |
| 51. | Middletown | 34 | 12,380(0.27%)#51 | 821,792(0.00%)#2,798 |
| 52. | Essex Village | 34 | 12,380(0.27%)#52 | 821,792(0.00%)#2,838 |
| 53. | Moodus | 32 | 12,380(0.26%)#53 | 821,792(0.00%)#2,966 |
| 54. | Lakes West | 32 | 12,380(0.26%)#54 | 821,792(0.00%)#2,969 |
| 55. | Branford Center | 31 | 12,380(0.25%)#55 | 821,792(0.00%)#3,012 |
| 56. | Deep River Center | 31 | 12,380(0.25%)#56 | 821,792(0.00%)#3,025 |
| 57. | Wallingford Center | 30 | 12,380(0.24%)#57 | 821,792(0.00%)#3,056 |
| 58. | Orange | 30 | 12,380(0.24%)#58 | 821,792(0.00%)#3,062 |
| 59. | Daniels Farm | 28 | 12,380(0.23%)#59 | 821,792(0.00%)#3,181 |
| 60. | Sherwood Manor | 26 | 12,380(0.21%)#60 | 821,792(0.00%)#3,313 |
| 61. | Colchester | 25 | 12,380(0.20%)#61 | 821,792(0.00%)#3,385 |
| 62. | Stepney | 25 | 12,380(0.20%)#62 | 821,792(0.00%)#3,390 |
| 63. | Westbrook Center | 25 | 12,380(0.20%)#63 | 821,792(0.00%)#3,399 |
| 64. | Greens Farms | 24 | 12,380(0.19%)#64 | 821,792(0.00%)#3,477 |
| 65. | Tokeneke | 24 | 12,380(0.19%)#65 | 821,792(0.00%)#3,483 |
| 66. | Noroton | 22 | 12,380(0.18%)#66 | 821,792(0.00%)#3,637 |
| 67. | Terramuggus | 22 | 12,380(0.18%)#67 | 821,792(0.00%)#3,674 |
| 68. | Bethel | 21 | 12,380(0.17%)#68 | 821,792(0.00%)#3,714 |
| 69. | Saugatuck | 21 | 12,380(0.17%)#69 | 821,792(0.00%)#3,756 |
| 70. | Saybrook Manor | 21 | 12,380(0.17%)#70 | 821,792(0.00%)#3,769 |
| 71. | Lake Pocotopaug | 20 | 12,380(0.16%)#71 | 821,792(0.00%)#3,839 |
| 72. | Plainfield Village | 19 | 12,380(0.15%)#72 | 821,792(0.00%)#3,959 |
| 73. | Darien Downtown | 19 | 12,380(0.15%)#73 | 821,792(0.00%)#3,970 |
| 74. | Windsor Locks | 18 | 12,380(0.15%)#74 | 821,792(0.00%)#4,018 |
| 75. | Quinnipiac University | 18 | 12,380(0.15%)#75 | 821,792(0.00%)#4,045 |
| 76. | Georgetown | 18 | 12,380(0.15%)#76 | 821,792(0.00%)#4,070 |
| 77. | Trumbull Center | 16 | 12,380(0.13%)#77 | 821,792(0.00%)#4,241 |
| 78. | Sandy Hook | 16 | 12,380(0.13%)#78 | 821,792(0.00%)#4,243 |
| 79. | South Coventry | 16 | 12,380(0.13%)#79 | 821,792(0.00%)#4,310 |
| 80. | Putnam | 15 | 12,380(0.12%)#80 | 821,792(0.00%)#4,405 |
| 81. | West Simsbury | 15 | 12,380(0.12%)#81 | 821,792(0.00%)#4,445 |
| 82. | Canaan | 15 | 12,380(0.12%)#82 | 821,792(0.00%)#4,473 |
| 83. | Somers | 14 | 12,380(0.11%)#83 | 821,792(0.00%)#4,574 |
| 84. | Lakes East | 14 | 12,380(0.11%)#84 | 821,792(0.00%)#4,583 |
| 85. | Route 7 Gateway | 14 | 12,380(0.11%)#85 | 821,792(0.00%)#4,585 |
| 86. | Weston | 14 | 12,380(0.11%)#86 | 821,792(0.00%)#4,596 |
| 87. | Candlewood Orchards | 13 | 12,380(0.11%)#87 | 821,792(0.00%)#4,739 |
| 88. | East Haven | 12 | 12,380(0.10%)#88 | 821,792(0.00%)#4,755 |
| 89. | Glastonbury Center | 12 | 12,380(0.10%)#89 | 821,792(0.00%)#4,804 |
| 90. | Jewett City Borough | 12 | 12,380(0.10%)#90 | 821,792(0.00%)#4,843 |
| 91. | Noroton Heights | 11 | 12,380(0.09%)#91 | 821,792(0.00%)#5,001 |
| 92. | Brooklyn | 11 | 12,380(0.09%)#92 | 821,792(0.00%)#5,062 |
| 93. | Groton | 10 | 12,380(0.08%)#93 | 821,792(0.00%)#5,123 |
| 94. | Mystic | 10 | 12,380(0.08%)#94 | 821,792(0.00%)#5,168 |
| 95. | East | 10 | 12,380(0.08%)#95 | 821,792(0.00%)#5,171 |
| 96. | Lakeville | 10 | 12,380(0.08%)#96 | 821,792(0.00%)#5,254 |
| 97. | Oakville | 9 | 12,380(0.07%)#97 | 821,792(0.00%)#5,341 |
| 98. | Old Greenwich | 9 | 12,380(0.07%)#98 | 821,792(0.00%)#5,358 |
| 99. | Pemberwick | 9 | 12,380(0.07%)#99 | 821,792(0.00%)#5,414 |
| 100. | East Brooklyn | 9 | 12,380(0.07%)#100 | 821,792(0.00%)#5,445 |
1
2Common Questions
What are the Top 10 Cities with the Most Immigrants from Canada in Connecticut?
Top 10 Cities with the Most Immigrants from Canada in Connecticut are:
#1
538
#2
377
#3
367
#4
286
#5
271
#6
244
#7
242
#8
223
#9
219
#10
210
What city has the Most Immigrants from Canada in Connecticut?
New Haven has the Most Immigrants from Canada in Connecticut with 538.
What is the Total Immigrants from Canada in the State of Connecticut?
Total Immigrants from Canada in Connecticut is 12,380.
What is the Total Immigrants from Canada in the United States?
Total Immigrants from Canada in the United States is 821,792.