Cities with the Most Immigrants from Canada in Vermont
RELATED REPORTS & OPTIONS
Canada
Vermont
Compare Cities
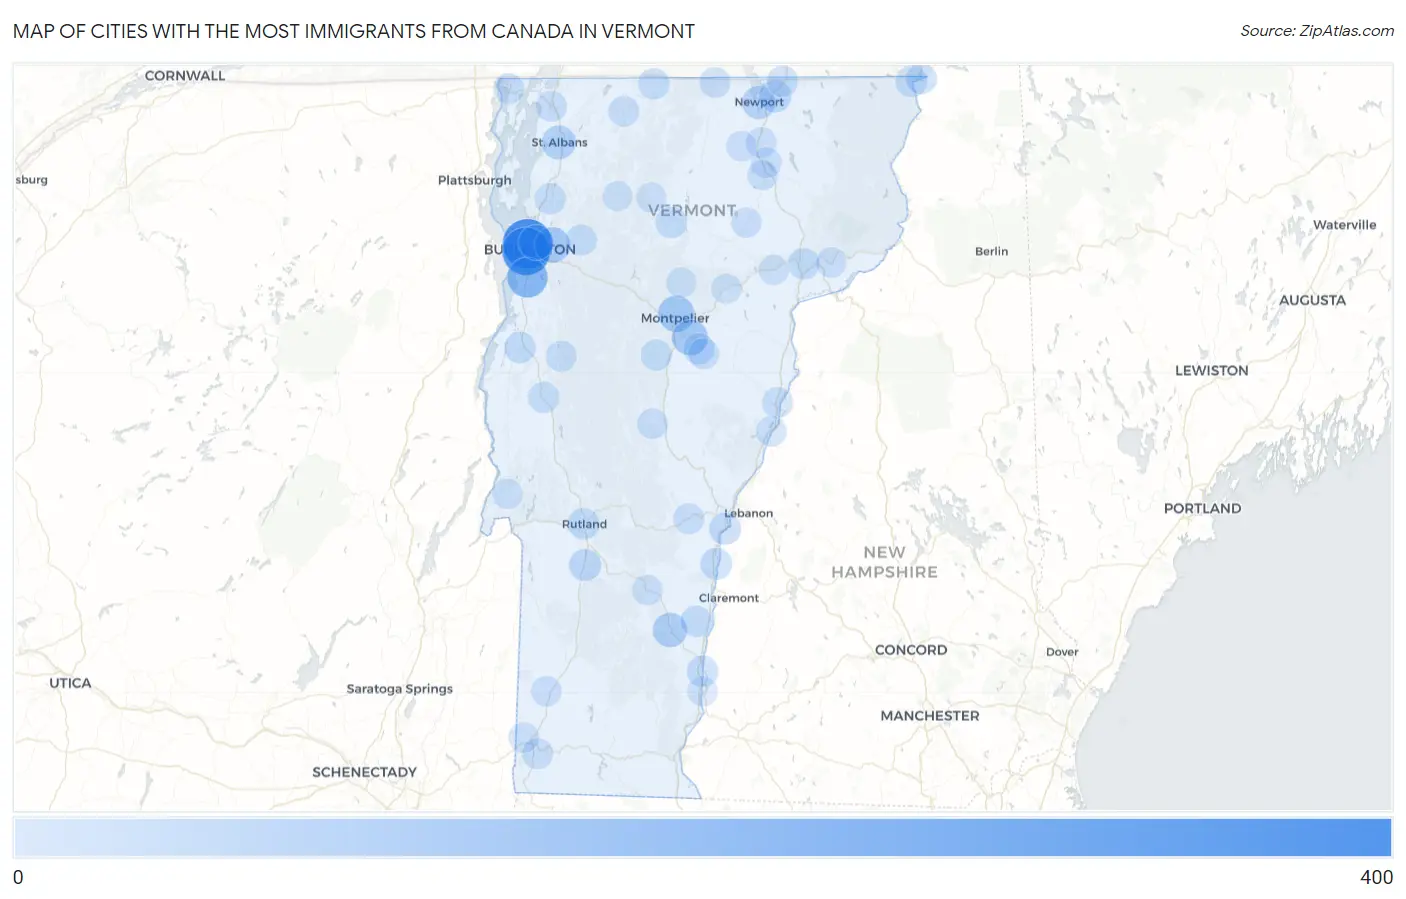
Map of Cities with the Most Immigrants from Canada in Vermont
0
400
Cities with the Most Immigrants from Canada in Vermont
| City | Canada | vs State | vs National | |
| 1. | Burlington | 367 | 5,219(7.03%)#1 | 821,792(0.04%)#317 |
| 2. | South Burlington | 334 | 5,219(6.40%)#2 | 821,792(0.04%)#363 |
| 3. | Shelburne | 187 | 5,219(3.58%)#3 | 821,792(0.02%)#702 |
| 4. | Montpelier | 113 | 5,219(2.17%)#4 | 821,792(0.01%)#1,140 |
| 5. | Barre | 102 | 5,219(1.95%)#5 | 821,792(0.01%)#1,249 |
| 6. | Essex Junction | 100 | 5,219(1.92%)#6 | 821,792(0.01%)#1,272 |
| 7. | Winooski | 89 | 5,219(1.71%)#7 | 821,792(0.01%)#1,399 |
| 8. | Chester | 77 | 5,219(1.48%)#8 | 821,792(0.01%)#1,588 |
| 9. | St Albans | 68 | 5,219(1.30%)#9 | 821,792(0.01%)#1,745 |
| 10. | Newport | 58 | 5,219(1.11%)#10 | 821,792(0.01%)#1,952 |
| 11. | Derby Center | 41 | 5,219(0.79%)#11 | 821,792(0.00%)#2,516 |
| 12. | Wallingford | 34 | 5,219(0.65%)#12 | 821,792(0.00%)#2,847 |
| 13. | North Hartland | 31 | 5,219(0.59%)#13 | 821,792(0.00%)#3,034 |
| 14. | Vergennes | 26 | 5,219(0.50%)#14 | 821,792(0.00%)#3,330 |
| 15. | Rutland | 25 | 5,219(0.48%)#15 | 821,792(0.00%)#3,363 |
| 16. | Morrisville | 25 | 5,219(0.48%)#16 | 821,792(0.00%)#3,396 |
| 17. | Windsor | 25 | 5,219(0.48%)#17 | 821,792(0.00%)#3,401 |
| 18. | Canaan | 24 | 5,219(0.46%)#18 | 821,792(0.00%)#3,504 |
| 19. | St Johnsbury | 23 | 5,219(0.44%)#19 | 821,792(0.00%)#3,551 |
| 20. | Springfield | 22 | 5,219(0.42%)#20 | 821,792(0.00%)#3,649 |
| 21. | Bellows Falls | 22 | 5,219(0.42%)#21 | 821,792(0.00%)#3,659 |
| 22. | Underhill Flats | 22 | 5,219(0.42%)#22 | 821,792(0.00%)#3,676 |
| 23. | Middlebury | 20 | 5,219(0.38%)#23 | 821,792(0.00%)#3,826 |
| 24. | Richford | 20 | 5,219(0.38%)#24 | 821,792(0.00%)#3,869 |
| 25. | Websterville | 19 | 5,219(0.36%)#25 | 821,792(0.00%)#3,978 |
| 26. | Milton | 18 | 5,219(0.34%)#26 | 821,792(0.00%)#4,049 |
| 27. | Northfield | 17 | 5,219(0.33%)#27 | 821,792(0.00%)#4,162 |
| 28. | Beecher Falls | 17 | 5,219(0.33%)#28 | 821,792(0.00%)#4,207 |
| 29. | Jericho | 16 | 5,219(0.31%)#29 | 821,792(0.00%)#4,315 |
| 30. | Derby Line | 16 | 5,219(0.31%)#30 | 821,792(0.00%)#4,324 |
| 31. | Underhill Center | 16 | 5,219(0.31%)#31 | 821,792(0.00%)#4,329 |
| 32. | Swanton | 15 | 5,219(0.29%)#32 | 821,792(0.00%)#4,454 |
| 33. | Enosburg Falls | 15 | 5,219(0.29%)#33 | 821,792(0.00%)#4,466 |
| 34. | East Barre | 13 | 5,219(0.25%)#34 | 821,792(0.00%)#4,722 |
| 35. | Woodstock | 13 | 5,219(0.25%)#35 | 821,792(0.00%)#4,725 |
| 36. | Bennington | 12 | 5,219(0.23%)#36 | 821,792(0.00%)#4,797 |
| 37. | Bristol | 11 | 5,219(0.21%)#37 | 821,792(0.00%)#5,026 |
| 38. | Alburgh | 11 | 5,219(0.21%)#38 | 821,792(0.00%)#5,066 |
| 39. | Bradford | 10 | 5,219(0.19%)#39 | 821,792(0.00%)#5,245 |
| 40. | North Troy | 10 | 5,219(0.19%)#40 | 821,792(0.00%)#5,264 |
| 41. | North Bennington | 9 | 5,219(0.17%)#41 | 821,792(0.00%)#5,473 |
| 42. | Orleans | 9 | 5,219(0.17%)#42 | 821,792(0.00%)#5,492 |
| 43. | St. George | 9 | 5,219(0.17%)#43 | 821,792(0.00%)#5,514 |
| 44. | Randolph | 8 | 5,219(0.15%)#44 | 821,792(0.00%)#5,677 |
| 45. | Ludlow | 7 | 5,219(0.13%)#45 | 821,792(0.00%)#5,959 |
| 46. | Fairlee | 7 | 5,219(0.13%)#46 | 821,792(0.00%)#5,989 |
| 47. | Arlington | 6 | 5,219(0.11%)#47 | 821,792(0.00%)#6,149 |
| 48. | Barton | 6 | 5,219(0.11%)#48 | 821,792(0.00%)#6,212 |
| 49. | Bakersfield | 6 | 5,219(0.11%)#49 | 821,792(0.00%)#6,236 |
| 50. | Gilman | 5 | 5,219(0.10%)#50 | 821,792(0.00%)#6,523 |
| 51. | Huntington Center | 5 | 5,219(0.10%)#51 | 821,792(0.00%)#6,531 |
| 52. | Killington | 4 | 5,219(0.08%)#52 | 821,792(0.00%)#6,762 |
| 53. | Greensboro Bend | 4 | 5,219(0.08%)#53 | 821,792(0.00%)#6,780 |
| 54. | Benson | 4 | 5,219(0.08%)#54 | 821,792(0.00%)#6,784 |
| 55. | Glover | 4 | 5,219(0.08%)#55 | 821,792(0.00%)#6,787 |
| 56. | Concord | 4 | 5,219(0.08%)#56 | 821,792(0.00%)#6,791 |
| 57. | Westminster | 3 | 5,219(0.06%)#57 | 821,792(0.00%)#7,022 |
| 58. | Irasburg | 3 | 5,219(0.06%)#58 | 821,792(0.00%)#7,091 |
| 59. | Worcester | 3 | 5,219(0.06%)#59 | 821,792(0.00%)#7,101 |
| 60. | Jeffersonville | 2 | 5,219(0.04%)#60 | 821,792(0.00%)#7,267 |
| 61. | Danville | 2 | 5,219(0.04%)#61 | 821,792(0.00%)#7,358 |
| 62. | Johnson | 1 | 5,219(0.02%)#62 | 821,792(0.00%)#7,529 |
| 63. | Marshfield | 1 | 5,219(0.02%)#63 | 821,792(0.00%)#7,604 |
1
2Common Questions
What are the Top 10 Cities with the Most Immigrants from Canada in Vermont?
Top 10 Cities with the Most Immigrants from Canada in Vermont are:
#1
367
#2
334
#3
187
#4
113
#5
102
#6
100
#7
89
#8
77
#9
68
#10
58
What city has the Most Immigrants from Canada in Vermont?
Burlington has the Most Immigrants from Canada in Vermont with 367.
What is the Total Immigrants from Canada in the State of Vermont?
Total Immigrants from Canada in Vermont is 5,219.
What is the Total Immigrants from Canada in the United States?
Total Immigrants from Canada in the United States is 821,792.