Cities with the Most Immigrants from Canada in New York
RELATED REPORTS & OPTIONS
Canada
New York
Compare Cities
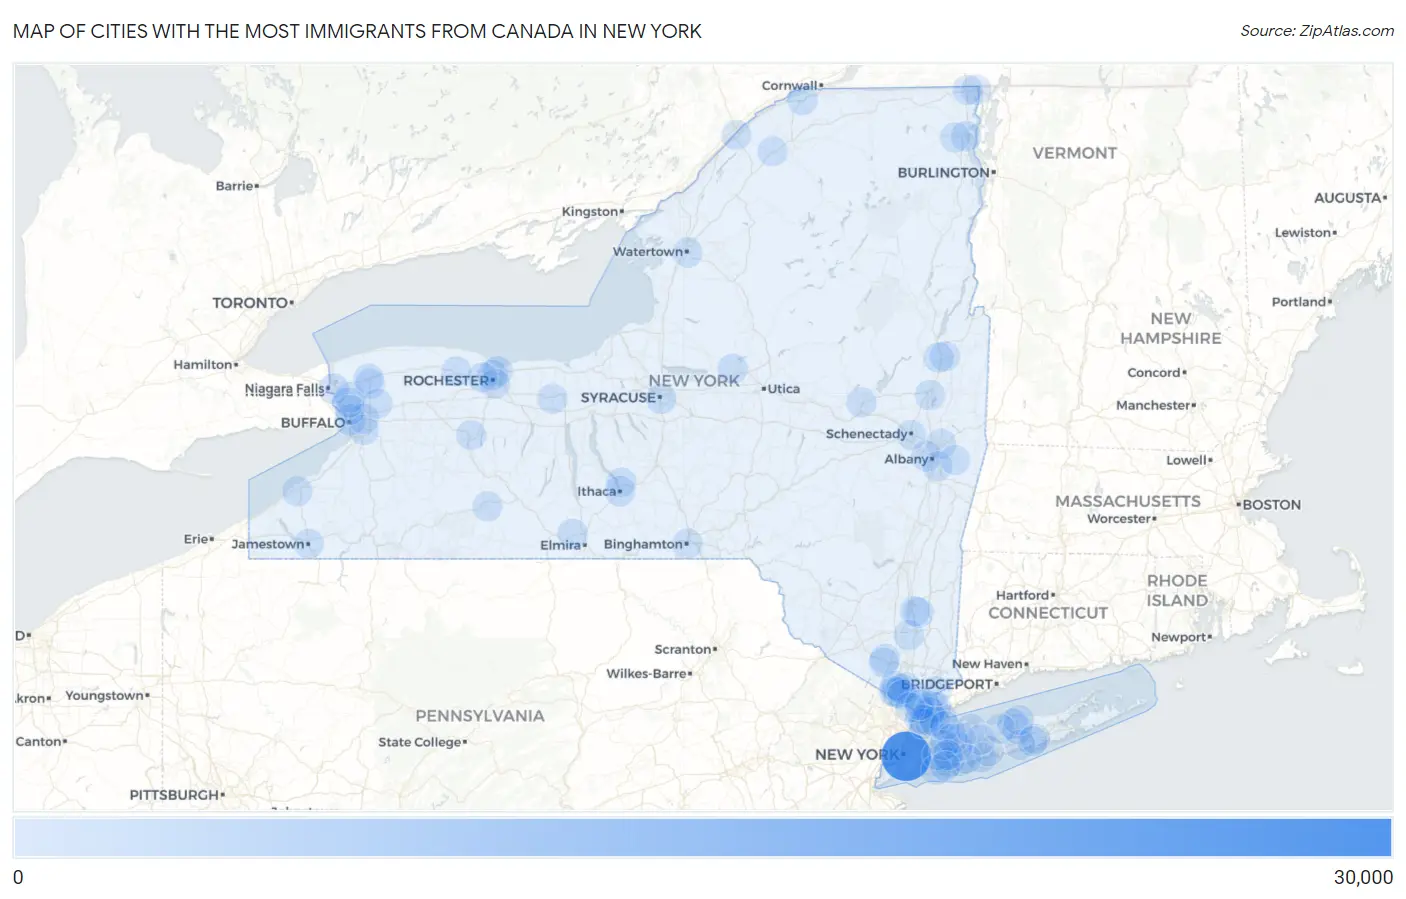
Map of Cities with the Most Immigrants from Canada in New York
0
30,000
Cities with the Most Immigrants from Canada in New York
| City | Canada | vs State | vs National | |
| 1. | New York | 26,201 | 59,107(44.33%)#1 | 821,792(3.19%)#1 |
| 2. | Buffalo | 811 | 59,107(1.37%)#2 | 821,792(0.10%)#101 |
| 3. | Akwesasne | 696 | 59,107(1.18%)#3 | 821,792(0.08%)#135 |
| 4. | Ithaca | 486 | 59,107(0.82%)#4 | 821,792(0.06%)#220 |
| 5. | Rochester | 443 | 59,107(0.75%)#5 | 821,792(0.05%)#252 |
| 6. | Tonawanda | 416 | 59,107(0.70%)#6 | 821,792(0.05%)#274 |
| 7. | Cheektowaga | 376 | 59,107(0.64%)#7 | 821,792(0.05%)#309 |
| 8. | Irondequoit | 351 | 59,107(0.59%)#8 | 821,792(0.04%)#342 |
| 9. | Niagara Falls | 349 | 59,107(0.59%)#9 | 821,792(0.04%)#346 |
| 10. | Albany | 329 | 59,107(0.56%)#10 | 821,792(0.04%)#366 |
| 11. | New Rochelle | 294 | 59,107(0.50%)#11 | 821,792(0.04%)#421 |
| 12. | Rye | 269 | 59,107(0.46%)#12 | 821,792(0.03%)#460 |
| 13. | Big Flats | 267 | 59,107(0.45%)#13 | 821,792(0.03%)#464 |
| 14. | White Plains | 264 | 59,107(0.45%)#14 | 821,792(0.03%)#471 |
| 15. | Syracuse | 246 | 59,107(0.42%)#15 | 821,792(0.03%)#518 |
| 16. | Massena | 227 | 59,107(0.38%)#16 | 821,792(0.03%)#578 |
| 17. | Plattsburgh | 226 | 59,107(0.38%)#17 | 821,792(0.03%)#582 |
| 18. | Red Oaks Mill | 216 | 59,107(0.37%)#18 | 821,792(0.03%)#600 |
| 19. | Brighton | 207 | 59,107(0.35%)#19 | 821,792(0.03%)#633 |
| 20. | Saratoga Springs | 203 | 59,107(0.34%)#20 | 821,792(0.02%)#645 |
| 21. | Spring Valley | 202 | 59,107(0.34%)#21 | 821,792(0.02%)#649 |
| 22. | Harrison | 193 | 59,107(0.33%)#22 | 821,792(0.02%)#674 |
| 23. | Binghamton | 185 | 59,107(0.31%)#23 | 821,792(0.02%)#705 |
| 24. | Monsey | 171 | 59,107(0.29%)#24 | 821,792(0.02%)#751 |
| 25. | Schenectady | 160 | 59,107(0.27%)#25 | 821,792(0.02%)#798 |
| 26. | Terryville | 159 | 59,107(0.27%)#26 | 821,792(0.02%)#807 |
| 27. | Troy | 153 | 59,107(0.26%)#27 | 821,792(0.02%)#845 |
| 28. | Kiryas Joel | 143 | 59,107(0.24%)#28 | 821,792(0.02%)#906 |
| 29. | West Seneca | 142 | 59,107(0.24%)#29 | 821,792(0.02%)#916 |
| 30. | Tarrytown | 138 | 59,107(0.23%)#30 | 821,792(0.02%)#940 |
| 31. | Johnstown | 138 | 59,107(0.23%)#31 | 821,792(0.02%)#941 |
| 32. | New City | 136 | 59,107(0.23%)#32 | 821,792(0.02%)#950 |
| 33. | East Greenbush | 131 | 59,107(0.22%)#33 | 821,792(0.02%)#982 |
| 34. | Yonkers | 129 | 59,107(0.22%)#34 | 821,792(0.02%)#992 |
| 35. | Glens Falls | 129 | 59,107(0.22%)#35 | 821,792(0.02%)#997 |
| 36. | Coram | 128 | 59,107(0.22%)#36 | 821,792(0.02%)#1,004 |
| 37. | De Witt | 123 | 59,107(0.21%)#37 | 821,792(0.01%)#1,043 |
| 38. | East Patchogue | 120 | 59,107(0.20%)#38 | 821,792(0.01%)#1,065 |
| 39. | Beacon | 120 | 59,107(0.20%)#39 | 821,792(0.01%)#1,067 |
| 40. | Viola | 117 | 59,107(0.20%)#40 | 821,792(0.01%)#1,100 |
| 41. | Averill Park | 116 | 59,107(0.20%)#41 | 821,792(0.01%)#1,114 |
| 42. | North Tonawanda | 113 | 59,107(0.19%)#42 | 821,792(0.01%)#1,133 |
| 43. | Watertown | 112 | 59,107(0.19%)#43 | 821,792(0.01%)#1,145 |
| 44. | Scarsdale | 112 | 59,107(0.19%)#44 | 821,792(0.01%)#1,147 |
| 45. | Kenmore | 109 | 59,107(0.18%)#45 | 821,792(0.01%)#1,168 |
| 46. | Wantagh | 106 | 59,107(0.18%)#46 | 821,792(0.01%)#1,208 |
| 47. | South Lockport | 103 | 59,107(0.17%)#47 | 821,792(0.01%)#1,238 |
| 48. | Rouses Point | 99 | 59,107(0.17%)#48 | 821,792(0.01%)#1,289 |
| 49. | Hornell | 96 | 59,107(0.16%)#49 | 821,792(0.01%)#1,314 |
| 50. | Lockport | 94 | 59,107(0.16%)#50 | 821,792(0.01%)#1,329 |
| 51. | Wesley Hills | 91 | 59,107(0.15%)#51 | 821,792(0.01%)#1,372 |
| 52. | Rome | 90 | 59,107(0.15%)#52 | 821,792(0.01%)#1,379 |
| 53. | Babylon | 89 | 59,107(0.15%)#53 | 821,792(0.01%)#1,396 |
| 54. | Dobbs Ferry | 89 | 59,107(0.15%)#54 | 821,792(0.01%)#1,397 |
| 55. | Syosset | 84 | 59,107(0.14%)#55 | 821,792(0.01%)#1,470 |
| 56. | Greenvale | 81 | 59,107(0.14%)#56 | 821,792(0.01%)#1,522 |
| 57. | Bay Shore | 80 | 59,107(0.14%)#57 | 821,792(0.01%)#1,527 |
| 58. | Dix Hills | 80 | 59,107(0.14%)#58 | 821,792(0.01%)#1,532 |
| 59. | Lansing | 80 | 59,107(0.14%)#59 | 821,792(0.01%)#1,542 |
| 60. | Mount Vernon | 79 | 59,107(0.13%)#60 | 821,792(0.01%)#1,543 |
| 61. | West Hempstead | 78 | 59,107(0.13%)#61 | 821,792(0.01%)#1,568 |
| 62. | Baldwin | 77 | 59,107(0.13%)#62 | 821,792(0.01%)#1,578 |
| 63. | New Square | 77 | 59,107(0.13%)#63 | 821,792(0.01%)#1,587 |
| 64. | Miller Place | 74 | 59,107(0.13%)#64 | 821,792(0.01%)#1,628 |
| 65. | Morrisonville | 74 | 59,107(0.13%)#65 | 821,792(0.01%)#1,638 |
| 66. | Fredonia | 73 | 59,107(0.12%)#66 | 821,792(0.01%)#1,651 |
| 67. | Bronxville | 73 | 59,107(0.12%)#67 | 821,792(0.01%)#1,653 |
| 68. | Geneseo | 72 | 59,107(0.12%)#68 | 821,792(0.01%)#1,667 |
| 69. | Hicksville | 71 | 59,107(0.12%)#69 | 821,792(0.01%)#1,671 |
| 70. | Elmont | 71 | 59,107(0.12%)#70 | 821,792(0.01%)#1,672 |
| 71. | Nanuet | 71 | 59,107(0.12%)#71 | 821,792(0.01%)#1,681 |
| 72. | Mamaroneck | 69 | 59,107(0.12%)#72 | 821,792(0.01%)#1,715 |
| 73. | Lawrence | 69 | 59,107(0.12%)#73 | 821,792(0.01%)#1,724 |
| 74. | Tappan | 65 | 59,107(0.11%)#74 | 821,792(0.01%)#1,804 |
| 75. | Massapequa Park | 64 | 59,107(0.11%)#75 | 821,792(0.01%)#1,812 |
| 76. | Spackenkill | 64 | 59,107(0.11%)#76 | 821,792(0.01%)#1,824 |
| 77. | Mastic | 62 | 59,107(0.10%)#77 | 821,792(0.01%)#1,859 |
| 78. | Albertson | 62 | 59,107(0.10%)#78 | 821,792(0.01%)#1,868 |
| 79. | Canton | 61 | 59,107(0.10%)#79 | 821,792(0.01%)#1,891 |
| 80. | Glen Cove | 59 | 59,107(0.10%)#80 | 821,792(0.01%)#1,924 |
| 81. | Jamestown | 58 | 59,107(0.10%)#81 | 821,792(0.01%)#1,941 |
| 82. | Irvington | 58 | 59,107(0.10%)#82 | 821,792(0.01%)#1,950 |
| 83. | Brookville | 58 | 59,107(0.10%)#83 | 821,792(0.01%)#1,955 |
| 84. | Hempstead | 57 | 59,107(0.10%)#84 | 821,792(0.01%)#1,958 |
| 85. | St James | 57 | 59,107(0.10%)#85 | 821,792(0.01%)#1,965 |
| 86. | Brockport | 57 | 59,107(0.10%)#86 | 821,792(0.01%)#1,973 |
| 87. | Champlain | 57 | 59,107(0.10%)#87 | 821,792(0.01%)#1,982 |
| 88. | Greenville Cdp Westchester County | 56 | 59,107(0.09%)#88 | 821,792(0.01%)#2,001 |
| 89. | Shirley | 55 | 59,107(0.09%)#89 | 821,792(0.01%)#2,012 |
| 90. | Huntington | 55 | 59,107(0.09%)#90 | 821,792(0.01%)#2,015 |
| 91. | Oceanside | 54 | 59,107(0.09%)#91 | 821,792(0.01%)#2,035 |
| 92. | Latham | 54 | 59,107(0.09%)#92 | 821,792(0.01%)#2,040 |
| 93. | North Gates | 52 | 59,107(0.09%)#93 | 821,792(0.01%)#2,109 |
| 94. | Clarence Center | 51 | 59,107(0.09%)#94 | 821,792(0.01%)#2,144 |
| 95. | Ogdensburg | 50 | 59,107(0.08%)#95 | 821,792(0.01%)#2,168 |
| 96. | Newark | 50 | 59,107(0.08%)#96 | 821,792(0.01%)#2,171 |
| 97. | Armonk | 49 | 59,107(0.08%)#97 | 821,792(0.01%)#2,202 |
| 98. | South Lansing | 49 | 59,107(0.08%)#98 | 821,792(0.01%)#2,208 |
| 99. | West Glens Falls | 48 | 59,107(0.08%)#99 | 821,792(0.01%)#2,225 |
| 100. | Monroe | 48 | 59,107(0.08%)#100 | 821,792(0.01%)#2,226 |
Common Questions
What are the Top 10 Cities with the Most Immigrants from Canada in New York?
Top 10 Cities with the Most Immigrants from Canada in New York are:
#1
26,201
#2
811
#3
486
#4
443
#5
416
#6
376
#7
351
#8
349
#9
329
#10
294
What city has the Most Immigrants from Canada in New York?
New York has the Most Immigrants from Canada in New York with 26,201.
What is the Total Immigrants from Canada in the State of New York?
Total Immigrants from Canada in New York is 59,107.
What is the Total Immigrants from Canada in the United States?
Total Immigrants from Canada in the United States is 821,792.