Naval Academy, MD
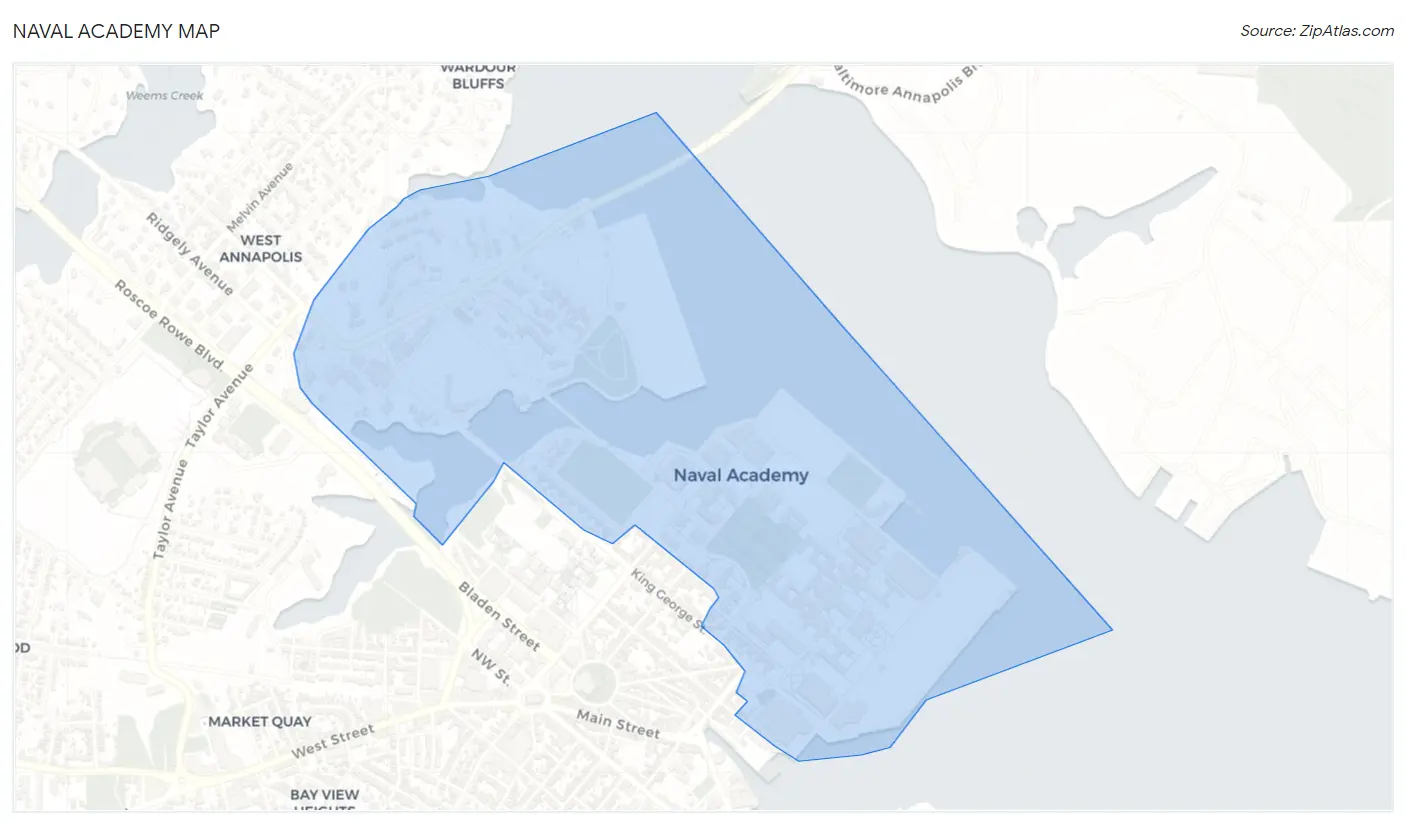
Naval Academy Map
Naval Academy Overview
2,016
TOTAL POPULATION
1,516
MALE POPULATION
500
FEMALE POPULATION
303.20
MALES / 100 FEMALES
32.98
FEMALES / 100 MALES
21.5
MEDIAN AGE
3.8
AVG FAMILY SIZE
2.9
AVG HOUSEHOLD SIZE
$28,215
PER CAPITA INCOME
$115,125
AVG FAMILY INCOME
$114,054
AVG HOUSEHOLD INCOME
26.6%
WAGE / INCOME GAP [ % ]
73.4¢/ $1
WAGE / INCOME GAP [ $ ]
0.16
INEQUALITY / GINI INDEX
1,734
LABOR FORCE [ PEOPLE ]
93.8%
PERCENT IN LABOR FORCE
2.3%
UNEMPLOYMENT RATE
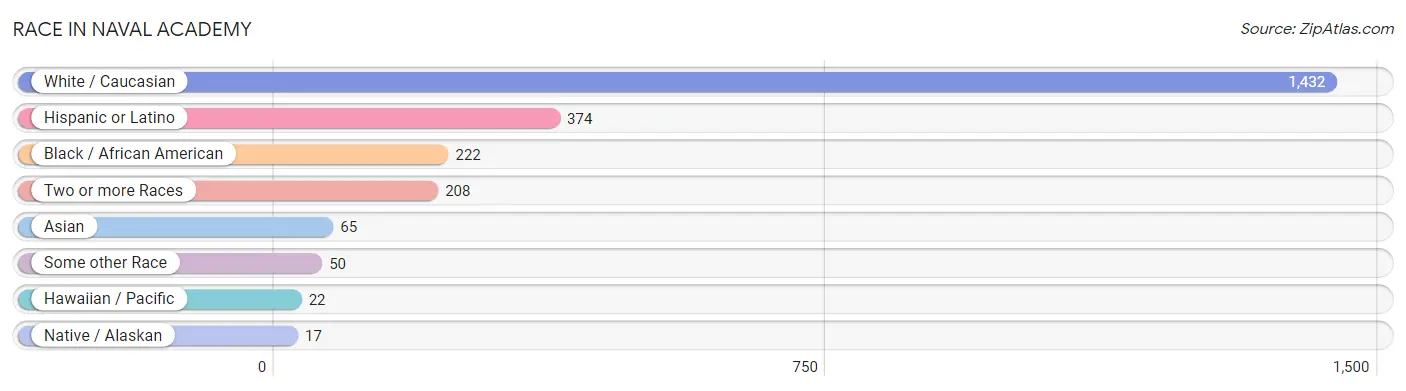
Race in Naval Academy
The most populous races in Naval Academy are White / Caucasian (1,432 | 71.0%), Hispanic or Latino (374 | 18.5%), and Black / African American (222 | 11.0%).
| Race | # Population | % Population |
| Asian | 65 | 3.2% |
| Black / African American | 222 | 11.0% |
| Hawaiian / Pacific | 22 | 1.1% |
| Hispanic or Latino | 374 | 18.5% |
| Native / Alaskan | 17 | 0.8% |
| White / Caucasian | 1,432 | 71.0% |
| Two or more Races | 208 | 10.3% |
| Some other Race | 50 | 2.5% |
| Total | 2,016 | 100.0% |
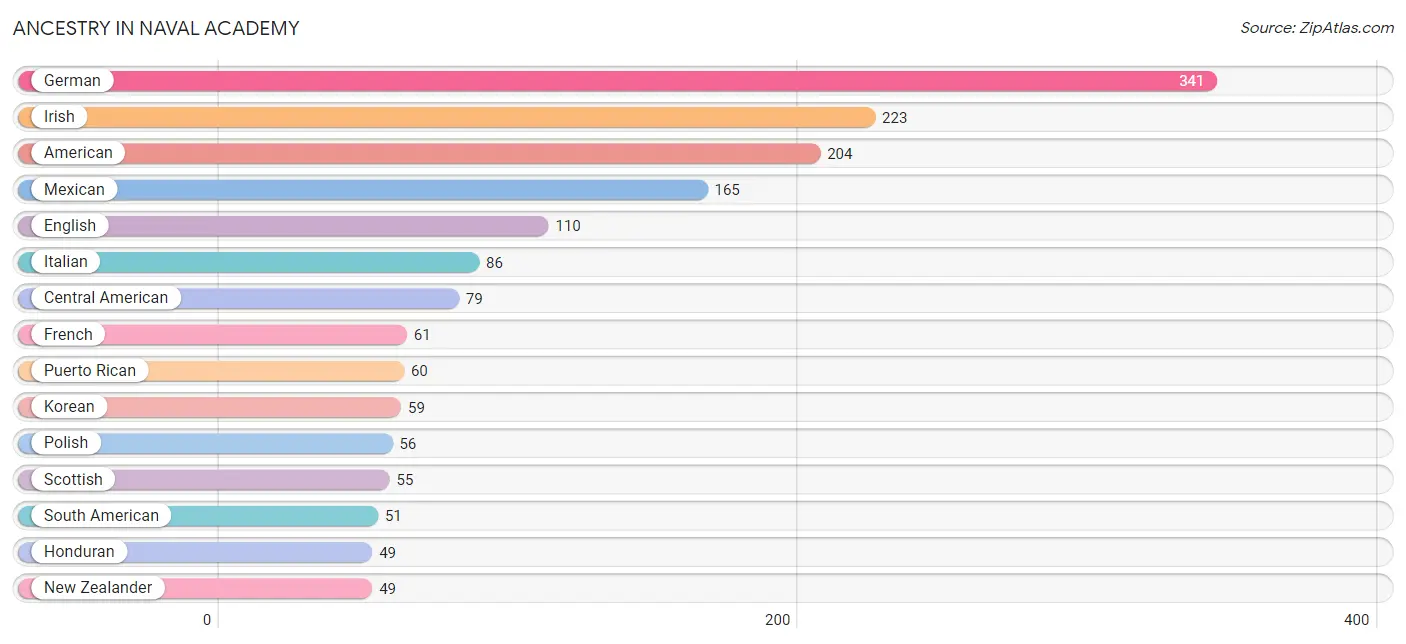
Ancestry in Naval Academy
The most populous ancestries reported in Naval Academy are German (341 | 16.9%), Irish (223 | 11.1%), American (204 | 10.1%), Mexican (165 | 8.2%), and English (110 | 5.5%), together accounting for 51.7% of all Naval Academy residents.
| Ancestry | # Population | % Population |
| African | 27 | 1.3% |
| American | 204 | 10.1% |
| Austrian | 8 | 0.4% |
| Bhutanese | 18 | 0.9% |
| Bolivian | 17 | 0.8% |
| British | 17 | 0.8% |
| Burmese | 27 | 1.3% |
| Canadian | 9 | 0.4% |
| Central American | 79 | 3.9% |
| Colombian | 17 | 0.8% |
| Costa Rican | 4 | 0.2% |
| Cuban | 1 | 0.1% |
| Czech | 32 | 1.6% |
| Danish | 9 | 0.4% |
| Dutch | 39 | 1.9% |
| Eastern European | 19 | 0.9% |
| English | 110 | 5.5% |
| European | 39 | 1.9% |
| Finnish | 9 | 0.4% |
| French | 61 | 3.0% |
| German | 341 | 16.9% |
| Greek | 12 | 0.6% |
| Guamanian / Chamorro | 9 | 0.4% |
| Haitian | 9 | 0.4% |
| Honduran | 49 | 2.4% |
| Indian (Asian) | 26 | 1.3% |
| Irish | 223 | 11.1% |
| Italian | 86 | 4.3% |
| Jamaican | 8 | 0.4% |
| Korean | 59 | 2.9% |
| Lithuanian | 4 | 0.2% |
| Mexican | 165 | 8.2% |
| Native Hawaiian | 4 | 0.2% |
| Navajo | 26 | 1.3% |
| New Zealander | 49 | 2.4% |
| Nicaraguan | 9 | 0.4% |
| Northern European | 34 | 1.7% |
| Panamanian | 9 | 0.4% |
| Polish | 56 | 2.8% |
| Portuguese | 18 | 0.9% |
| Puerto Rican | 60 | 3.0% |
| Russian | 5 | 0.3% |
| Salvadoran | 4 | 0.2% |
| Samoan | 9 | 0.4% |
| Scotch-Irish | 18 | 0.9% |
| Scottish | 55 | 2.7% |
| South American | 51 | 2.5% |
| Sri Lankan | 17 | 0.8% |
| Subsaharan African | 27 | 1.3% |
| Swedish | 33 | 1.6% |
| Ukrainian | 4 | 0.2% |
| Venezuelan | 17 | 0.8% |
| Yugoslavian | 8 | 0.4% | View All 53 Rows |
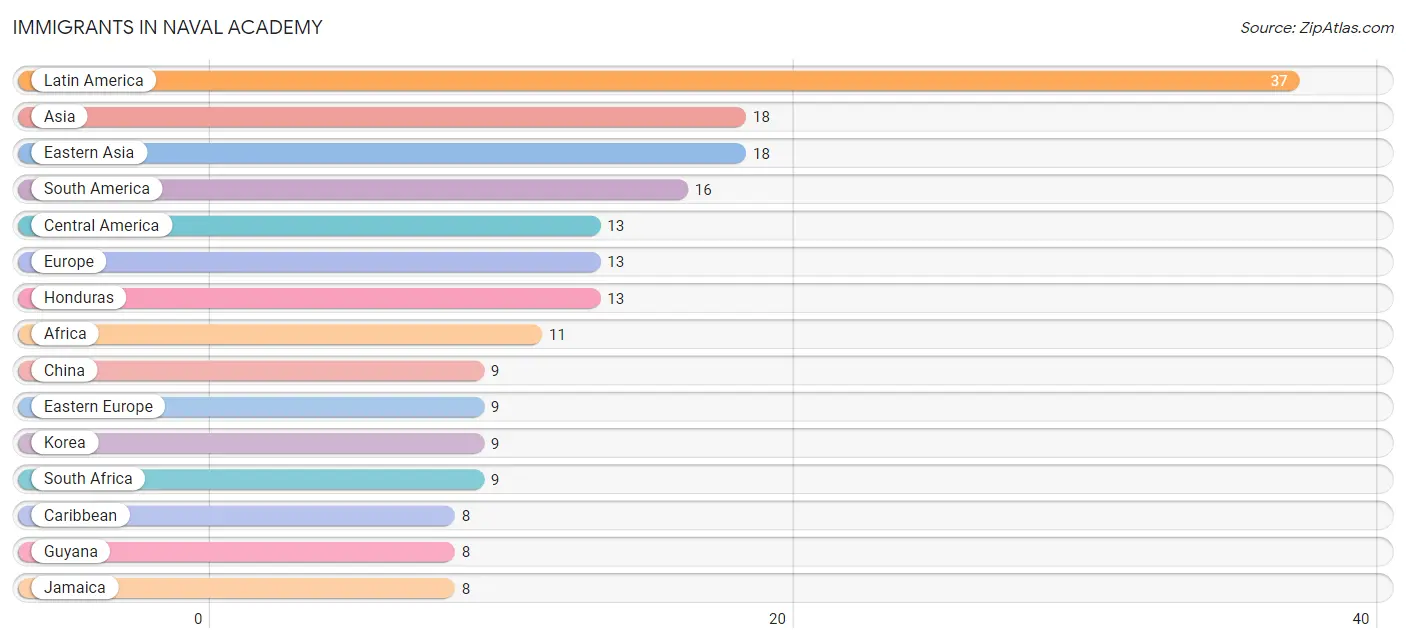
Immigrants in Naval Academy
The most numerous immigrant groups reported in Naval Academy came from Latin America (37 | 1.8%), Asia (18 | 0.9%), Eastern Asia (18 | 0.9%), South America (16 | 0.8%), and Central America (13 | 0.6%), together accounting for 5.1% of all Naval Academy residents.
| Immigration Origin | # Population | % Population |
| Africa | 11 | 0.5% |
| Asia | 18 | 0.9% |
| Belgium | 4 | 0.2% |
| Caribbean | 8 | 0.4% |
| Central America | 13 | 0.6% |
| China | 9 | 0.4% |
| Eastern Asia | 18 | 0.9% |
| Eastern Europe | 9 | 0.4% |
| Europe | 13 | 0.6% |
| Ghana | 2 | 0.1% |
| Guyana | 8 | 0.4% |
| Honduras | 13 | 0.6% |
| Jamaica | 8 | 0.4% |
| Korea | 9 | 0.4% |
| Latin America | 37 | 1.8% |
| Poland | 4 | 0.2% |
| Russia | 5 | 0.3% |
| South Africa | 9 | 0.4% |
| South America | 16 | 0.8% |
| Venezuela | 8 | 0.4% |
| Western Africa | 2 | 0.1% |
| Western Europe | 4 | 0.2% | View All 22 Rows |
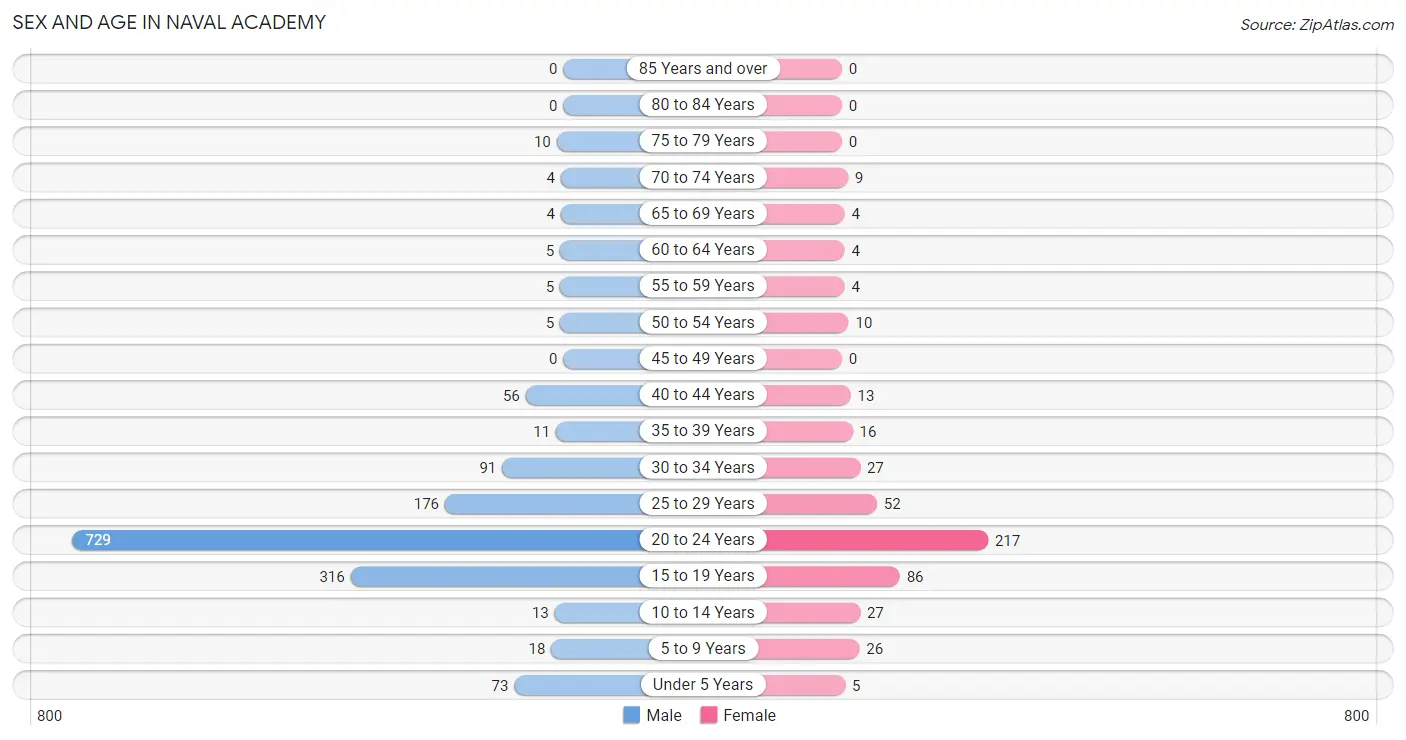
Sex and Age in Naval Academy
Sex and Age in Naval Academy
The most populous age groups in Naval Academy are 20 to 24 Years (729 | 48.1%) for men and 20 to 24 Years (217 | 43.4%) for women.
| Age Bracket | Male | Female |
| Under 5 Years | 73 (4.8%) | 5 (1.0%) |
| 5 to 9 Years | 18 (1.2%) | 26 (5.2%) |
| 10 to 14 Years | 13 (0.9%) | 27 (5.4%) |
| 15 to 19 Years | 316 (20.8%) | 86 (17.2%) |
| 20 to 24 Years | 729 (48.1%) | 217 (43.4%) |
| 25 to 29 Years | 176 (11.6%) | 52 (10.4%) |
| 30 to 34 Years | 91 (6.0%) | 27 (5.4%) |
| 35 to 39 Years | 11 (0.7%) | 16 (3.2%) |
| 40 to 44 Years | 56 (3.7%) | 13 (2.6%) |
| 45 to 49 Years | 0 (0.0%) | 0 (0.0%) |
| 50 to 54 Years | 5 (0.3%) | 10 (2.0%) |
| 55 to 59 Years | 5 (0.3%) | 4 (0.8%) |
| 60 to 64 Years | 5 (0.3%) | 4 (0.8%) |
| 65 to 69 Years | 4 (0.3%) | 4 (0.8%) |
| 70 to 74 Years | 4 (0.3%) | 9 (1.8%) |
| 75 to 79 Years | 10 (0.7%) | 0 (0.0%) |
| 80 to 84 Years | 0 (0.0%) | 0 (0.0%) |
| 85 Years and over | 0 (0.0%) | 0 (0.0%) |
| Total | 1,516 (100.0%) | 500 (100.0%) |
Families and Households in Naval Academy
Median Family Size in Naval Academy
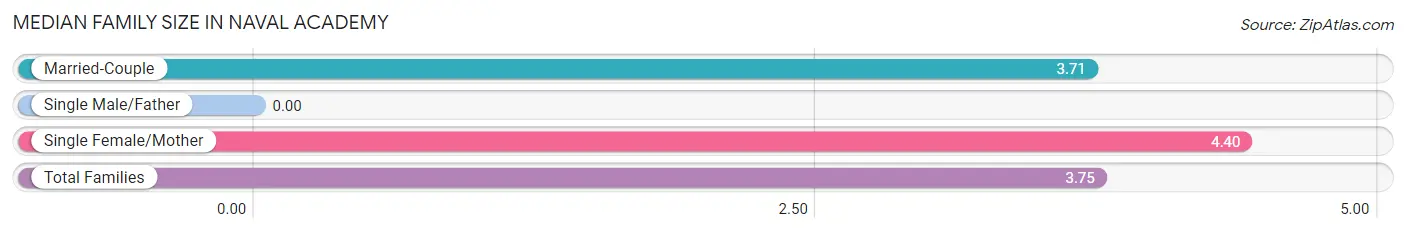
| Family Type | # Families | Family Size |
| Married-Couple | 90 (94.7%) | 3.71 |
| Single Male/Father | 0 (0.0%) | - |
| Single Female/Mother | 5 (5.3%) | 4.40 |
| Total Families | 95 (100.0%) | 3.75 |
Median Household Size in Naval Academy
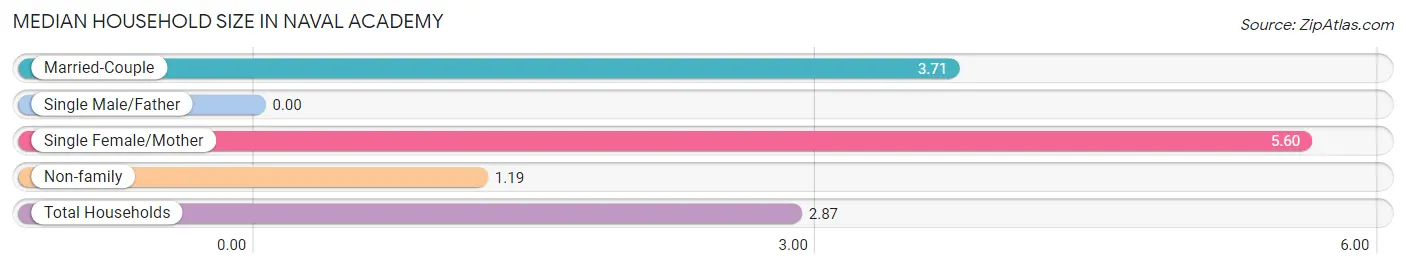
| Household Type | # Households | Household Size |
| Married-Couple | 90 (60.8%) | 3.71 |
| Single Male/Father | 0 (0.0%) | - |
| Single Female/Mother | 5 (3.4%) | 5.60 |
| Non-family | 53 (35.8%) | 1.19 |
| Total Households | 148 (100.0%) | 2.87 |
Household Size by Marriage Status in Naval Academy
Out of a total of 148 households in Naval Academy, 95 (64.2%) are family households, while 53 (35.8%) are nonfamily households. The most numerous type of family households are 4-person households, comprising 36, and the most common type of nonfamily households are 1-person households, comprising 49.
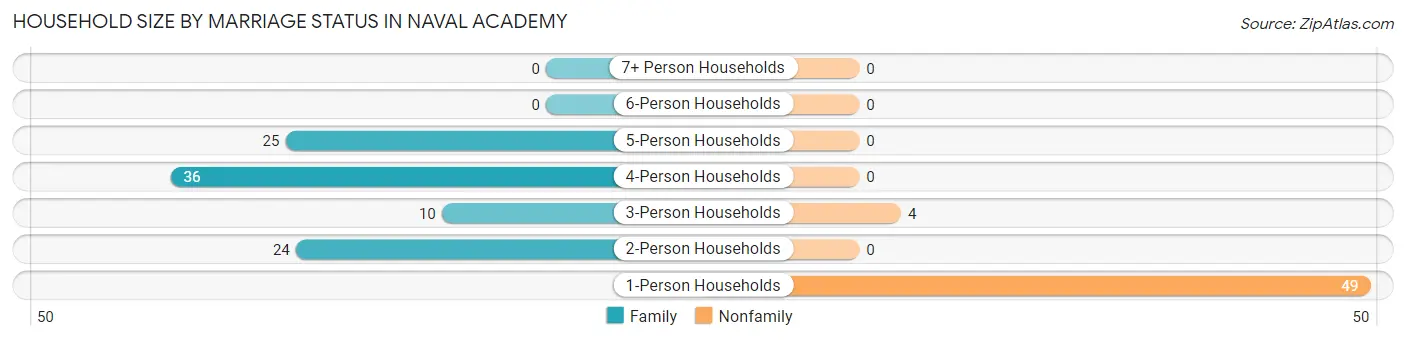
| Household Size | Family Households | Nonfamily Households |
| 1-Person Households | - | 49 (33.1%) |
| 2-Person Households | 24 (16.2%) | 0 (0.0%) |
| 3-Person Households | 10 (6.8%) | 4 (2.7%) |
| 4-Person Households | 36 (24.3%) | 0 (0.0%) |
| 5-Person Households | 25 (16.9%) | 0 (0.0%) |
| 6-Person Households | 0 (0.0%) | 0 (0.0%) |
| 7+ Person Households | 0 (0.0%) | 0 (0.0%) |
| Total | 95 (64.2%) | 53 (35.8%) |
Female Fertility in Naval Academy
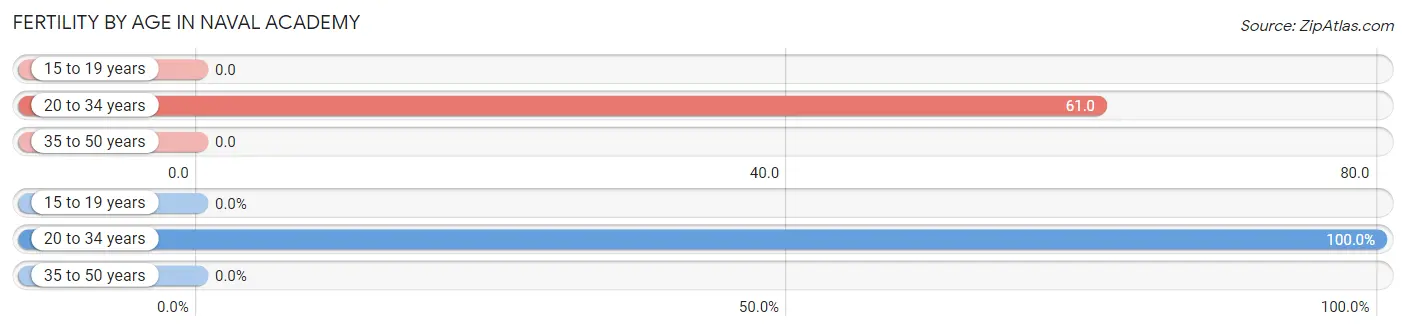
Fertility by Age in Naval Academy
Average fertility rate in Naval Academy is 43.0 births per 1,000 women. Women in the age bracket of 20 to 34 years have the highest fertility rate with 61.0 births per 1,000 women. Women in the age bracket of 20 to 34 years acount for 100.0% of all women with births.
| Age Bracket | Women with Births | Births / 1,000 Women |
| 15 to 19 years | 0 (0.0%) | 0.0 |
| 20 to 34 years | 18 (100.0%) | 61.0 |
| 35 to 50 years | 0 (0.0%) | 0.0 |
| Total | 18 (100.0%) | 43.0 |
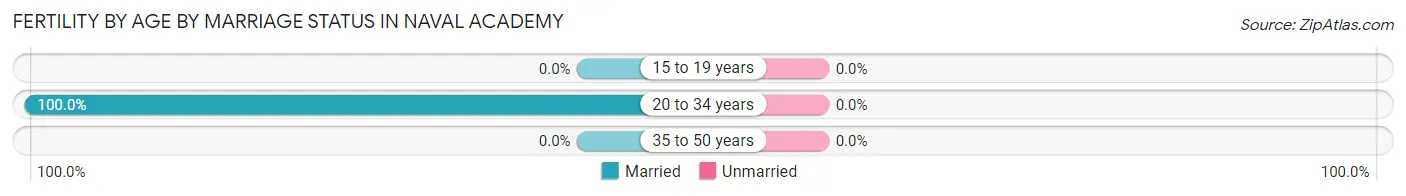
Fertility by Age by Marriage Status in Naval Academy
| Age Bracket | Married | Unmarried |
| 15 to 19 years | 0 (0.0%) | 0 (0.0%) |
| 20 to 34 years | 18 (100.0%) | 0 (0.0%) |
| 35 to 50 years | 0 (0.0%) | 0 (0.0%) |
| Total | 18 (100.0%) | 0 (0.0%) |
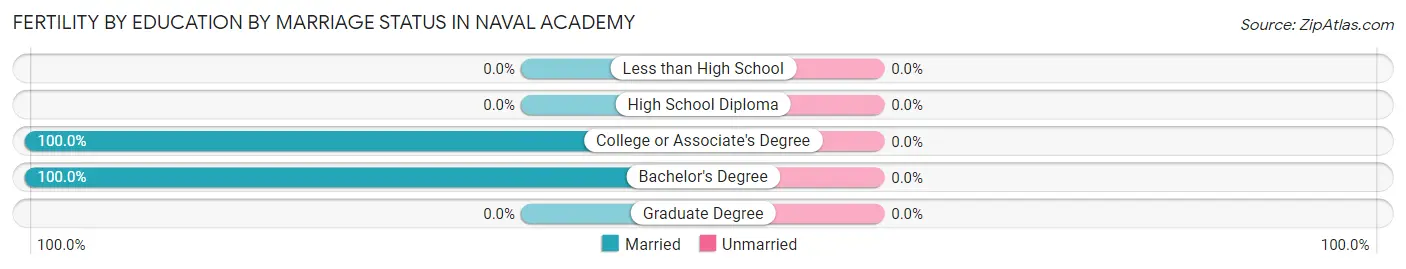
Fertility by Education in Naval Academy

| Educational Attainment | Women with Births | Births / 1,000 Women |
| Less than High School | 0 (0.0%) | 0.0 |
| High School Diploma | 0 (0.0%) | 0.0 |
| College or Associate's Degree | 13 (72.2%) | 74.0 |
| Bachelor's Degree | 5 (27.8%) | 139.0 |
| Graduate Degree | 0 (0.0%) | 0.0 |
| Total | 18 (100.0%) | 43.0 |
Fertility by Education by Marriage Status in Naval Academy
| Educational Attainment | Married | Unmarried |
| Less than High School | 0 (0.0%) | 0 (0.0%) |
| High School Diploma | 0 (0.0%) | 0 (0.0%) |
| College or Associate's Degree | 13 (100.0%) | 0 (0.0%) |
| Bachelor's Degree | 5 (100.0%) | 0 (0.0%) |
| Graduate Degree | 0 (0.0%) | 0 (0.0%) |
| Total | 18 (100.0%) | 0 (0.0%) |
Income in Naval Academy
Income Overview in Naval Academy
Per Capita Income in Naval Academy is $28,215, while median incomes of families and households are $115,125 and $114,054 respectively.
| Characteristic | Number | Measure |
| Per Capita Income | 2,016 | $28,215 |
| Median Family Income | 95 | $115,125 |
| Mean Family Income | 95 | $109,824 |
| Median Household Income | 148 | $114,054 |
| Mean Household Income | 148 | $115,786 |
| Income Deficit | 95 | $0 |
| Wage / Income Gap (%) | 2,016 | 26.64% |
| Wage / Income Gap ($) | 2,016 | 73.36¢ per $1 |
| Gini / Inequality Index | 2,016 | 0.16 |
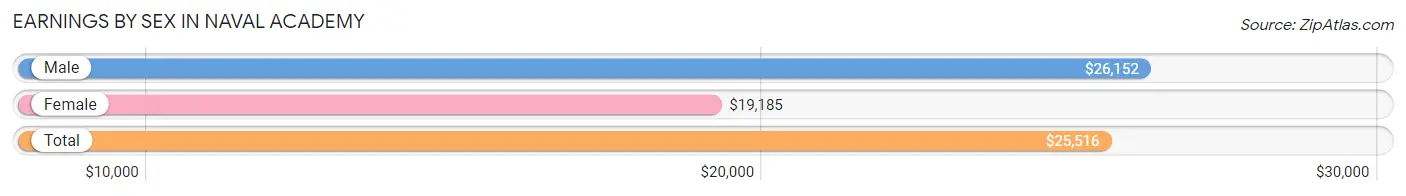
Earnings by Sex in Naval Academy
Average Earnings in Naval Academy are $25,516, $26,152 for men and $19,185 for women, a difference of 26.6%.
| Sex | Number | Average Earnings |
| Male | 1,380 (78.6%) | $26,152 |
| Female | 376 (21.4%) | $19,185 |
| Total | 1,756 (100.0%) | $25,516 |
Earnings by Sex by Income Bracket in Naval Academy
The most common earnings brackets in Naval Academy are $25,000 to $29,999 for men (285 | 20.6%) and $15,000 to $17,499 for women (61 | 16.2%).
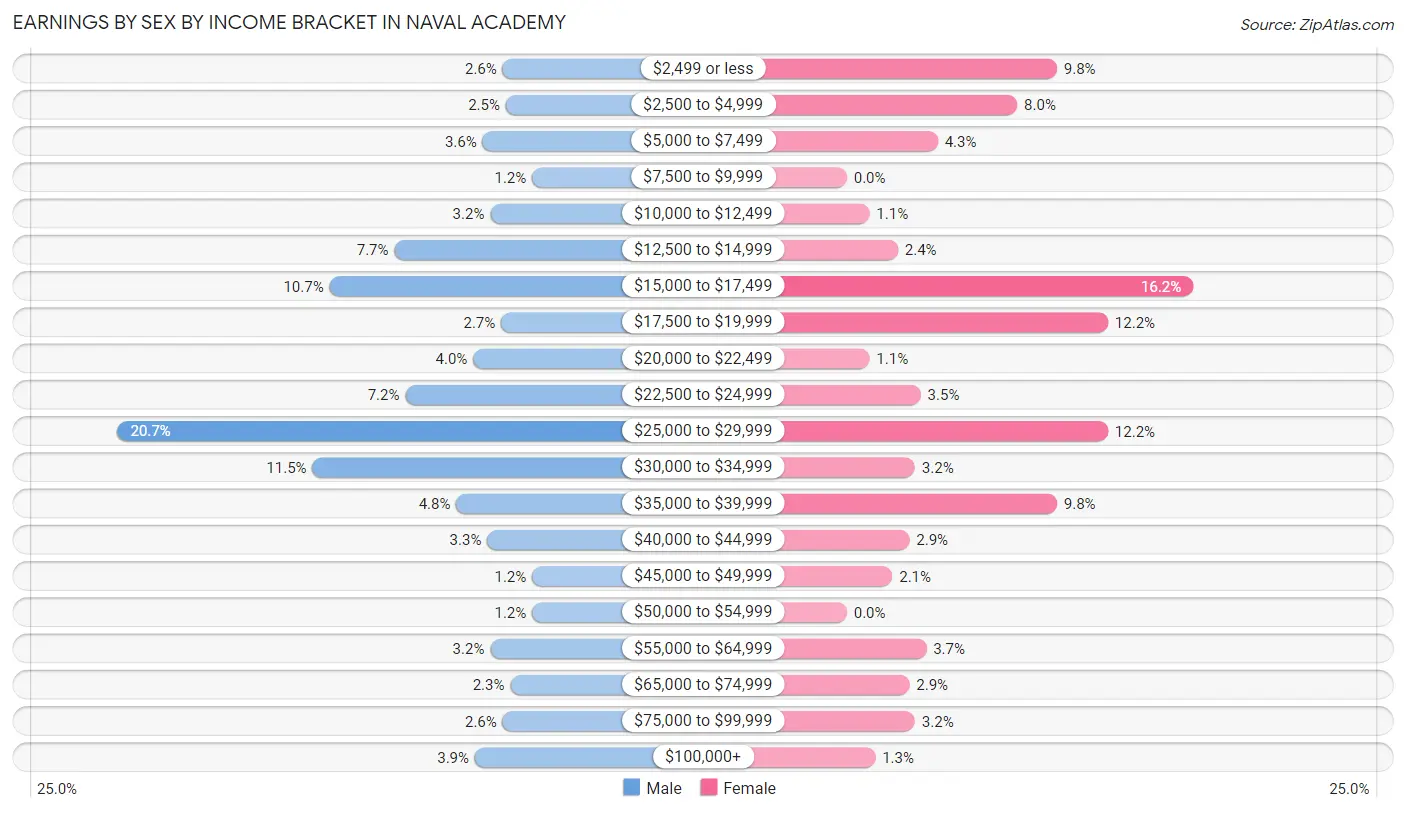
| Income | Male | Female |
| $2,499 or less | 36 (2.6%) | 37 (9.8%) |
| $2,500 to $4,999 | 34 (2.5%) | 30 (8.0%) |
| $5,000 to $7,499 | 49 (3.5%) | 16 (4.3%) |
| $7,500 to $9,999 | 17 (1.2%) | 0 (0.0%) |
| $10,000 to $12,499 | 44 (3.2%) | 4 (1.1%) |
| $12,500 to $14,999 | 106 (7.7%) | 9 (2.4%) |
| $15,000 to $17,499 | 148 (10.7%) | 61 (16.2%) |
| $17,500 to $19,999 | 37 (2.7%) | 46 (12.2%) |
| $20,000 to $22,499 | 55 (4.0%) | 4 (1.1%) |
| $22,500 to $24,999 | 99 (7.2%) | 13 (3.5%) |
| $25,000 to $29,999 | 285 (20.6%) | 46 (12.2%) |
| $30,000 to $34,999 | 159 (11.5%) | 12 (3.2%) |
| $35,000 to $39,999 | 66 (4.8%) | 37 (9.8%) |
| $40,000 to $44,999 | 46 (3.3%) | 11 (2.9%) |
| $45,000 to $49,999 | 17 (1.2%) | 8 (2.1%) |
| $50,000 to $54,999 | 17 (1.2%) | 0 (0.0%) |
| $55,000 to $64,999 | 44 (3.2%) | 14 (3.7%) |
| $65,000 to $74,999 | 31 (2.2%) | 11 (2.9%) |
| $75,000 to $99,999 | 36 (2.6%) | 12 (3.2%) |
| $100,000+ | 54 (3.9%) | 5 (1.3%) |
| Total | 1,380 (100.0%) | 376 (100.0%) |
Earnings by Sex by Educational Attainment in Naval Academy

| Educational Attainment | Male Income | Female Income |
| Less than High School | - | - |
| High School Diploma | - | - |
| College or Associate's Degree | - | - |
| Bachelor's Degree | $48,333 | $46,250 |
| Graduate Degree | $99,500 | $0 |
| Total | - | - |
Family Income in Naval Academy
Family Income Brackets in Naval Academy
According to the Naval Academy family income data, there are 39 families falling into the $100,000 to $149,999 income range, which is the most common income bracket and makes up 41.0% of all families.
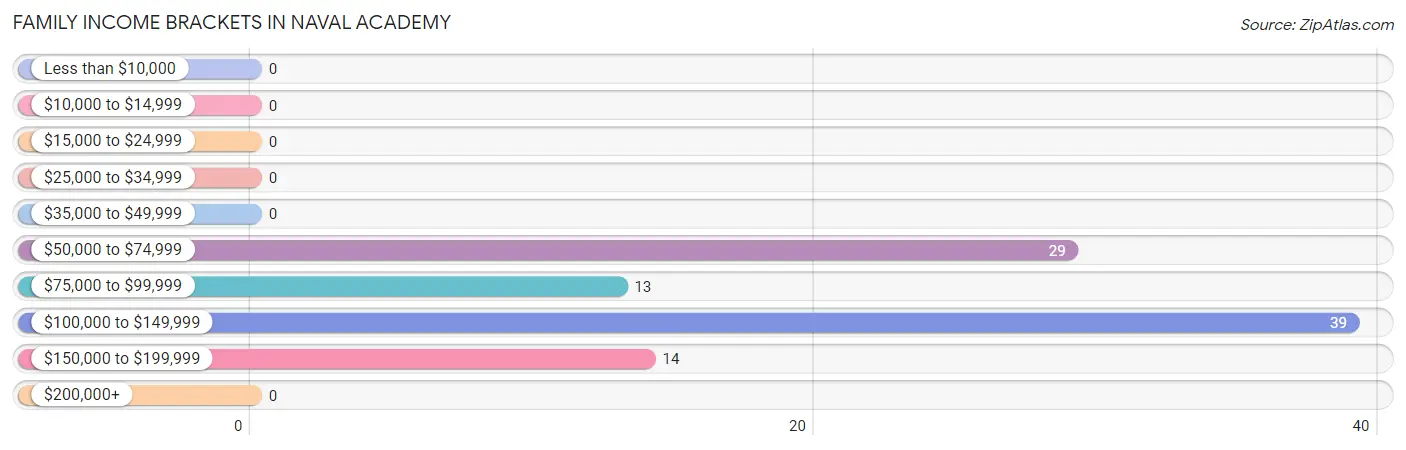
| Income Bracket | # Families | % Families |
| Less than $10,000 | 0 | 0.0% |
| $10,000 to $14,999 | 0 | 0.0% |
| $15,000 to $24,999 | 0 | 0.0% |
| $25,000 to $34,999 | 0 | 0.0% |
| $35,000 to $49,999 | 0 | 0.0% |
| $50,000 to $74,999 | 29 | 30.5% |
| $75,000 to $99,999 | 13 | 13.7% |
| $100,000 to $149,999 | 39 | 41.1% |
| $150,000 to $199,999 | 14 | 14.7% |
| $200,000+ | 0 | 0.0% |
Family Income by Famaliy Size in Naval Academy
2-person families (24 | 25.3%) account for the highest median family income in Naval Academy with $121,000 per family, while 2-person families (24 | 25.3%) have the highest median income of $60,500 per family member.
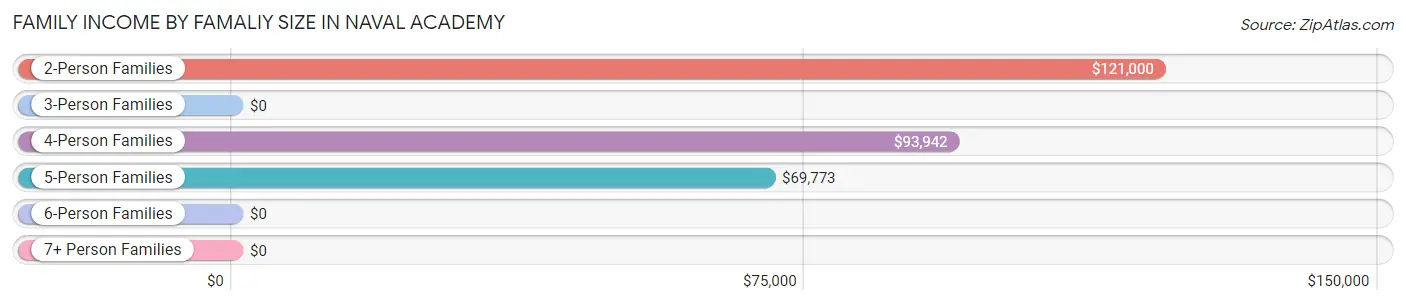
| Income Bracket | # Families | Median Income |
| 2-Person Families | 24 (25.3%) | $121,000 |
| 3-Person Families | 10 (10.5%) | $0 |
| 4-Person Families | 41 (43.2%) | $93,942 |
| 5-Person Families | 20 (21.0%) | $69,773 |
| 6-Person Families | 0 (0.0%) | $0 |
| 7+ Person Families | 0 (0.0%) | $0 |
| Total | 95 (100.0%) | $115,125 |
Family Income by Number of Earners in Naval Academy
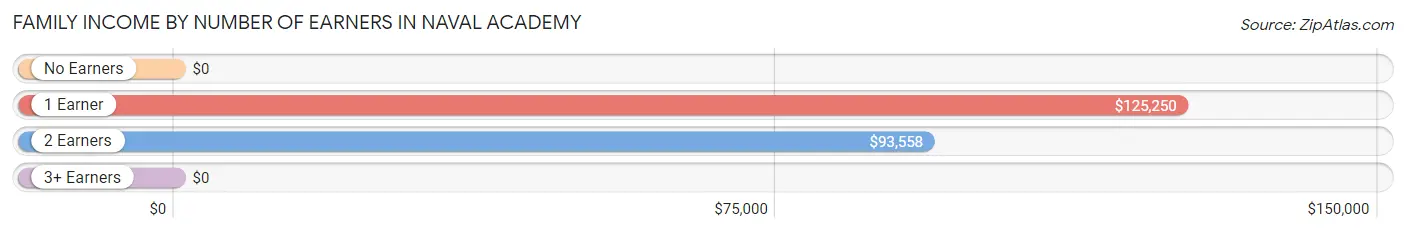
| Number of Earners | # Families | Median Income |
| No Earners | 10 (10.5%) | $0 |
| 1 Earner | 47 (49.5%) | $125,250 |
| 2 Earners | 33 (34.7%) | $93,558 |
| 3+ Earners | 5 (5.3%) | $0 |
| Total | 95 (100.0%) | $115,125 |
Household Income in Naval Academy
Household Income Brackets in Naval Academy
With 83 households falling in the category, the $100,000 to $149,999 income range is the most frequent in Naval Academy, accounting for 56.1% of all households.

| Income Bracket | # Households | % Households |
| Less than $10,000 | 0 | 0.0% |
| $10,000 to $14,999 | 0 | 0.0% |
| $15,000 to $24,999 | 0 | 0.0% |
| $25,000 to $34,999 | 0 | 0.0% |
| $35,000 to $49,999 | 0 | 0.0% |
| $50,000 to $74,999 | 29 | 19.6% |
| $75,000 to $99,999 | 13 | 8.8% |
| $100,000 to $149,999 | 83 | 56.1% |
| $150,000 to $199,999 | 19 | 12.8% |
| $200,000+ | 4 | 2.7% |
Household Income by Householder Age in Naval Academy
The median household income in Naval Academy is $114,054, with the highest median household income of $163,500 found in the 65+ years age bracket for the primary householder. A total of 22 households (14.9%) fall into this category. Meanwhile, the 15 to 24 years age bracket for the primary householder has the lowest median household income of $0, with 13 households (8.8%) in this group.
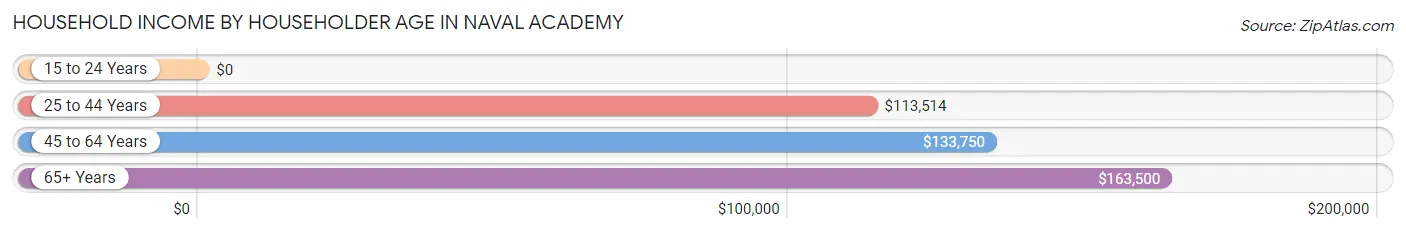
| Income Bracket | # Households | Median Income |
| 15 to 24 Years | 13 (8.8%) | $0 |
| 25 to 44 Years | 98 (66.2%) | $113,514 |
| 45 to 64 Years | 15 (10.1%) | $133,750 |
| 65+ Years | 22 (14.9%) | $163,500 |
| Total | 148 (100.0%) | $114,054 |
Poverty in Naval Academy
Income Below Poverty by Sex and Age in Naval Academy
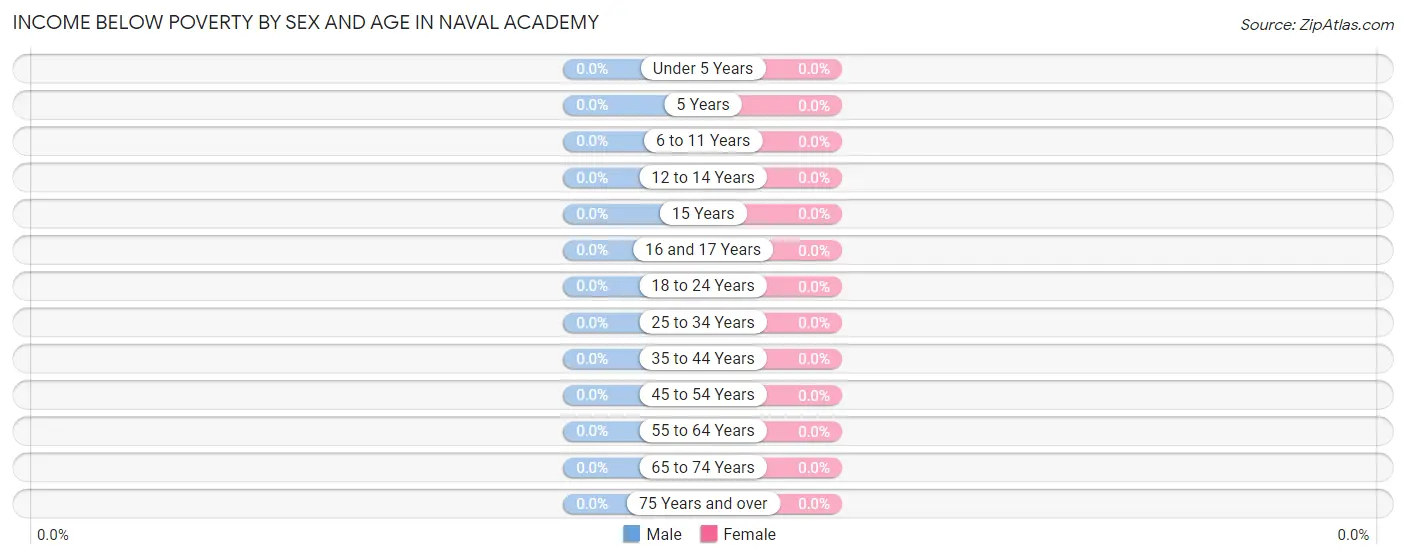
| Age Bracket | Male | Female |
| Under 5 Years | 0 (0.0%) | 0 (0.0%) |
| 5 Years | 0 (0.0%) | 0 (0.0%) |
| 6 to 11 Years | 0 (0.0%) | 0 (0.0%) |
| 12 to 14 Years | 0 (0.0%) | 0 (0.0%) |
| 15 Years | 0 (0.0%) | 0 (0.0%) |
| 16 and 17 Years | 0 (0.0%) | 0 (0.0%) |
| 18 to 24 Years | 0 (0.0%) | 0 (0.0%) |
| 25 to 34 Years | 0 (0.0%) | 0 (0.0%) |
| 35 to 44 Years | 0 (0.0%) | 0 (0.0%) |
| 45 to 54 Years | 0 (0.0%) | 0 (0.0%) |
| 55 to 64 Years | 0 (0.0%) | 0 (0.0%) |
| 65 to 74 Years | 0 (0.0%) | 0 (0.0%) |
| 75 Years and over | 0 (0.0%) | 0 (0.0%) |
| Total | 0 (0.0%) | 0 (0.0%) |
Income Above Poverty by Sex and Age in Naval Academy
According to the poverty statistics in Naval Academy, males aged under 5 years and females aged under 5 years are the age groups that are most secure financially, with 100.0% of males and 100.0% of females in these age groups living above the poverty line.
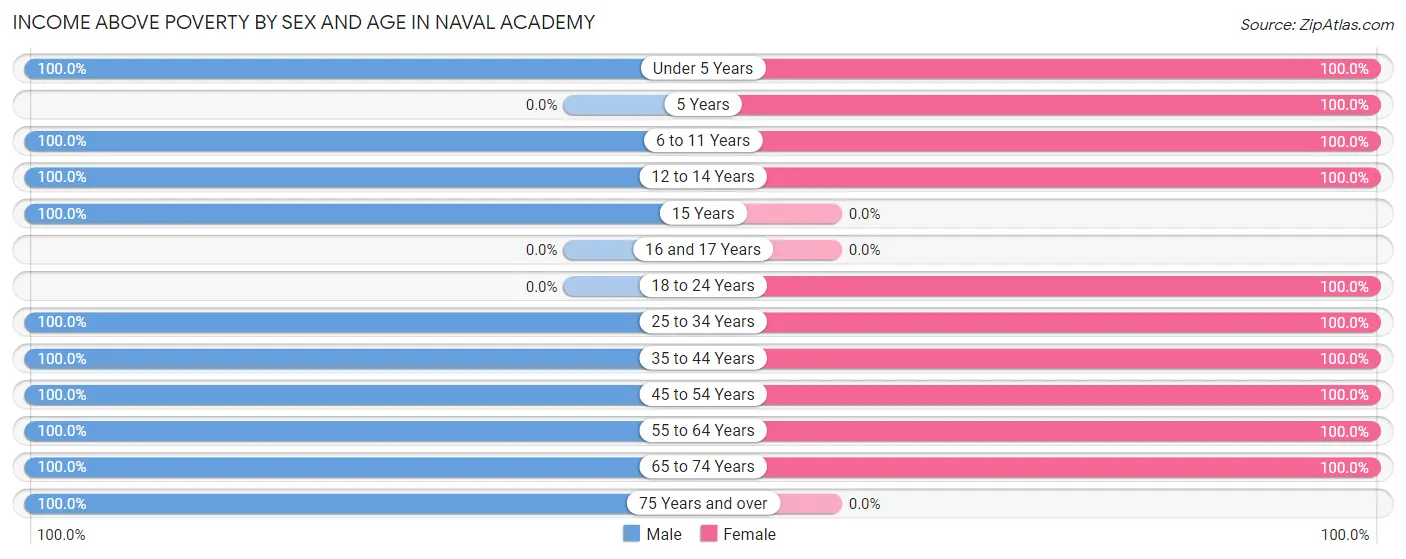
| Age Bracket | Male | Female |
| Under 5 Years | 73 (100.0%) | 5 (100.0%) |
| 5 Years | 0 (0.0%) | 14 (100.0%) |
| 6 to 11 Years | 27 (100.0%) | 17 (100.0%) |
| 12 to 14 Years | 4 (100.0%) | 22 (100.0%) |
| 15 Years | 5 (100.0%) | 0 (0.0%) |
| 16 and 17 Years | 0 (0.0%) | 0 (0.0%) |
| 18 to 24 Years | 0 (0.0%) | 20 (100.0%) |
| 25 to 34 Years | 56 (100.0%) | 32 (100.0%) |
| 35 to 44 Years | 57 (100.0%) | 29 (100.0%) |
| 45 to 54 Years | 5 (100.0%) | 10 (100.0%) |
| 55 to 64 Years | 10 (100.0%) | 8 (100.0%) |
| 65 to 74 Years | 8 (100.0%) | 13 (100.0%) |
| 75 Years and over | 10 (100.0%) | 0 (0.0%) |
| Total | 255 (100.0%) | 170 (100.0%) |
Income Below Poverty Among Married-Couple Families in Naval Academy
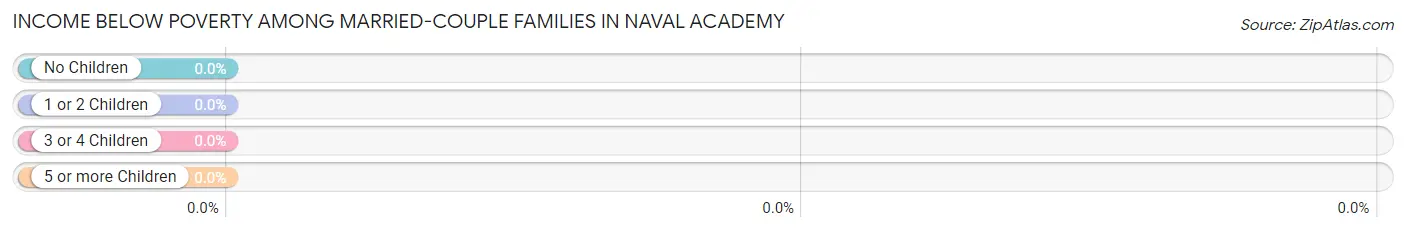
| Children | Above Poverty | Below Poverty |
| No Children | 24 (100.0%) | 0 (0.0%) |
| 1 or 2 Children | 51 (100.0%) | 0 (0.0%) |
| 3 or 4 Children | 15 (100.0%) | 0 (0.0%) |
| 5 or more Children | 0 (0.0%) | 0 (0.0%) |
| Total | 90 (100.0%) | 0 (0.0%) |
Income Below Poverty Among Single-Parent Households in Naval Academy
| Children | Single Father | Single Mother |
| No Children | 0 (0.0%) | 0 (0.0%) |
| 1 or 2 Children | 0 (0.0%) | 0 (0.0%) |
| 3 or 4 Children | 0 (0.0%) | 0 (0.0%) |
| 5 or more Children | 0 (0.0%) | 0 (0.0%) |
| Total | 0 (0.0%) | 0 (0.0%) |
Income Below Poverty Among Married-Couple vs Single-Parent Households in Naval Academy
| Children | Married-Couple Families | Single-Parent Households |
| No Children | 0 (0.0%) | 0 (0.0%) |
| 1 or 2 Children | 0 (0.0%) | 0 (0.0%) |
| 3 or 4 Children | 0 (0.0%) | 0 (0.0%) |
| 5 or more Children | 0 (0.0%) | 0 (0.0%) |
| Total | 0 (0.0%) | 0 (0.0%) |
Employment Characteristics in Naval Academy
Employment by Class of Employer in Naval Academy
Among the 1,646 employed individuals in Naval Academy, federal government employees (1,475 | 89.6%), private company employees (154 | 9.4%), and state government employees (9 | 0.5%) make up the most common classes of employment.
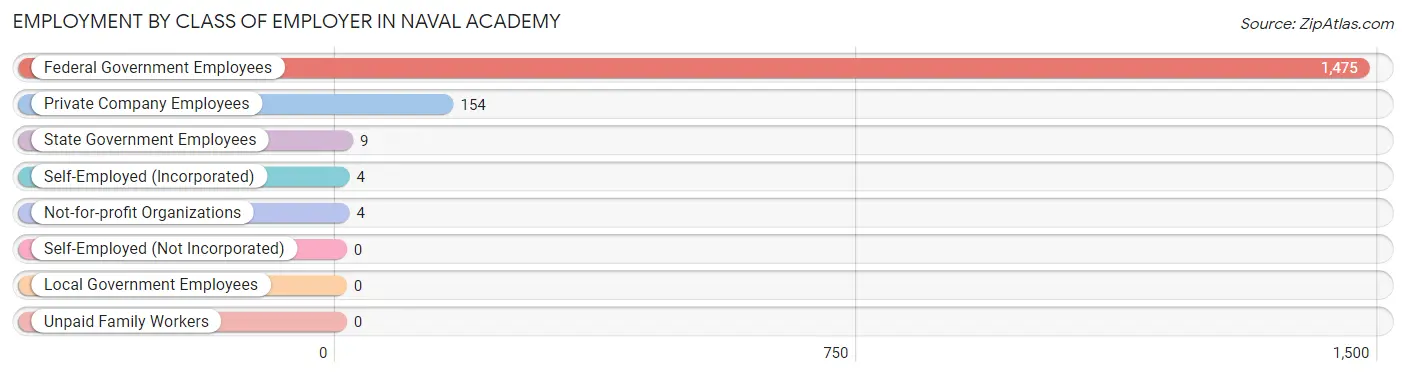
| Employer Class | # Employees | % Employees |
| Private Company Employees | 154 | 9.4% |
| Self-Employed (Incorporated) | 4 | 0.2% |
| Self-Employed (Not Incorporated) | 0 | 0.0% |
| Not-for-profit Organizations | 4 | 0.2% |
| Local Government Employees | 0 | 0.0% |
| State Government Employees | 9 | 0.5% |
| Federal Government Employees | 1,475 | 89.6% |
| Unpaid Family Workers | 0 | 0.0% |
| Total | 1,646 | 100.0% |
Employment Status by Age in Naval Academy
According to the labor force statistics for Naval Academy, out of the total population over 16 years of age (1,849), 93.8% or 1,734 individuals are in the labor force, with 2.3% or 40 of them unemployed. The age group with the highest labor force participation rate is 55 to 59 years, with 100.0% or 9 individuals in the labor force. Within the labor force, the 45 to 54 years age range has the highest percentage of unemployed individuals, with 100.0% or 10 of them being unemployed.
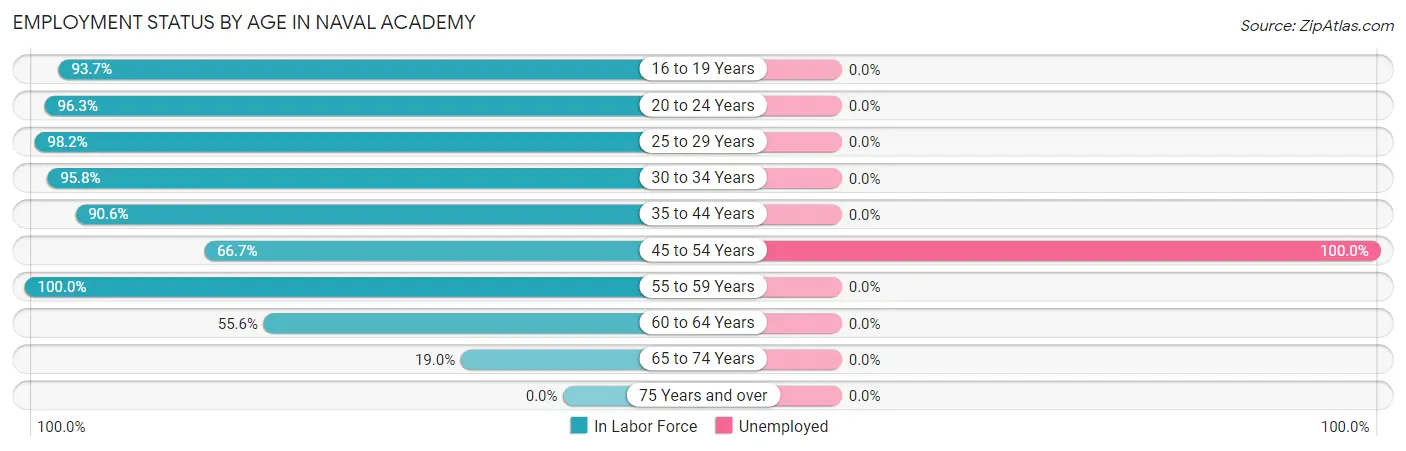
| Age Bracket | In Labor Force | Unemployed |
| 16 to 19 Years | 372 (93.7%) | 0 (0.0%) |
| 20 to 24 Years | 911 (96.3%) | 0 (0.0%) |
| 25 to 29 Years | 224 (98.2%) | 0 (0.0%) |
| 30 to 34 Years | 113 (95.8%) | 0 (0.0%) |
| 35 to 44 Years | 87 (90.6%) | 0 (0.0%) |
| 45 to 54 Years | 10 (66.7%) | 10 (100.0%) |
| 55 to 59 Years | 9 (100.0%) | 0 (0.0%) |
| 60 to 64 Years | 5 (55.6%) | 0 (0.0%) |
| 65 to 74 Years | 4 (19.0%) | 0 (0.0%) |
| 75 Years and over | 0 (0.0%) | 0 (0.0%) |
| Total | 1,734 (93.8%) | 40 (2.3%) |
Employment Status by Educational Attainment in Naval Academy
According to labor force statistics for Naval Academy, 94.3% of individuals (448) out of the total population between 25 and 64 years of age (475) are in the labor force, with 5.2% or 23 of them being unemployed. The group with the highest labor force participation rate are those with the educational attainment of less than high school, with 100.0% or 9 individuals in the labor force. Within the labor force, individuals with bachelor's degree or higher education have the highest percentage of unemployment, with 7.9% or 9 of them being unemployed.
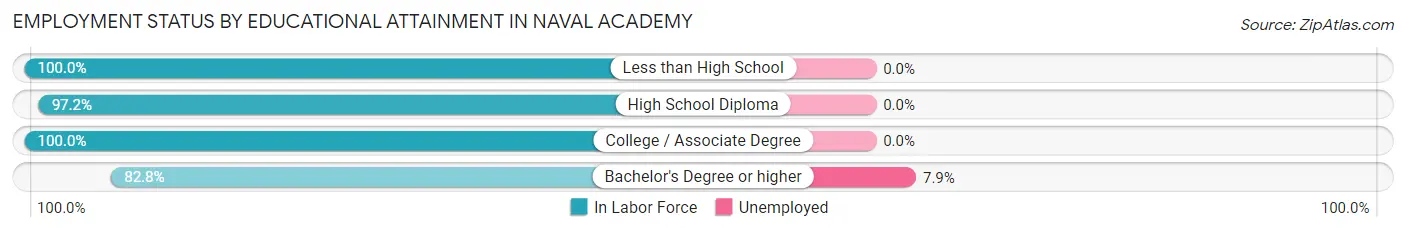
| Educational Attainment | In Labor Force | Unemployed |
| Less than High School | 9 (100.0%) | 0 (0.0%) |
| High School Diploma | 139 (97.2%) | 0 (0.0%) |
| College / Associate Degree | 189 (100.0%) | 0 (0.0%) |
| Bachelor's Degree or higher | 111 (82.8%) | 11 (7.9%) |
| Total | 448 (94.3%) | 25 (5.2%) |
Employment Occupations by Sex in Naval Academy
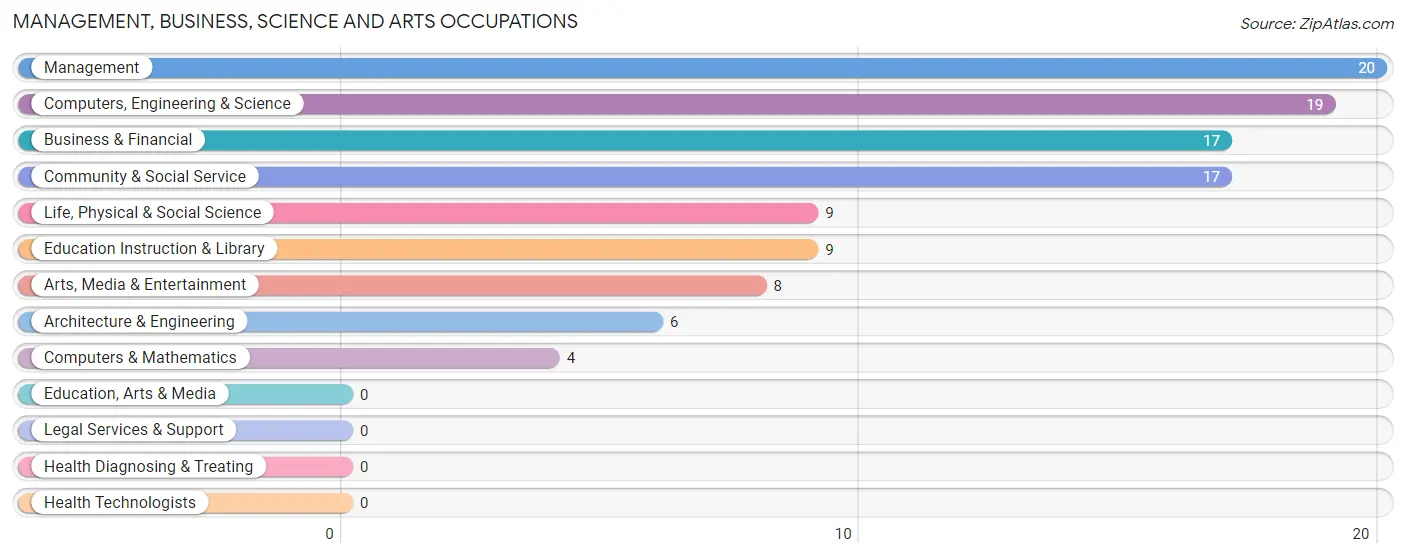
Management, Business, Science and Arts Occupations
The most common Management, Business, Science and Arts occupations in Naval Academy are Management (20 | 9.6%), Computers, Engineering & Science (19 | 9.1%), Business & Financial (17 | 8.1%), Community & Social Service (17 | 8.1%), and Life, Physical & Social Science (9 | 4.3%).
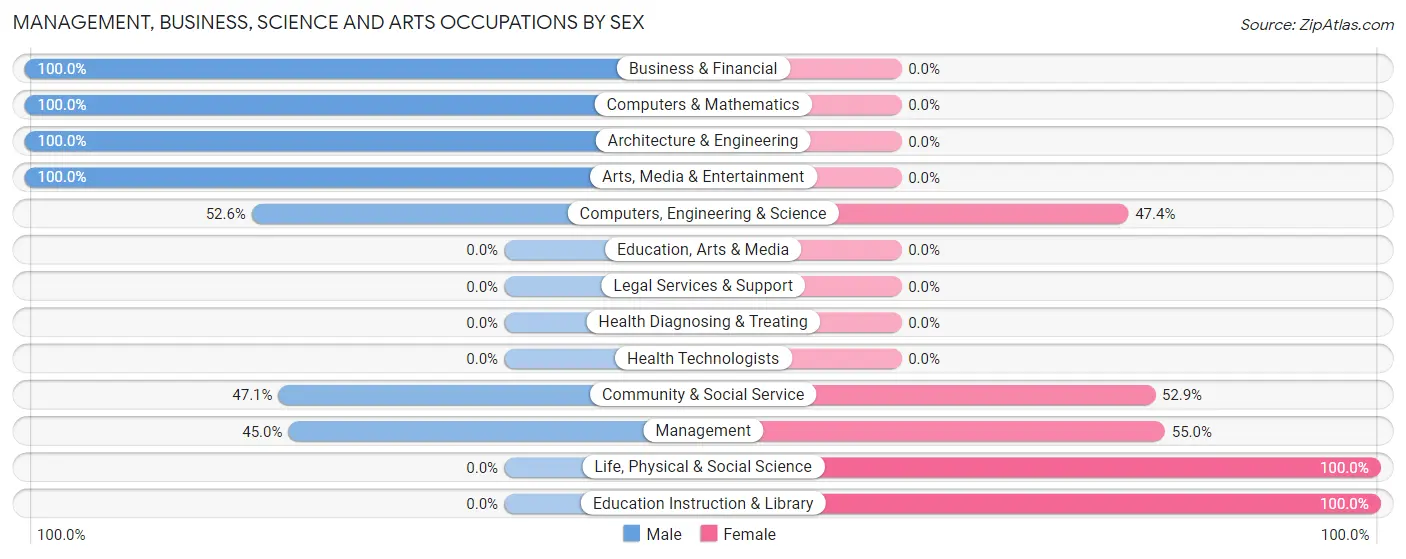
Management, Business, Science and Arts Occupations by Sex
Within the Management, Business, Science and Arts occupations in Naval Academy, the most male-oriented occupations are Business & Financial (100.0%), Computers & Mathematics (100.0%), and Architecture & Engineering (100.0%), while the most female-oriented occupations are Life, Physical & Social Science (100.0%), Education Instruction & Library (100.0%), and Management (55.0%).
| Occupation | Male | Female |
| Management | 9 (45.0%) | 11 (55.0%) |
| Business & Financial | 17 (100.0%) | 0 (0.0%) |
| Computers, Engineering & Science | 10 (52.6%) | 9 (47.4%) |
| Computers & Mathematics | 4 (100.0%) | 0 (0.0%) |
| Architecture & Engineering | 6 (100.0%) | 0 (0.0%) |
| Life, Physical & Social Science | 0 (0.0%) | 9 (100.0%) |
| Community & Social Service | 8 (47.1%) | 9 (52.9%) |
| Education, Arts & Media | 0 (0.0%) | 0 (0.0%) |
| Legal Services & Support | 0 (0.0%) | 0 (0.0%) |
| Education Instruction & Library | 0 (0.0%) | 9 (100.0%) |
| Arts, Media & Entertainment | 8 (100.0%) | 0 (0.0%) |
| Health Diagnosing & Treating | 0 (0.0%) | 0 (0.0%) |
| Health Technologists | 0 (0.0%) | 0 (0.0%) |
| Total (Category) | 44 (60.3%) | 29 (39.7%) |
| Total (Overall) | 111 (53.1%) | 98 (46.9%) |
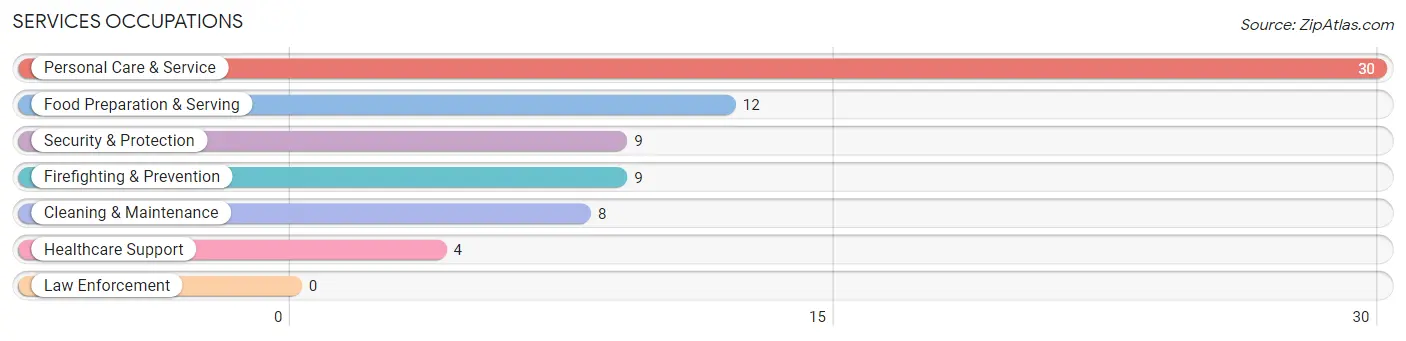
Services Occupations
The most common Services occupations in Naval Academy are Personal Care & Service (30 | 14.3%), Food Preparation & Serving (12 | 5.7%), Security & Protection (9 | 4.3%), Firefighting & Prevention (9 | 4.3%), and Cleaning & Maintenance (8 | 3.8%).
Services Occupations by Sex
Within the Services occupations in Naval Academy, the most male-oriented occupations are Security & Protection (100.0%), Firefighting & Prevention (100.0%), and Cleaning & Maintenance (100.0%), while the most female-oriented occupations are Healthcare Support (100.0%), Personal Care & Service (86.7%), and Food Preparation & Serving (33.3%).
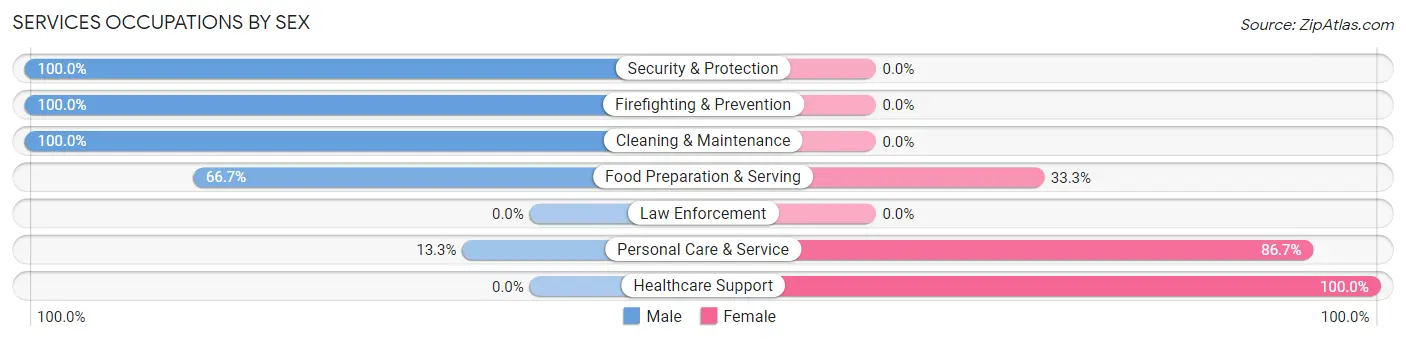
| Occupation | Male | Female |
| Healthcare Support | 0 (0.0%) | 4 (100.0%) |
| Security & Protection | 9 (100.0%) | 0 (0.0%) |
| Firefighting & Prevention | 9 (100.0%) | 0 (0.0%) |
| Law Enforcement | 0 (0.0%) | 0 (0.0%) |
| Food Preparation & Serving | 8 (66.7%) | 4 (33.3%) |
| Cleaning & Maintenance | 8 (100.0%) | 0 (0.0%) |
| Personal Care & Service | 4 (13.3%) | 26 (86.7%) |
| Total (Category) | 29 (46.0%) | 34 (54.0%) |
| Total (Overall) | 111 (53.1%) | 98 (46.9%) |
Sales and Office Occupations
The most common Sales and Office occupations in Naval Academy are Sales & Related (48 | 23.0%), and Office & Administration (4 | 1.9%).
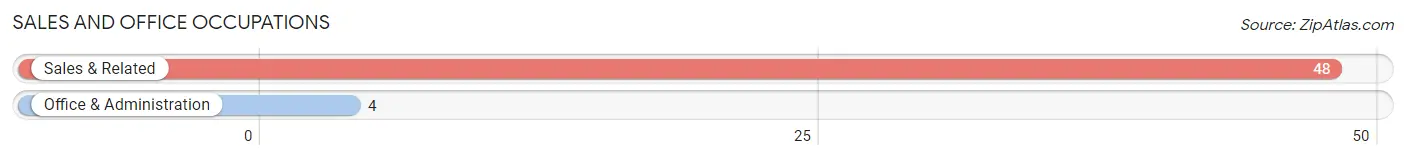
Sales and Office Occupations by Sex

| Occupation | Male | Female |
| Sales & Related | 17 (35.4%) | 31 (64.6%) |
| Office & Administration | 0 (0.0%) | 4 (100.0%) |
| Total (Category) | 17 (32.7%) | 35 (67.3%) |
| Total (Overall) | 111 (53.1%) | 98 (46.9%) |
Natural Resources, Construction and Maintenance Occupations
The most common Natural Resources, Construction and Maintenance occupations in Naval Academy are Installation, Maintenance & Repair (13 | 6.2%), and Construction & Extraction (8 | 3.8%).

Natural Resources, Construction and Maintenance Occupations by Sex

| Occupation | Male | Female |
| Farming, Fishing & Forestry | 0 (0.0%) | 0 (0.0%) |
| Construction & Extraction | 8 (100.0%) | 0 (0.0%) |
| Installation, Maintenance & Repair | 13 (100.0%) | 0 (0.0%) |
| Total (Category) | 21 (100.0%) | 0 (0.0%) |
| Total (Overall) | 111 (53.1%) | 98 (46.9%) |
Production, Transportation and Moving Occupations
Production, Transportation and Moving Occupations by Sex
| Occupation | Male | Female |
| Production | 0 (0.0%) | 0 (0.0%) |
| Transportation | 0 (0.0%) | 0 (0.0%) |
| Material Moving | 0 (0.0%) | 0 (0.0%) |
| Total (Category) | 0 (0.0%) | 0 (0.0%) |
| Total (Overall) | 111 (53.1%) | 98 (46.9%) |
Employment Industries by Sex in Naval Academy
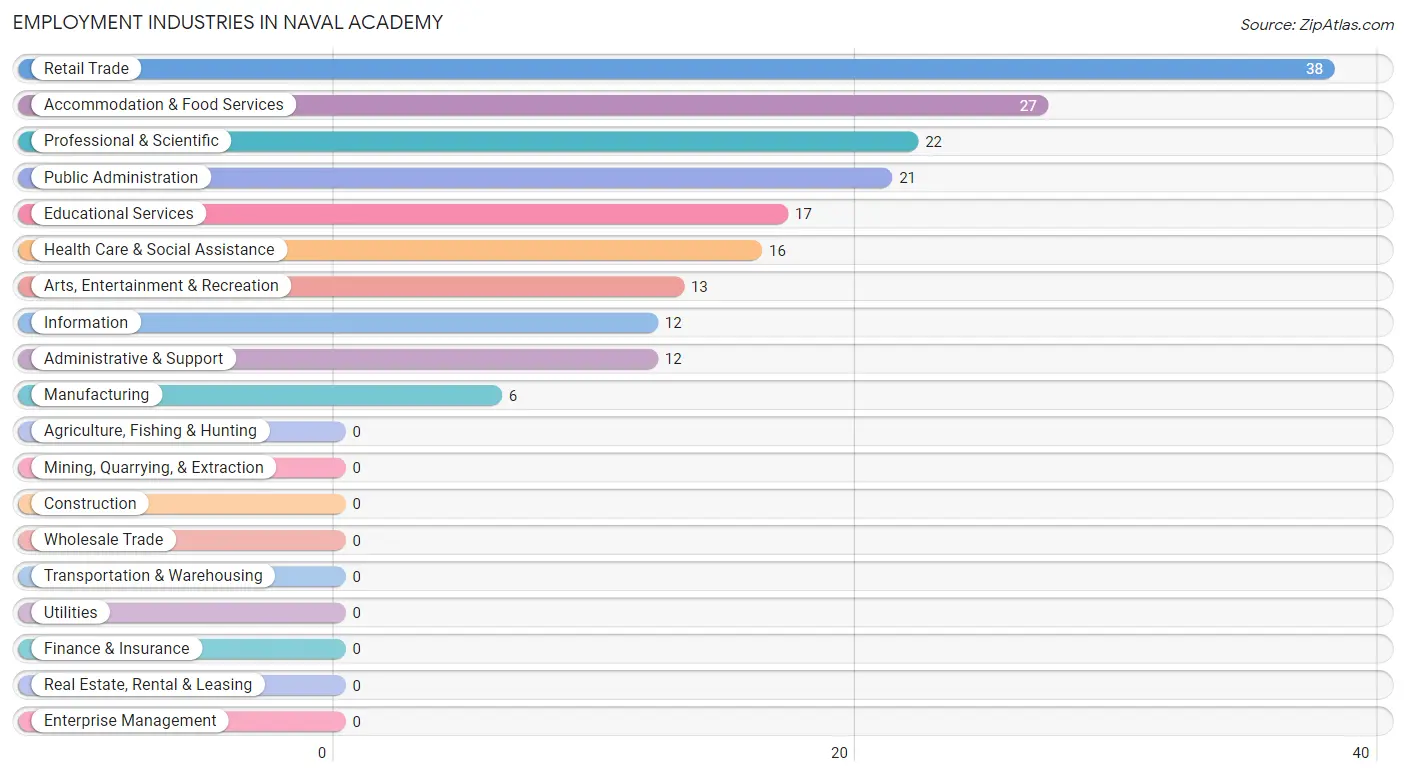
Employment Industries in Naval Academy
The major employment industries in Naval Academy include Retail Trade (38 | 18.2%), Accommodation & Food Services (27 | 12.9%), Professional & Scientific (22 | 10.5%), Public Administration (21 | 10.1%), and Educational Services (17 | 8.1%).
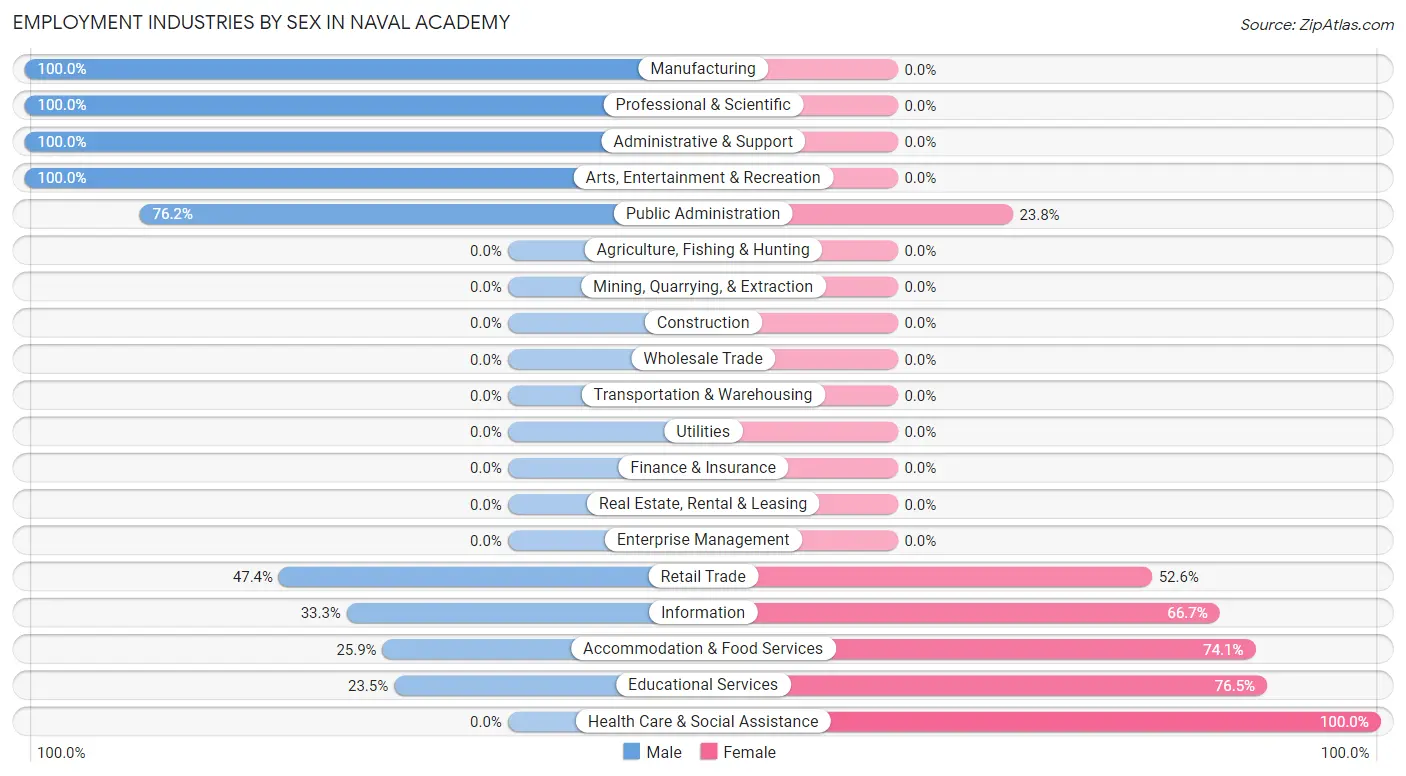
Employment Industries by Sex in Naval Academy
The Naval Academy industries that see more men than women are Manufacturing (100.0%), Professional & Scientific (100.0%), and Administrative & Support (100.0%), whereas the industries that tend to have a higher number of women are Health Care & Social Assistance (100.0%), Educational Services (76.5%), and Accommodation & Food Services (74.1%).
| Industry | Male | Female |
| Agriculture, Fishing & Hunting | 0 (0.0%) | 0 (0.0%) |
| Mining, Quarrying, & Extraction | 0 (0.0%) | 0 (0.0%) |
| Construction | 0 (0.0%) | 0 (0.0%) |
| Manufacturing | 6 (100.0%) | 0 (0.0%) |
| Wholesale Trade | 0 (0.0%) | 0 (0.0%) |
| Retail Trade | 18 (47.4%) | 20 (52.6%) |
| Transportation & Warehousing | 0 (0.0%) | 0 (0.0%) |
| Utilities | 0 (0.0%) | 0 (0.0%) |
| Information | 4 (33.3%) | 8 (66.7%) |
| Finance & Insurance | 0 (0.0%) | 0 (0.0%) |
| Real Estate, Rental & Leasing | 0 (0.0%) | 0 (0.0%) |
| Professional & Scientific | 22 (100.0%) | 0 (0.0%) |
| Enterprise Management | 0 (0.0%) | 0 (0.0%) |
| Administrative & Support | 12 (100.0%) | 0 (0.0%) |
| Educational Services | 4 (23.5%) | 13 (76.5%) |
| Health Care & Social Assistance | 0 (0.0%) | 16 (100.0%) |
| Arts, Entertainment & Recreation | 13 (100.0%) | 0 (0.0%) |
| Accommodation & Food Services | 7 (25.9%) | 20 (74.1%) |
| Public Administration | 16 (76.2%) | 5 (23.8%) |
| Total | 111 (53.1%) | 98 (46.9%) |
Education in Naval Academy
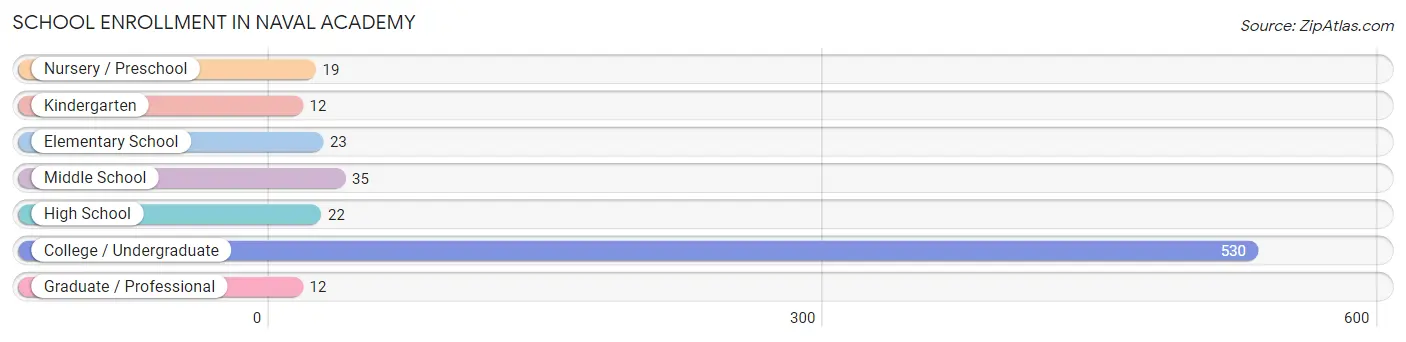
School Enrollment in Naval Academy
The most common levels of schooling among the 653 students in Naval Academy are college / undergraduate (530 | 81.2%), middle school (35 | 5.4%), and elementary school (23 | 3.5%).
| School Level | # Students | % Students |
| Nursery / Preschool | 19 | 2.9% |
| Kindergarten | 12 | 1.8% |
| Elementary School | 23 | 3.5% |
| Middle School | 35 | 5.4% |
| High School | 22 | 3.4% |
| College / Undergraduate | 530 | 81.2% |
| Graduate / Professional | 12 | 1.8% |
| Total | 653 | 100.0% |
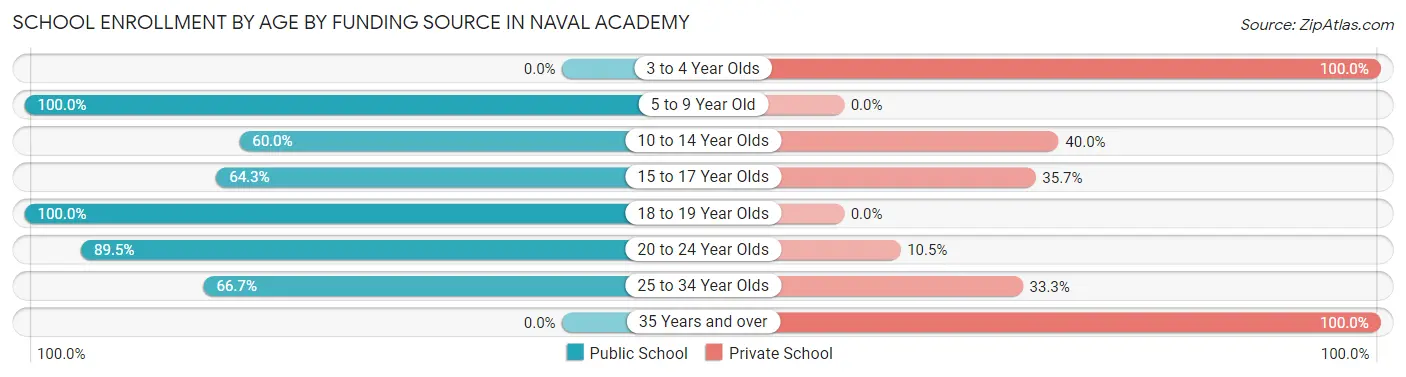
School Enrollment by Age by Funding Source in Naval Academy
Out of a total of 653 students who are enrolled in schools in Naval Academy, 92 (14.1%) attend a private institution, while the remaining 561 (85.9%) are enrolled in public schools. The age group of 3 to 4 year olds has the highest likelihood of being enrolled in private schools, with 5 (100.0% in the age bracket) enrolled. Conversely, the age group of 5 to 9 year old has the lowest likelihood of being enrolled in a private school, with 44 (100.0% in the age bracket) attending a public institution.
| Age Bracket | Public School | Private School |
| 3 to 4 Year Olds | 0 (0.0%) | 5 (100.0%) |
| 5 to 9 Year Old | 44 (100.0%) | 0 (0.0%) |
| 10 to 14 Year Olds | 24 (60.0%) | 16 (40.0%) |
| 15 to 17 Year Olds | 9 (64.3%) | 5 (35.7%) |
| 18 to 19 Year Olds | 119 (100.0%) | 0 (0.0%) |
| 20 to 24 Year Olds | 357 (89.5%) | 42 (10.5%) |
| 25 to 34 Year Olds | 8 (66.7%) | 4 (33.3%) |
| 35 Years and over | 0 (0.0%) | 20 (100.0%) |
| Total | 561 (85.9%) | 92 (14.1%) |
Educational Attainment by Field of Study in Naval Academy
Business (34 | 18.7%), bio, nature & agricultural (28 | 15.4%), arts & humanities (27 | 14.8%), engineering (17 | 9.3%), and physical & health sciences (15 | 8.2%) are the most common fields of study among 182 individuals in Naval Academy who have obtained a bachelor's degree or higher.
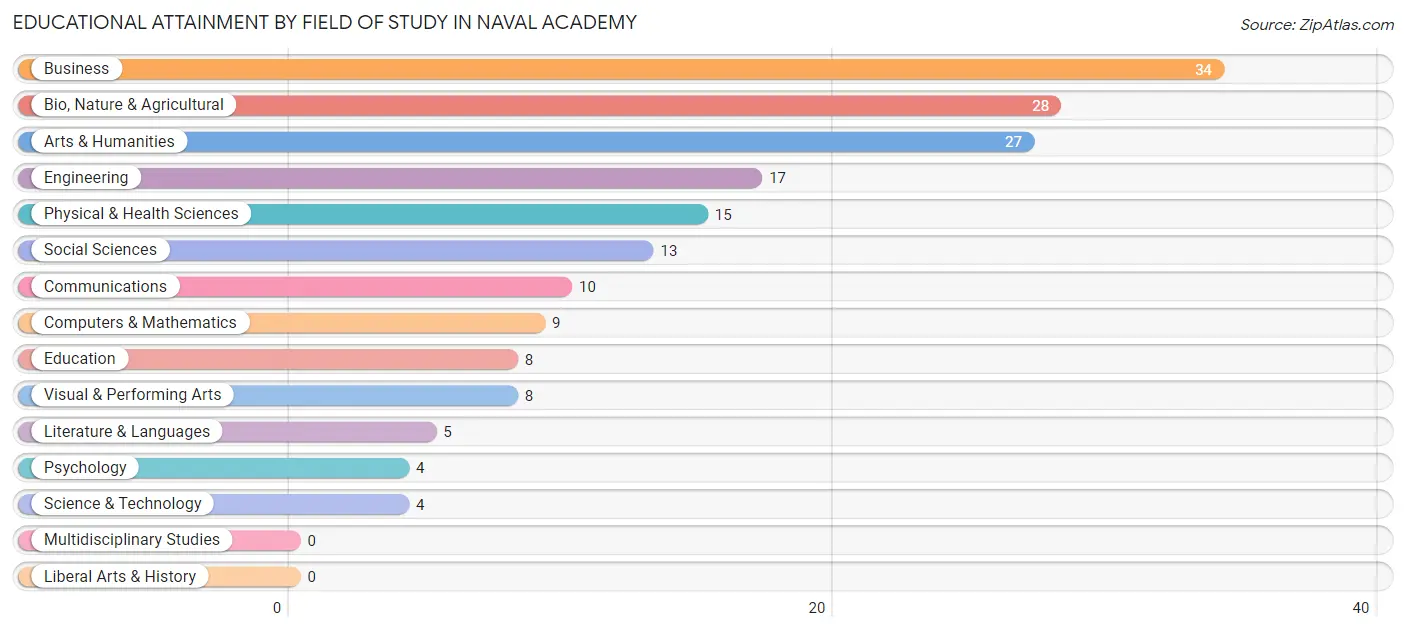
| Field of Study | # Graduates | % Graduates |
| Computers & Mathematics | 9 | 5.0% |
| Bio, Nature & Agricultural | 28 | 15.4% |
| Physical & Health Sciences | 15 | 8.2% |
| Psychology | 4 | 2.2% |
| Social Sciences | 13 | 7.1% |
| Engineering | 17 | 9.3% |
| Multidisciplinary Studies | 0 | 0.0% |
| Science & Technology | 4 | 2.2% |
| Business | 34 | 18.7% |
| Education | 8 | 4.4% |
| Literature & Languages | 5 | 2.8% |
| Liberal Arts & History | 0 | 0.0% |
| Visual & Performing Arts | 8 | 4.4% |
| Communications | 10 | 5.5% |
| Arts & Humanities | 27 | 14.8% |
| Total | 182 | 100.0% |
Transportation & Commute in Naval Academy
Vehicle Availability by Sex in Naval Academy
The most prevalent vehicle ownership categories in Naval Academy are males with 2 vehicles (65, accounting for 49.2%) and females with 2 vehicles (28, making up 120.4%).
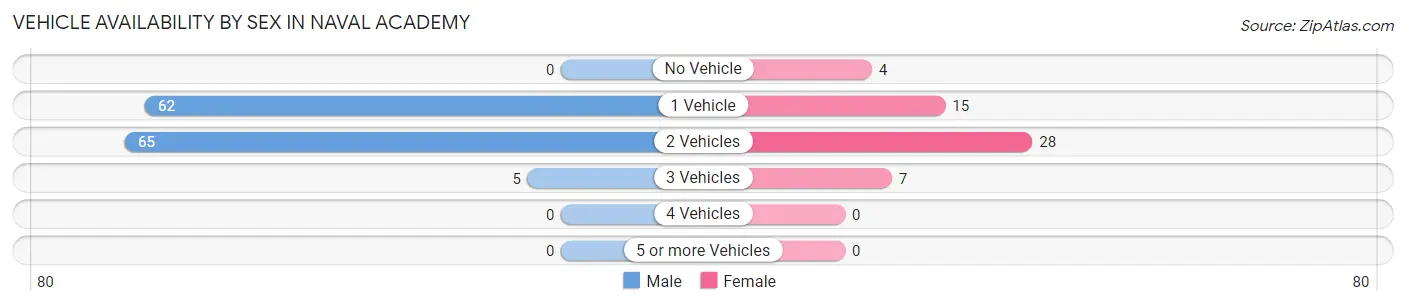
| Vehicles Available | Male | Female |
| No Vehicle | 0 (0.0%) | 4 (7.4%) |
| 1 Vehicle | 62 (47.0%) | 15 (27.8%) |
| 2 Vehicles | 65 (49.2%) | 28 (51.8%) |
| 3 Vehicles | 5 (3.8%) | 7 (13.0%) |
| 4 Vehicles | 0 (0.0%) | 0 (0.0%) |
| 5 or more Vehicles | 0 (0.0%) | 0 (0.0%) |
| Total | 132 (100.0%) | 54 (100.0%) |
Commute Time in Naval Academy
The most frequently occuring commute durations in Naval Academy are 5 to 9 minutes (483 commuters, 36.3%), less than 5 minutes (393 commuters, 29.5%), and 10 to 14 minutes (214 commuters, 16.1%).
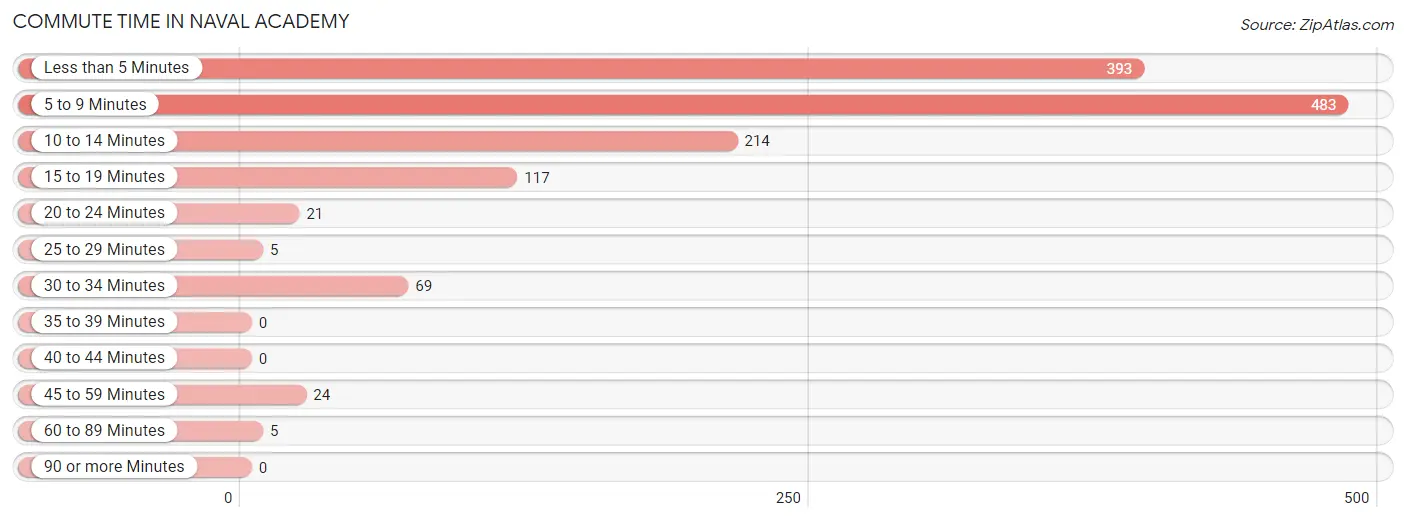
| Commute Time | # Commuters | % Commuters |
| Less than 5 Minutes | 393 | 29.5% |
| 5 to 9 Minutes | 483 | 36.3% |
| 10 to 14 Minutes | 214 | 16.1% |
| 15 to 19 Minutes | 117 | 8.8% |
| 20 to 24 Minutes | 21 | 1.6% |
| 25 to 29 Minutes | 5 | 0.4% |
| 30 to 34 Minutes | 69 | 5.2% |
| 35 to 39 Minutes | 0 | 0.0% |
| 40 to 44 Minutes | 0 | 0.0% |
| 45 to 59 Minutes | 24 | 1.8% |
| 60 to 89 Minutes | 5 | 0.4% |
| 90 or more Minutes | 0 | 0.0% |
Commute Time by Sex in Naval Academy
The most common commute times in Naval Academy are 5 to 9 minutes (437 commuters, 41.7%) for males and less than 5 minutes (102 commuters, 36.0%) for females.
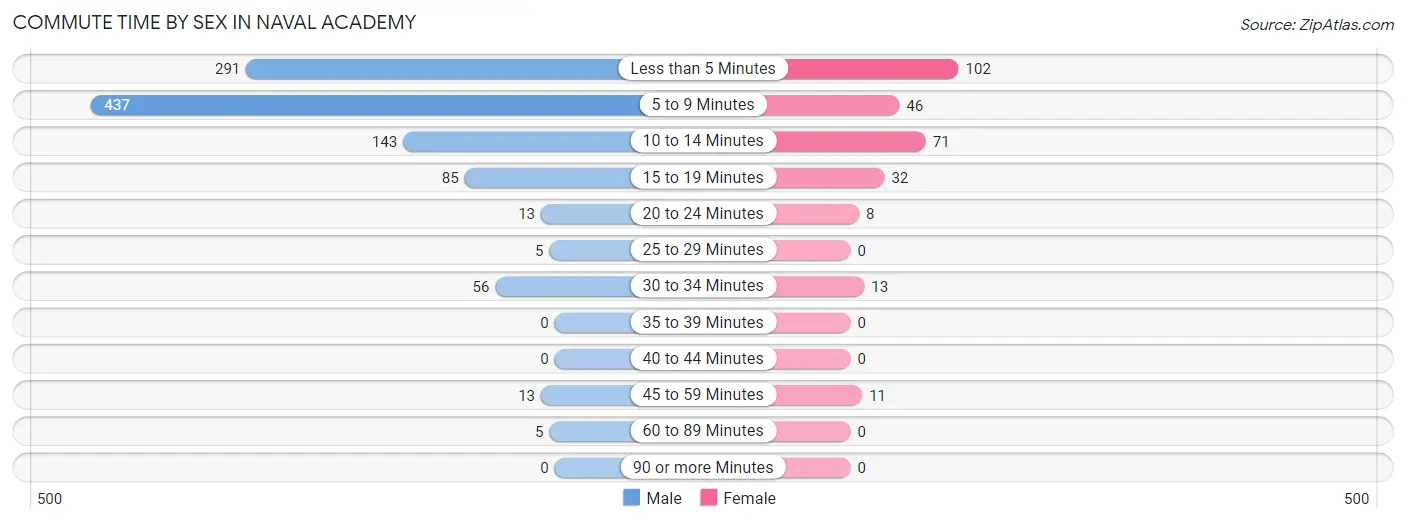
| Commute Time | Male | Female |
| Less than 5 Minutes | 291 (27.8%) | 102 (36.0%) |
| 5 to 9 Minutes | 437 (41.7%) | 46 (16.3%) |
| 10 to 14 Minutes | 143 (13.7%) | 71 (25.1%) |
| 15 to 19 Minutes | 85 (8.1%) | 32 (11.3%) |
| 20 to 24 Minutes | 13 (1.2%) | 8 (2.8%) |
| 25 to 29 Minutes | 5 (0.5%) | 0 (0.0%) |
| 30 to 34 Minutes | 56 (5.3%) | 13 (4.6%) |
| 35 to 39 Minutes | 0 (0.0%) | 0 (0.0%) |
| 40 to 44 Minutes | 0 (0.0%) | 0 (0.0%) |
| 45 to 59 Minutes | 13 (1.2%) | 11 (3.9%) |
| 60 to 89 Minutes | 5 (0.5%) | 0 (0.0%) |
| 90 or more Minutes | 0 (0.0%) | 0 (0.0%) |
Time of Departure to Work by Sex in Naval Academy
The most frequent times of departure to work in Naval Academy are 7:00 AM to 7:29 AM (189, 18.0%) for males and 5:00 AM to 5:29 AM (66, 23.3%) for females.
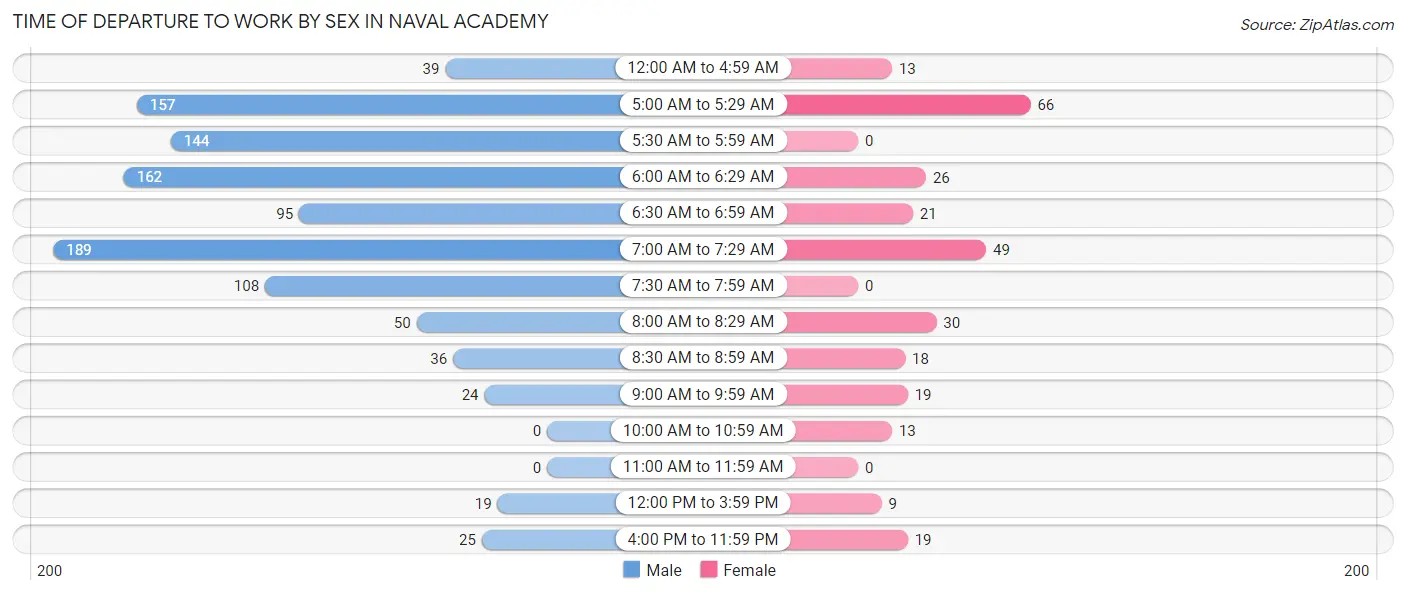
| Time of Departure | Male | Female |
| 12:00 AM to 4:59 AM | 39 (3.7%) | 13 (4.6%) |
| 5:00 AM to 5:29 AM | 157 (15.0%) | 66 (23.3%) |
| 5:30 AM to 5:59 AM | 144 (13.7%) | 0 (0.0%) |
| 6:00 AM to 6:29 AM | 162 (15.5%) | 26 (9.2%) |
| 6:30 AM to 6:59 AM | 95 (9.1%) | 21 (7.4%) |
| 7:00 AM to 7:29 AM | 189 (18.0%) | 49 (17.3%) |
| 7:30 AM to 7:59 AM | 108 (10.3%) | 0 (0.0%) |
| 8:00 AM to 8:29 AM | 50 (4.8%) | 30 (10.6%) |
| 8:30 AM to 8:59 AM | 36 (3.4%) | 18 (6.4%) |
| 9:00 AM to 9:59 AM | 24 (2.3%) | 19 (6.7%) |
| 10:00 AM to 10:59 AM | 0 (0.0%) | 13 (4.6%) |
| 11:00 AM to 11:59 AM | 0 (0.0%) | 0 (0.0%) |
| 12:00 PM to 3:59 PM | 19 (1.8%) | 9 (3.2%) |
| 4:00 PM to 11:59 PM | 25 (2.4%) | 19 (6.7%) |
| Total | 1,048 (100.0%) | 283 (100.0%) |
Housing Occupancy in Naval Academy
Occupancy by Ownership in Naval Academy
Of the total 148 dwellings in Naval Academy, owner-occupied units account for 0 (0.0%), while renter-occupied units make up 148 (100.0%).
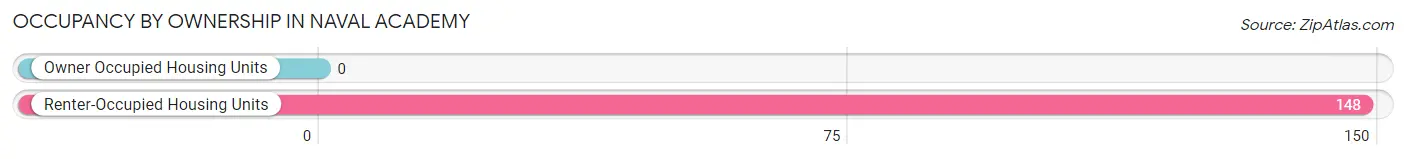
| Occupancy | # Housing Units | % Housing Units |
| Owner Occupied Housing Units | 0 | 0.0% |
| Renter-Occupied Housing Units | 148 | 100.0% |
| Total Occupied Housing Units | 148 | 100.0% |
Occupancy by Household Size in Naval Academy
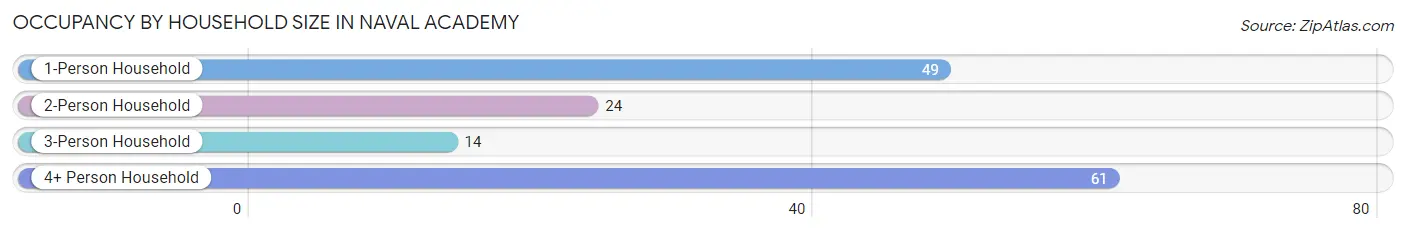
| Household Size | # Housing Units | % Housing Units |
| 1-Person Household | 49 | 33.1% |
| 2-Person Household | 24 | 16.2% |
| 3-Person Household | 14 | 9.5% |
| 4+ Person Household | 61 | 41.2% |
| Total Housing Units | 148 | 100.0% |
Occupancy by Ownership by Household Size in Naval Academy

| Household Size | Owner-occupied | Renter-occupied |
| 1-Person Household | 0 (0.0%) | 49 (100.0%) |
| 2-Person Household | 0 (0.0%) | 24 (100.0%) |
| 3-Person Household | 0 (0.0%) | 14 (100.0%) |
| 4+ Person Household | 0 (0.0%) | 61 (100.0%) |
| Total Housing Units | 0 (0.0%) | 148 (100.0%) |
Occupancy by Educational Attainment in Naval Academy
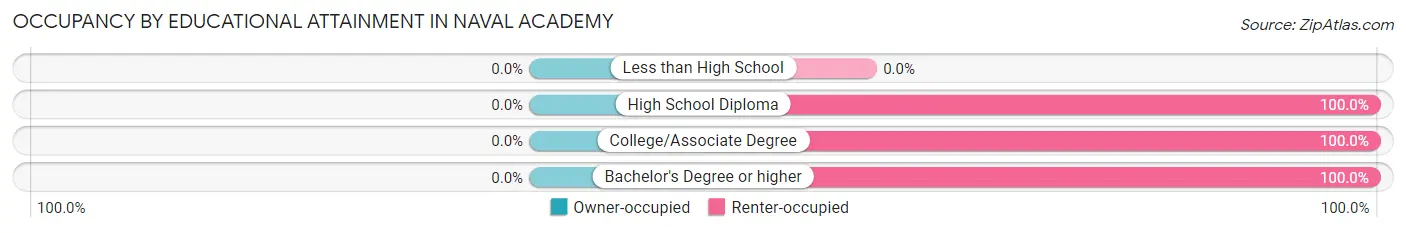
| Household Size | Owner-occupied | Renter-occupied |
| Less than High School | 0 (0.0%) | 0 (0.0%) |
| High School Diploma | 0 (0.0%) | 5 (100.0%) |
| College/Associate Degree | 0 (0.0%) | 79 (100.0%) |
| Bachelor's Degree or higher | 0 (0.0%) | 64 (100.0%) |
Occupancy by Age of Householder in Naval Academy
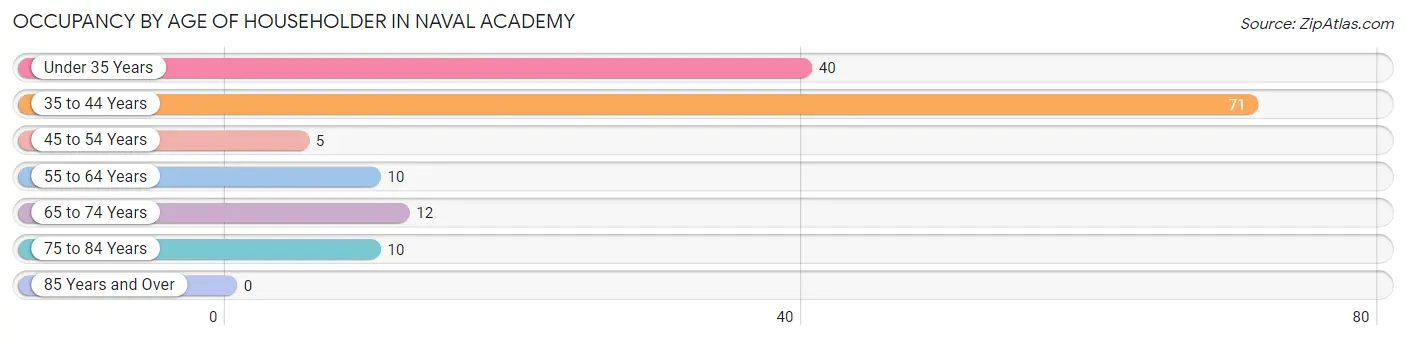
| Age Bracket | # Households | % Households |
| Under 35 Years | 40 | 27.0% |
| 35 to 44 Years | 71 | 48.0% |
| 45 to 54 Years | 5 | 3.4% |
| 55 to 64 Years | 10 | 6.8% |
| 65 to 74 Years | 12 | 8.1% |
| 75 to 84 Years | 10 | 6.8% |
| 85 Years and Over | 0 | 0.0% |
| Total | 148 | 100.0% |
Housing Finances in Naval Academy
Median Income by Occupancy in Naval Academy
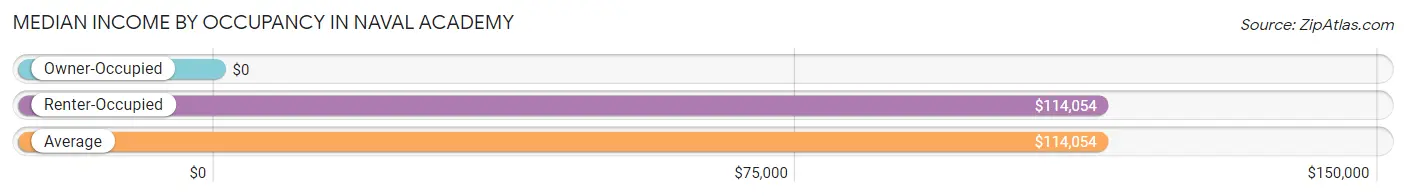
| Occupancy Type | # Households | Median Income |
| Owner-Occupied | 0 (0.0%) | $0 |
| Renter-Occupied | 148 (100.0%) | $114,054 |
| Average | 148 (100.0%) | $114,054 |
Occupancy by Householder Income Bracket in Naval Academy
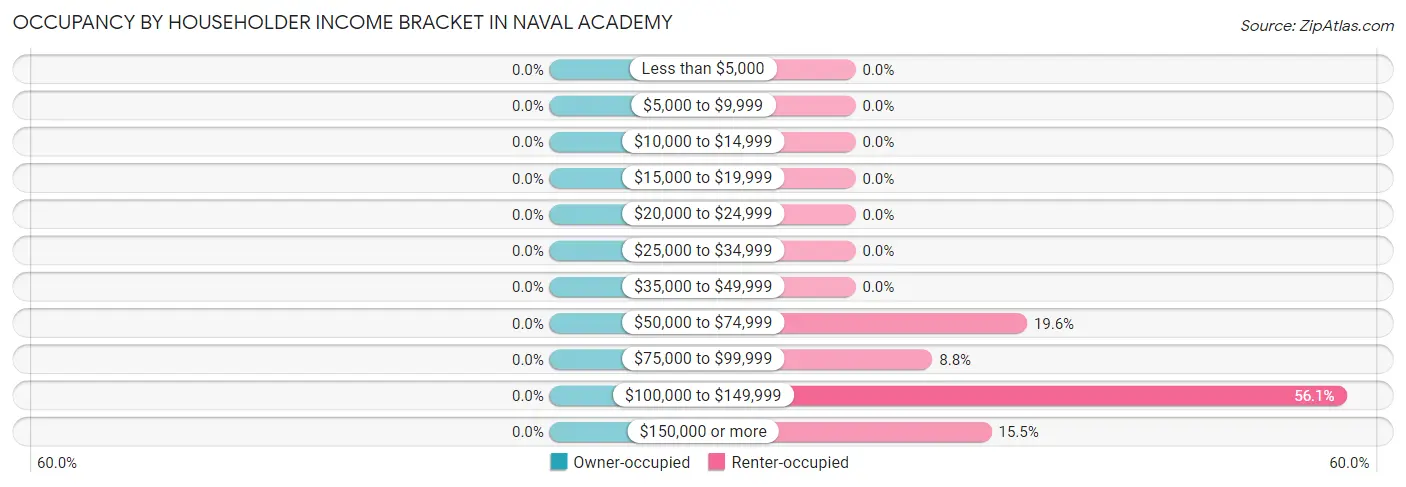
| Income Bracket | Owner-occupied | Renter-occupied |
| Less than $5,000 | 0 (0.0%) | 0 (0.0%) |
| $5,000 to $9,999 | 0 (0.0%) | 0 (0.0%) |
| $10,000 to $14,999 | 0 (0.0%) | 0 (0.0%) |
| $15,000 to $19,999 | 0 (0.0%) | 0 (0.0%) |
| $20,000 to $24,999 | 0 (0.0%) | 0 (0.0%) |
| $25,000 to $34,999 | 0 (0.0%) | 0 (0.0%) |
| $35,000 to $49,999 | 0 (0.0%) | 0 (0.0%) |
| $50,000 to $74,999 | 0 (0.0%) | 29 (19.6%) |
| $75,000 to $99,999 | 0 (0.0%) | 13 (8.8%) |
| $100,000 to $149,999 | 0 (0.0%) | 83 (56.1%) |
| $150,000 or more | 0 (0.0%) | 23 (15.5%) |
| Total | 0 (0.0%) | 148 (100.0%) |
Monthly Housing Cost Tiers in Naval Academy
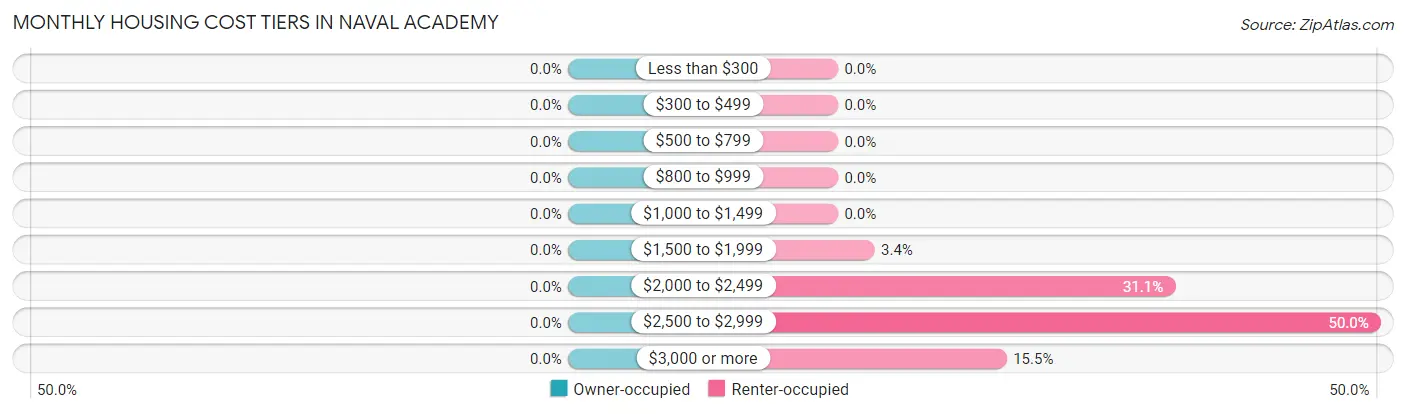
| Monthly Cost | Owner-occupied | Renter-occupied |
| Less than $300 | 0 (0.0%) | 0 (0.0%) |
| $300 to $499 | 0 (0.0%) | 0 (0.0%) |
| $500 to $799 | 0 (0.0%) | 0 (0.0%) |
| $800 to $999 | 0 (0.0%) | 0 (0.0%) |
| $1,000 to $1,499 | 0 (0.0%) | 0 (0.0%) |
| $1,500 to $1,999 | 0 (0.0%) | 5 (3.4%) |
| $2,000 to $2,499 | 0 (0.0%) | 46 (31.1%) |
| $2,500 to $2,999 | 0 (0.0%) | 74 (50.0%) |
| $3,000 or more | 0 (0.0%) | 23 (15.5%) |
| Total | 0 (0.0%) | 148 (100.0%) |
Physical Housing Characteristics in Naval Academy
Housing Structures in Naval Academy
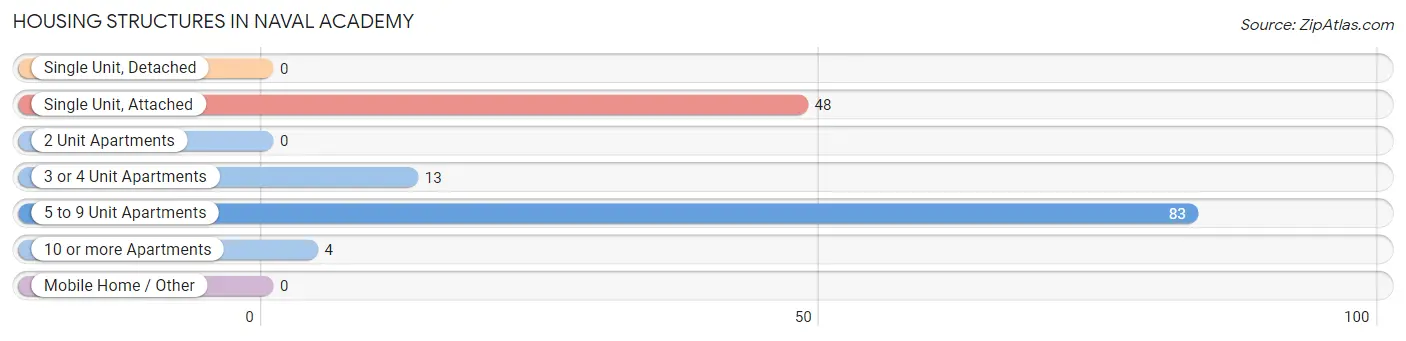
| Structure Type | # Housing Units | % Housing Units |
| Single Unit, Detached | 0 | 0.0% |
| Single Unit, Attached | 48 | 32.4% |
| 2 Unit Apartments | 0 | 0.0% |
| 3 or 4 Unit Apartments | 13 | 8.8% |
| 5 to 9 Unit Apartments | 83 | 56.1% |
| 10 or more Apartments | 4 | 2.7% |
| Mobile Home / Other | 0 | 0.0% |
| Total | 148 | 100.0% |
Housing Structures by Occupancy in Naval Academy
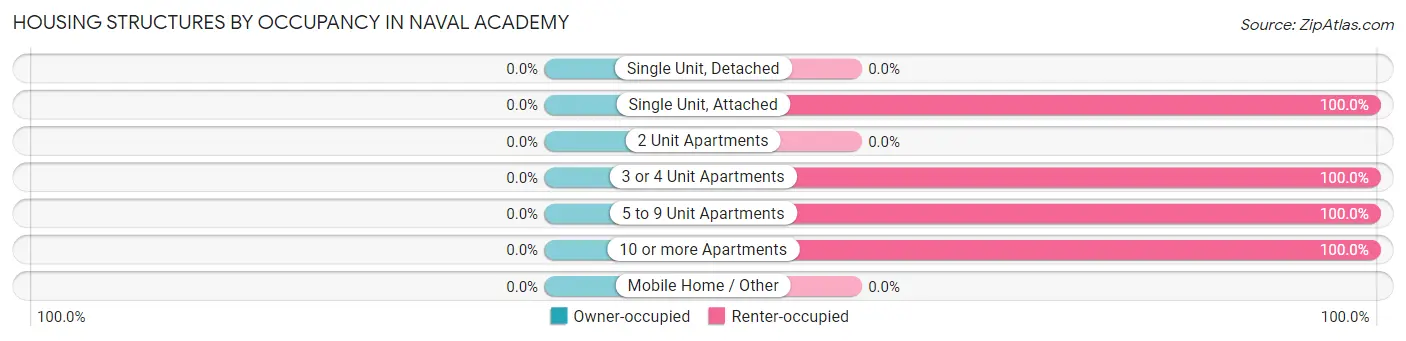
| Structure Type | Owner-occupied | Renter-occupied |
| Single Unit, Detached | 0 (0.0%) | 0 (0.0%) |
| Single Unit, Attached | 0 (0.0%) | 48 (100.0%) |
| 2 Unit Apartments | 0 (0.0%) | 0 (0.0%) |
| 3 or 4 Unit Apartments | 0 (0.0%) | 13 (100.0%) |
| 5 to 9 Unit Apartments | 0 (0.0%) | 83 (100.0%) |
| 10 or more Apartments | 0 (0.0%) | 4 (100.0%) |
| Mobile Home / Other | 0 (0.0%) | 0 (0.0%) |
| Total | 0 (0.0%) | 148 (100.0%) |
Housing Structures by Number of Rooms in Naval Academy
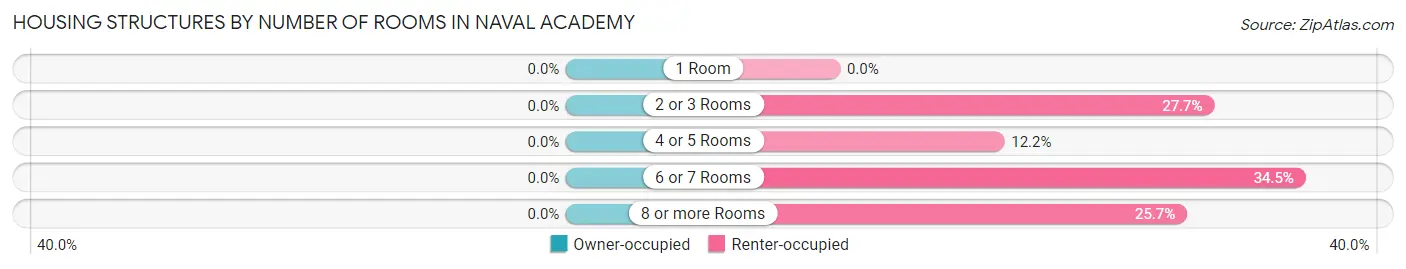
| Number of Rooms | Owner-occupied | Renter-occupied |
| 1 Room | 0 (0.0%) | 0 (0.0%) |
| 2 or 3 Rooms | 0 (0.0%) | 41 (27.7%) |
| 4 or 5 Rooms | 0 (0.0%) | 18 (12.2%) |
| 6 or 7 Rooms | 0 (0.0%) | 51 (34.5%) |
| 8 or more Rooms | 0 (0.0%) | 38 (25.7%) |
| Total | 0 (0.0%) | 148 (100.0%) |
Housing Structure by Heating Type in Naval Academy
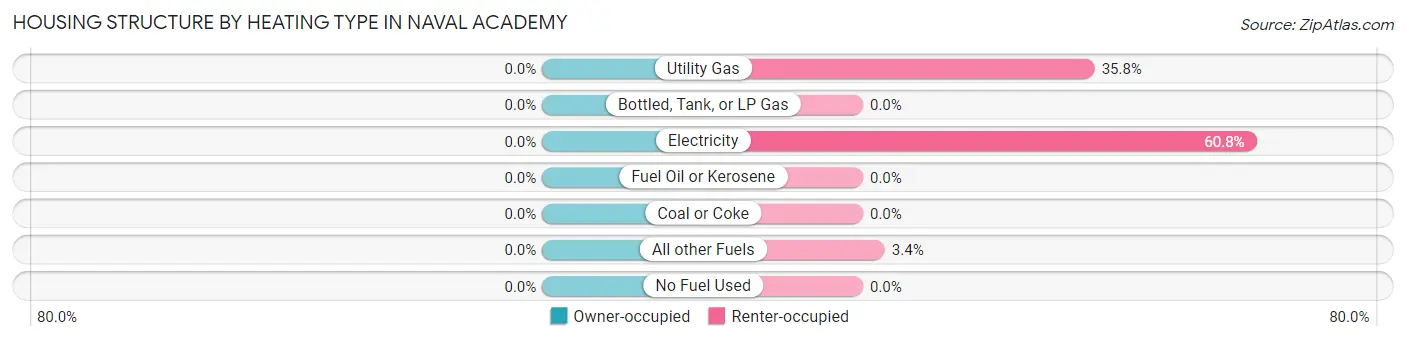
| Heating Type | Owner-occupied | Renter-occupied |
| Utility Gas | 0 (0.0%) | 53 (35.8%) |
| Bottled, Tank, or LP Gas | 0 (0.0%) | 0 (0.0%) |
| Electricity | 0 (0.0%) | 90 (60.8%) |
| Fuel Oil or Kerosene | 0 (0.0%) | 0 (0.0%) |
| Coal or Coke | 0 (0.0%) | 0 (0.0%) |
| All other Fuels | 0 (0.0%) | 5 (3.4%) |
| No Fuel Used | 0 (0.0%) | 0 (0.0%) |
| Total | 0 (0.0%) | 148 (100.0%) |
Household Vehicle Usage in Naval Academy
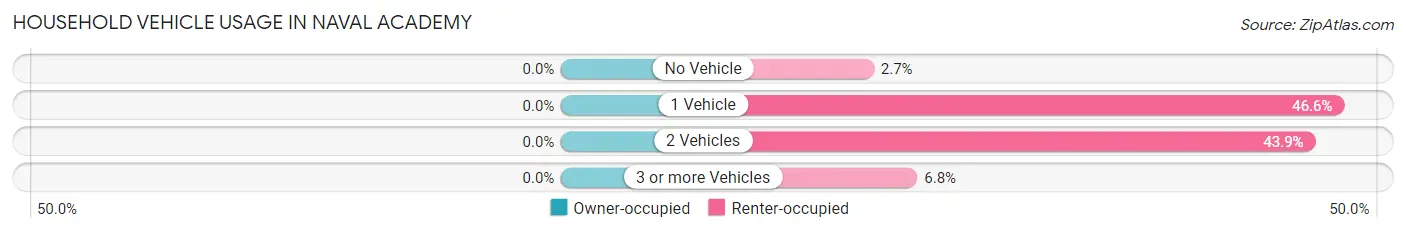
| Vehicles per Household | Owner-occupied | Renter-occupied |
| No Vehicle | 0 (0.0%) | 4 (2.7%) |
| 1 Vehicle | 0 (0.0%) | 69 (46.6%) |
| 2 Vehicles | 0 (0.0%) | 65 (43.9%) |
| 3 or more Vehicles | 0 (0.0%) | 10 (6.8%) |
| Total | 0 (0.0%) | 148 (100.0%) |
Real Estate & Mortgages in Naval Academy
Real Estate and Mortgage Overview in Naval Academy
| Characteristic | Without Mortgage | With Mortgage |
| Housing Units | 0 | 0 |
| Median Property Value | - | - |
| Median Household Income | - | - |
| Monthly Housing Costs | - | - |
| Real Estate Taxes | - | - |
Property Value by Mortgage Status in Naval Academy

| Property Value | Without Mortgage | With Mortgage |
| Less than $50,000 | 0 (0.0%) | 0 (0.0%) |
| $50,000 to $99,999 | 0 (0.0%) | 0 (0.0%) |
| $100,000 to $299,999 | 0 (0.0%) | 0 (0.0%) |
| $300,000 to $499,999 | 0 (0.0%) | 0 (0.0%) |
| $500,000 to $749,999 | 0 (0.0%) | 0 (0.0%) |
| $750,000 to $999,999 | 0 (0.0%) | 0 (0.0%) |
| $1,000,000 or more | 0 (0.0%) | 0 (0.0%) |
| Total | 0 (0.0%) | 0 (0.0%) |
Household Income by Mortgage Status in Naval Academy
| Household Income | Without Mortgage | With Mortgage |
| Less than $10,000 | 0 (0.0%) | 0 (0.0%) |
| $10,000 to $24,999 | 0 (0.0%) | 0 (0.0%) |
| $25,000 to $34,999 | 0 (0.0%) | 0 (0.0%) |
| $35,000 to $49,999 | 0 (0.0%) | 0 (0.0%) |
| $50,000 to $74,999 | 0 (0.0%) | 0 (0.0%) |
| $75,000 to $99,999 | 0 (0.0%) | 0 (0.0%) |
| $100,000 to $149,999 | 0 (0.0%) | 0 (0.0%) |
| $150,000 or more | 0 (0.0%) | 0 (0.0%) |
| Total | 0 (0.0%) | 0 (0.0%) |
Property Value to Household Income Ratio in Naval Academy
| Value-to-Income Ratio | Without Mortgage | With Mortgage |
| Less than 2.0x | 0 (0.0%) | 0 (0.0%) |
| 2.0x to 2.9x | 0 (0.0%) | 0 (0.0%) |
| 3.0x to 3.9x | 0 (0.0%) | 0 (0.0%) |
| 4.0x or more | 0 (0.0%) | 0 (0.0%) |
| Total | 0 (0.0%) | 0 (0.0%) |
Real Estate Taxes by Mortgage Status in Naval Academy
| Property Taxes | Without Mortgage | With Mortgage |
| Less than $800 | 0 (0.0%) | 0 (0.0%) |
| $800 to $1,499 | 0 (0.0%) | 0 (0.0%) |
| $800 to $1,499 | 0 (0.0%) | 0 (0.0%) |
| Total | 0 (0.0%) | 0 (0.0%) |
Health & Disability in Naval Academy
Health Insurance Coverage by Age in Naval Academy
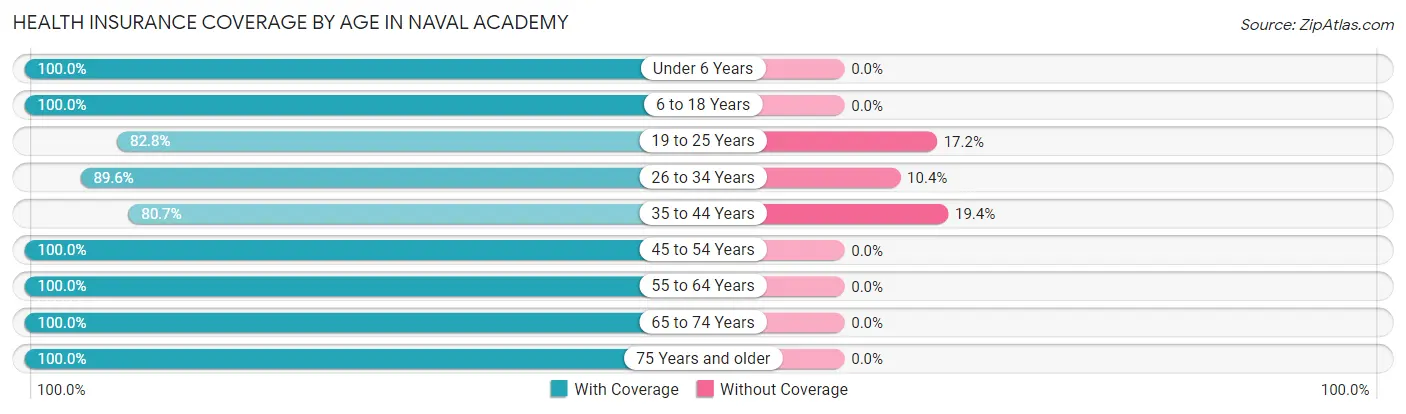
| Age Bracket | With Coverage | Without Coverage |
| Under 6 Years | 92 (100.0%) | 0 (0.0%) |
| 6 to 18 Years | 75 (100.0%) | 0 (0.0%) |
| 19 to 25 Years | 24 (82.8%) | 5 (17.2%) |
| 26 to 34 Years | 43 (89.6%) | 5 (10.4%) |
| 35 to 44 Years | 25 (80.6%) | 6 (19.4%) |
| 45 to 54 Years | 10 (100.0%) | 0 (0.0%) |
| 55 to 64 Years | 18 (100.0%) | 0 (0.0%) |
| 65 to 74 Years | 21 (100.0%) | 0 (0.0%) |
| 75 Years and older | 10 (100.0%) | 0 (0.0%) |
| Total | 318 (95.2%) | 16 (4.8%) |
Health Insurance Coverage by Citizenship Status in Naval Academy

| Citizenship Status | With Coverage | Without Coverage |
| Native Born | 92 (100.0%) | 0 (0.0%) |
| Foreign Born, Citizen | 75 (100.0%) | 0 (0.0%) |
| Foreign Born, not a Citizen | 24 (82.8%) | 5 (17.2%) |
Health Insurance Coverage by Household Income in Naval Academy
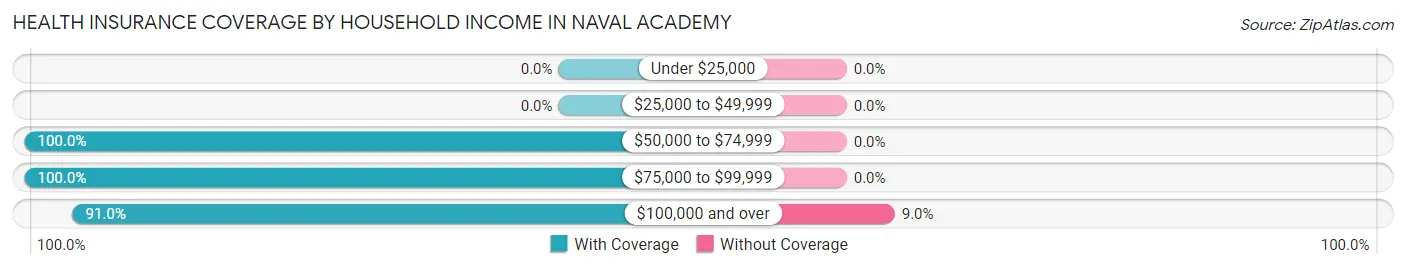
| Household Income | With Coverage | Without Coverage |
| Under $25,000 | 0 (0.0%) | 0 (0.0%) |
| $25,000 to $49,999 | 0 (0.0%) | 0 (0.0%) |
| $50,000 to $74,999 | 116 (100.0%) | 0 (0.0%) |
| $75,000 to $99,999 | 40 (100.0%) | 0 (0.0%) |
| $100,000 and over | 162 (91.0%) | 16 (9.0%) |
Public vs Private Health Insurance Coverage by Age in Naval Academy
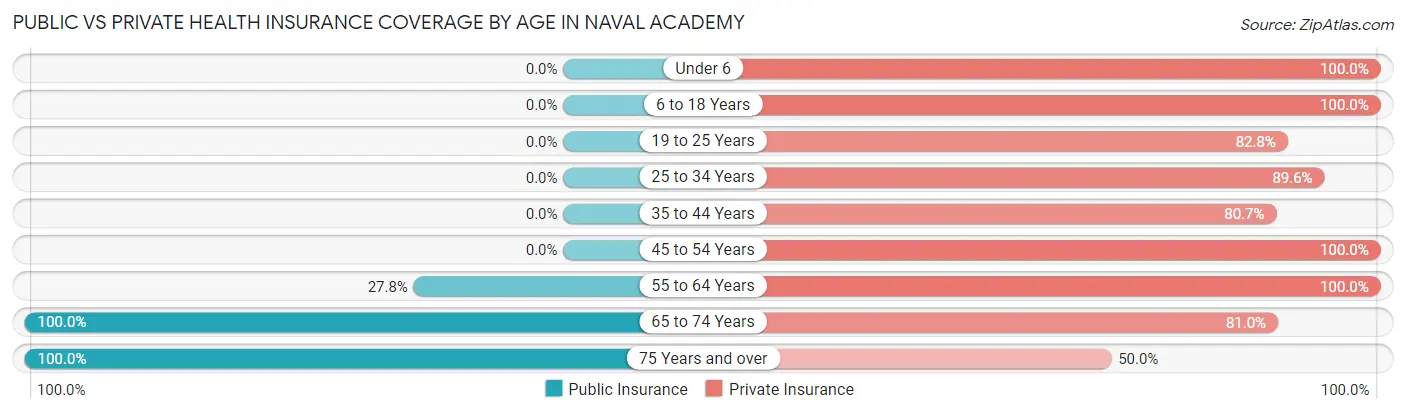
| Age Bracket | Public Insurance | Private Insurance |
| Under 6 | 0 (0.0%) | 92 (100.0%) |
| 6 to 18 Years | 0 (0.0%) | 75 (100.0%) |
| 19 to 25 Years | 0 (0.0%) | 24 (82.8%) |
| 25 to 34 Years | 0 (0.0%) | 43 (89.6%) |
| 35 to 44 Years | 0 (0.0%) | 25 (80.6%) |
| 45 to 54 Years | 0 (0.0%) | 10 (100.0%) |
| 55 to 64 Years | 5 (27.8%) | 18 (100.0%) |
| 65 to 74 Years | 21 (100.0%) | 17 (80.9%) |
| 75 Years and over | 10 (100.0%) | 5 (50.0%) |
| Total | 36 (10.8%) | 309 (92.5%) |
Disability Status by Sex by Age in Naval Academy

| Age Bracket | Male | Female |
| Under 5 Years | 0 (0.0%) | 0 (0.0%) |
| 5 to 17 Years | 13 (36.1%) | 0 (0.0%) |
| 18 to 34 Years | 0 (0.0%) | 0 (0.0%) |
| 35 to 64 Years | 6 (37.5%) | 4 (9.3%) |
| 65 to 74 Years | 0 (0.0%) | 0 (0.0%) |
| 75 Years and over | 0 (0.0%) | 0 (0.0%) |
Disability Class by Sex by Age in Naval Academy
Disability Class: Hearing Difficulty
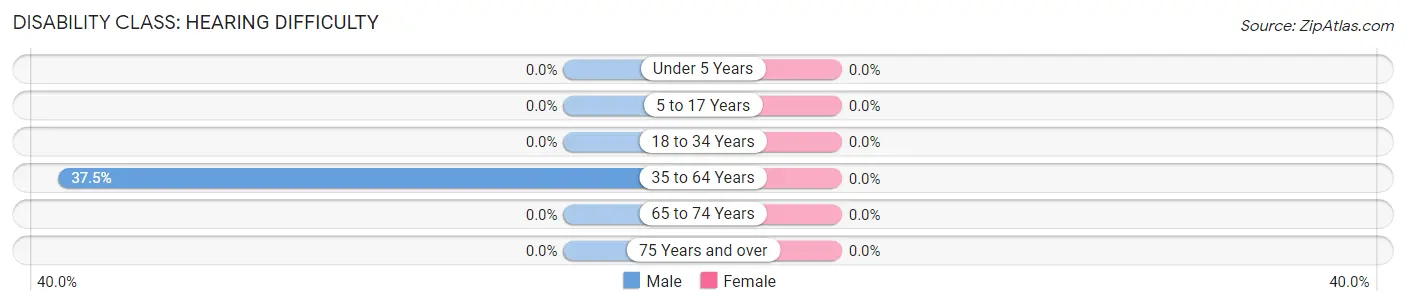
| Age Bracket | Male | Female |
| Under 5 Years | 0 (0.0%) | 0 (0.0%) |
| 5 to 17 Years | 0 (0.0%) | 0 (0.0%) |
| 18 to 34 Years | 0 (0.0%) | 0 (0.0%) |
| 35 to 64 Years | 6 (37.5%) | 0 (0.0%) |
| 65 to 74 Years | 0 (0.0%) | 0 (0.0%) |
| 75 Years and over | 0 (0.0%) | 0 (0.0%) |
Disability Class: Vision Difficulty
| Age Bracket | Male | Female |
| Under 5 Years | 0 (0.0%) | 0 (0.0%) |
| 5 to 17 Years | 0 (0.0%) | 0 (0.0%) |
| 18 to 34 Years | 0 (0.0%) | 0 (0.0%) |
| 35 to 64 Years | 0 (0.0%) | 0 (0.0%) |
| 65 to 74 Years | 0 (0.0%) | 0 (0.0%) |
| 75 Years and over | 0 (0.0%) | 0 (0.0%) |
Disability Class: Cognitive Difficulty
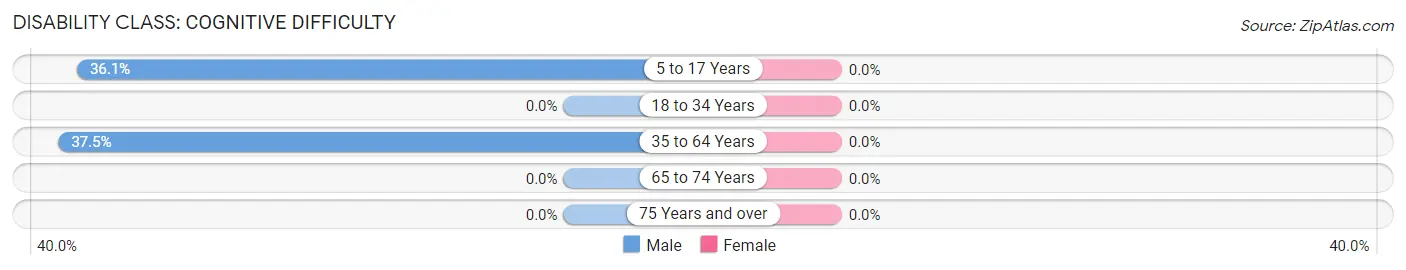
| Age Bracket | Male | Female |
| 5 to 17 Years | 13 (36.1%) | 0 (0.0%) |
| 18 to 34 Years | 0 (0.0%) | 0 (0.0%) |
| 35 to 64 Years | 6 (37.5%) | 0 (0.0%) |
| 65 to 74 Years | 0 (0.0%) | 0 (0.0%) |
| 75 Years and over | 0 (0.0%) | 0 (0.0%) |
Disability Class: Ambulatory Difficulty
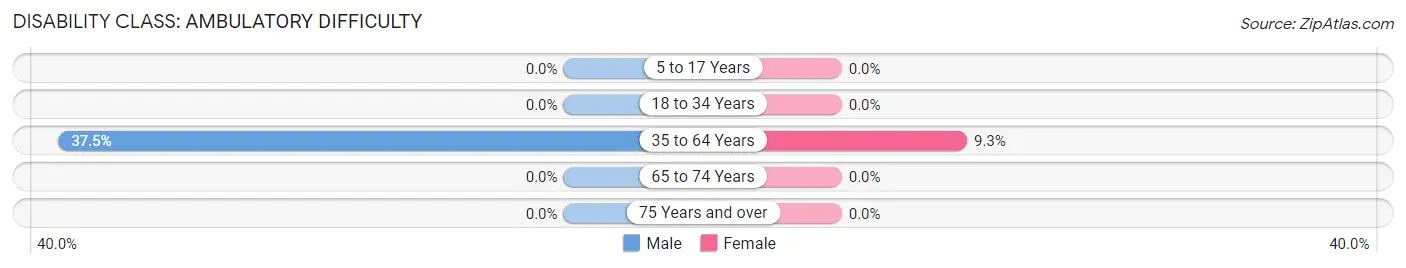
| Age Bracket | Male | Female |
| 5 to 17 Years | 0 (0.0%) | 0 (0.0%) |
| 18 to 34 Years | 0 (0.0%) | 0 (0.0%) |
| 35 to 64 Years | 6 (37.5%) | 4 (9.3%) |
| 65 to 74 Years | 0 (0.0%) | 0 (0.0%) |
| 75 Years and over | 0 (0.0%) | 0 (0.0%) |
Disability Class: Self-Care Difficulty
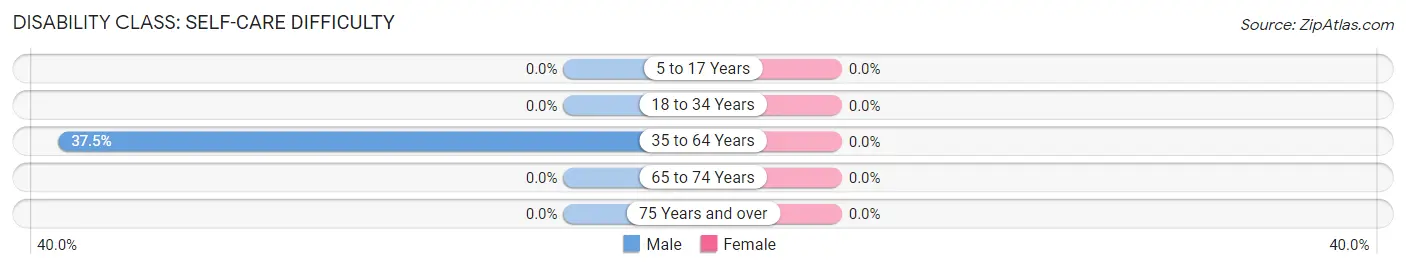
| Age Bracket | Male | Female |
| 5 to 17 Years | 0 (0.0%) | 0 (0.0%) |
| 18 to 34 Years | 0 (0.0%) | 0 (0.0%) |
| 35 to 64 Years | 6 (37.5%) | 0 (0.0%) |
| 65 to 74 Years | 0 (0.0%) | 0 (0.0%) |
| 75 Years and over | 0 (0.0%) | 0 (0.0%) |
Technology Access in Naval Academy
Computing Device Access in Naval Academy
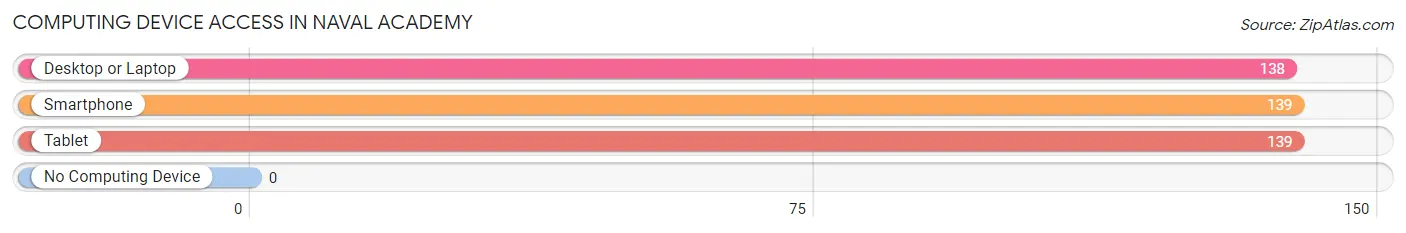
| Device Type | # Households | % Households |
| Desktop or Laptop | 138 | 93.2% |
| Smartphone | 139 | 93.9% |
| Tablet | 139 | 93.9% |
| No Computing Device | 0 | 0.0% |
| Total | 148 | 100.0% |
Internet Access in Naval Academy
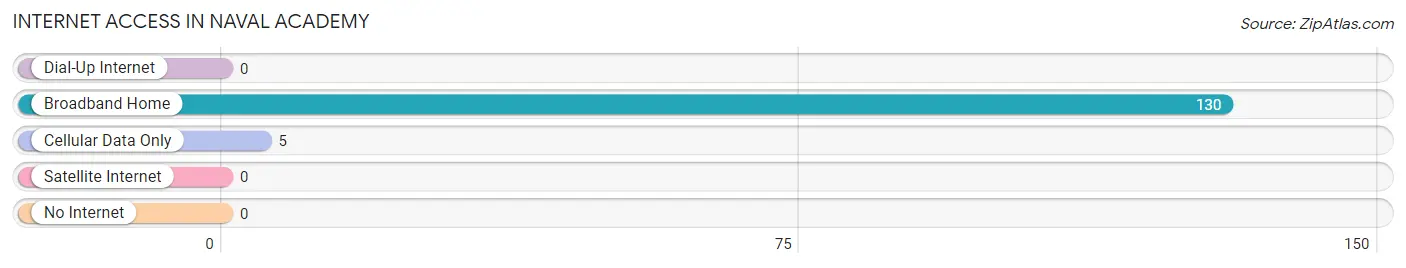
| Internet Type | # Households | % Households |
| Dial-Up Internet | 0 | 0.0% |
| Broadband Home | 130 | 87.8% |
| Cellular Data Only | 5 | 3.4% |
| Satellite Internet | 0 | 0.0% |
| No Internet | 0 | 0.0% |
| Total | 148 | 100.0% |
Naval Academy Summary
The United States Naval Academy (USNA) is located in Annapolis, Maryland, and is the undergraduate college of the United States Navy. Established in 1845, the USNA is the second oldest of the five United States service academies and is the only one located in a major city. The USNA is a four-year coeducational federal service academy that educates and trains officers for the United States Navy and Marine Corps.
History
The USNA was established in 1845 by an act of Congress, and is the second oldest of the five United States service academies. The first classes were held in October 1845, and the first graduating class was in 1846. The USNA was originally located in Fort Severn, Maryland, but was moved to its current location in Annapolis in 1850.
The USNA has a long and distinguished history of producing some of the nation’s most distinguished military leaders. Among its graduates are five of the first seven astronauts to walk on the moon, five of the first seven astronauts to fly in space, and seven of the first nine astronauts to fly in space. The USNA has also produced numerous admirals, generals, and other high-ranking officers in the United States military.
Geography
The USNA is located in Annapolis, Maryland, which is situated on the Chesapeake Bay. Annapolis is the capital of Maryland and is located approximately 25 miles east of Washington, D.C. The USNA is located on the banks of the Severn River, which is a tributary of the Chesapeake Bay. The USNA campus is situated on 338 acres of land and includes a variety of buildings, monuments, and memorials.
Economy
The USNA has a significant economic impact on the city of Annapolis and the surrounding area. The USNA is the largest employer in the city, with over 4,000 faculty and staff members. The USNA also has a significant economic impact on the local economy through its purchases of goods and services, as well as its contributions to the local tax base.
Demographics
The USNA is a four-year coeducational federal service academy that educates and trains officers for the United States Navy and Marine Corps. The student body is composed of approximately 4,500 midshipmen, of which approximately 1,200 are women. The student body is also diverse, with students from all 50 states and several foreign countries. The USNA also has a large international student population, with students from over 40 countries.
Common Questions
What is the Total Population of Naval Academy?
Total Population of Naval Academy is 2,016.
What is the Total Male Population of Naval Academy?
Total Male Population of Naval Academy is 1,516.
What is the Total Female Population of Naval Academy?
Total Female Population of Naval Academy is 500.
What is the Ratio of Males per 100 Females in Naval Academy?
There are 303.20 Males per 100 Females in Naval Academy.
What is the Ratio of Females per 100 Males in Naval Academy?
There are 32.98 Females per 100 Males in Naval Academy.
What is the Median Population Age in Naval Academy?
Median Population Age in Naval Academy is 21.5 Years.
What is the Average Family Size in Naval Academy
Average Family Size in Naval Academy is 3.8 People.
What is the Average Household Size in Naval Academy
Average Household Size in Naval Academy is 2.9 People.
What is Per Capita Income in Naval Academy?
Per Capita income in Naval Academy is $28,215.
What is the Median Family Income in Naval Academy?
Median Family Income in Naval Academy is $115,125.
What is the Median Household income in Naval Academy?
Median Household Income in Naval Academy is $114,054.
What is Income or Wage Gap in Naval Academy?
Income or Wage Gap in Naval Academy is 26.6%.
Women in Naval Academy earn 73.4 cents for every dollar earned by a man.
What is Inequality or Gini Index in Naval Academy?
Inequality or Gini Index in Naval Academy is 0.16.
How Large is the Labor Force in Naval Academy?
There are 1,734 People in the Labor Forcein in Naval Academy.
What is the Percentage of People in the Labor Force in Naval Academy?
93.8% of People are in the Labor Force in Naval Academy.
What is the Unemployment Rate in Naval Academy?
Unemployment Rate in Naval Academy is 2.3%.