Cities with the Highest Percentage of Immigrants from Russia in Connecticut
RELATED REPORTS & OPTIONS
Russia
Connecticut
Compare Cities
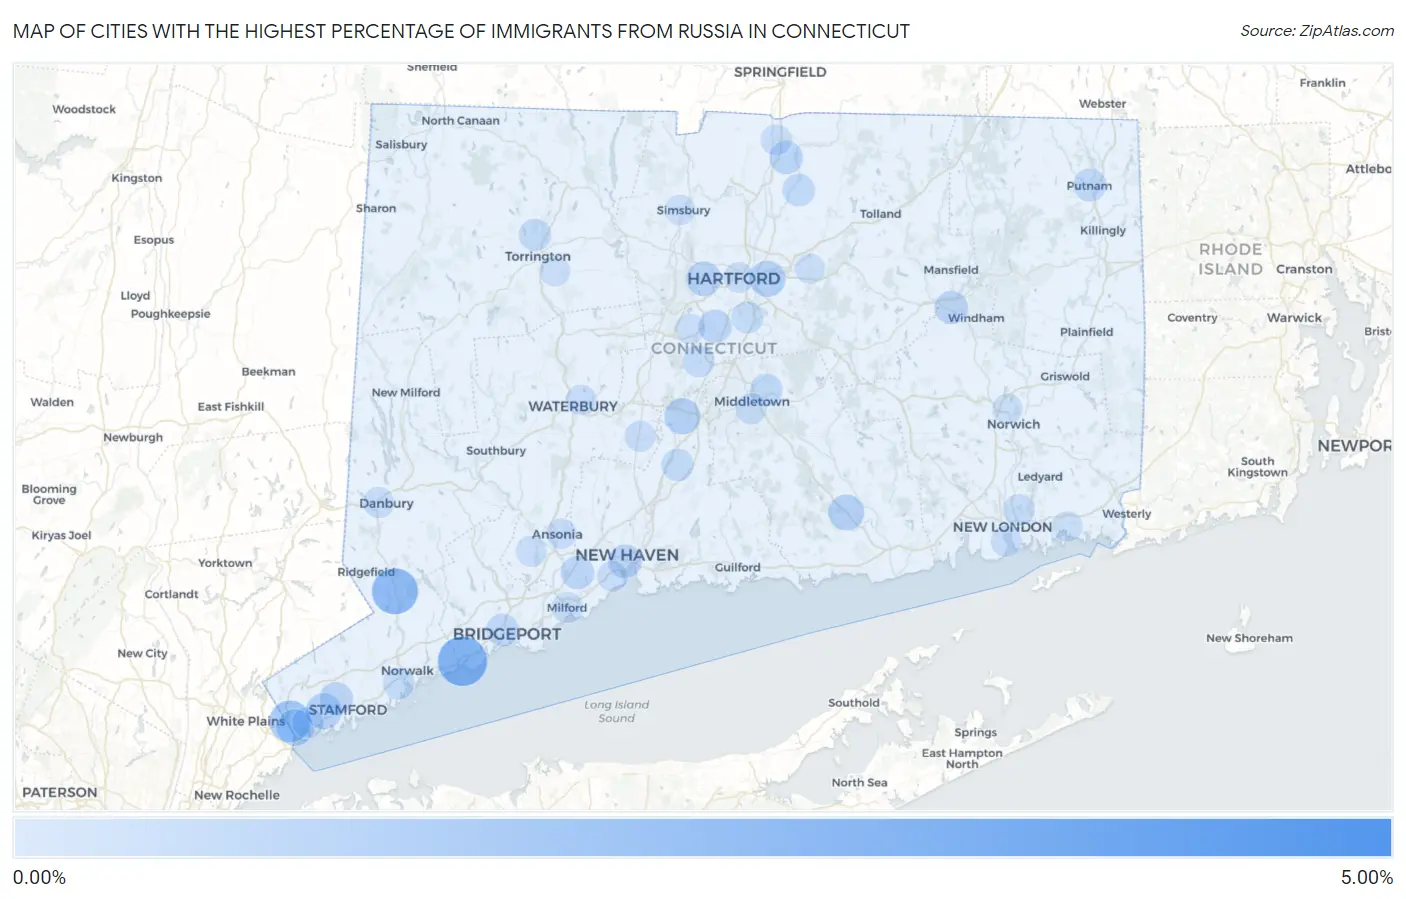
Map of Cities with the Highest Percentage of Immigrants from Russia in Connecticut
0.00%
5.00%
Cities with the Highest Percentage of Immigrants from Russia in Connecticut
| City | Russia | vs State | vs National | |
| 1. | Indian Field | 4.21% | 0.18%(+4.03)#1 | 0.12%(+4.09)#28 |
| 2. | Southport | 2.38% | 0.18%(+2.20)#2 | 0.12%(+2.25)#86 |
| 3. | Georgetown | 1.93% | 0.18%(+1.75)#3 | 0.12%(+1.81)#127 |
| 4. | Inglenook | 1.39% | 0.18%(+1.21)#4 | 0.12%(+1.26)#218 |
| 5. | Glenville | 1.38% | 0.18%(+1.20)#5 | 0.12%(+1.26)#222 |
| 6. | Greens Farms | 1.38% | 0.18%(+1.20)#6 | 0.12%(+1.25)#225 |
| 7. | Lakes East | 0.89% | 0.18%(+0.714)#7 | 0.12%(+0.769)#424 |
| 8. | Pemberwick | 0.78% | 0.18%(+0.600)#8 | 0.12%(+0.655)#503 |
| 9. | Daniels Farm | 0.73% | 0.18%(+0.547)#9 | 0.12%(+0.602)#546 |
| 10. | East Hartford | 0.72% | 0.18%(+0.540)#10 | 0.12%(+0.596)#555 |
| 11. | Meriden | 0.71% | 0.18%(+0.535)#11 | 0.12%(+0.591)#561 |
| 12. | Cos Cob | 0.70% | 0.18%(+0.526)#12 | 0.12%(+0.581)#571 |
| 13. | Deep River Center | 0.70% | 0.18%(+0.525)#13 | 0.12%(+0.581)#572 |
| 14. | West Hartford | 0.55% | 0.18%(+0.368)#14 | 0.12%(+0.423)#782 |
| 15. | Coleytown | 0.53% | 0.18%(+0.352)#15 | 0.12%(+0.408)#808 |
| 16. | New Canaan | 0.52% | 0.18%(+0.346)#16 | 0.12%(+0.402)#814 |
| 17. | Sandy Hook | 0.47% | 0.18%(+0.290)#17 | 0.12%(+0.346)#918 |
| 18. | New Haven | 0.43% | 0.18%(+0.247)#18 | 0.12%(+0.302)#991 |
| 19. | Newington | 0.39% | 0.18%(+0.215)#19 | 0.12%(+0.271)#1,075 |
| 20. | Orange | 0.39% | 0.18%(+0.215)#20 | 0.12%(+0.271)#1,077 |
| 21. | Southwood Acres | 0.39% | 0.18%(+0.212)#21 | 0.12%(+0.268)#1,087 |
| 22. | Willimantic | 0.39% | 0.18%(+0.210)#22 | 0.12%(+0.266)#1,096 |
| 23. | Stamford | 0.39% | 0.18%(+0.208)#23 | 0.12%(+0.264)#1,099 |
| 24. | Lakes West | 0.37% | 0.18%(+0.190)#24 | 0.12%(+0.245)#1,143 |
| 25. | Putnam | 0.33% | 0.18%(+0.154)#25 | 0.12%(+0.210)#1,243 |
| 26. | Bridgeport | 0.32% | 0.18%(+0.145)#26 | 0.12%(+0.201)#1,276 |
| 27. | Woodmont Borough | 0.31% | 0.18%(+0.130)#27 | 0.12%(+0.186)#1,324 |
| 28. | Broad Brook | 0.30% | 0.18%(+0.121)#28 | 0.12%(+0.177)#1,361 |
| 29. | Portland | 0.28% | 0.18%(+0.102)#29 | 0.12%(+0.158)#1,434 |
| 30. | Wallingford Center | 0.27% | 0.18%(+0.094)#30 | 0.12%(+0.149)#1,464 |
| 31. | Torrington | 0.26% | 0.18%(+0.081)#31 | 0.12%(+0.136)#1,511 |
| 32. | Compo | 0.25% | 0.18%(+0.069)#32 | 0.12%(+0.125)#1,564 |
| 33. | Kensington | 0.21% | 0.18%(+0.030)#33 | 0.12%(+0.086)#1,788 |
| 34. | Wethersfield | 0.21% | 0.18%(+0.027)#34 | 0.12%(+0.083)#1,807 |
| 35. | Norwalk | 0.18% | 0.18%(-0.003)#35 | 0.12%(+0.053)#1,976 |
| 36. | Conning Towers Nautilus Park | 0.17% | 0.18%(-0.010)#36 | 0.12%(+0.045)#2,034 |
| 37. | Milford City Balance | 0.13% | 0.18%(-0.048)#37 | 0.12%(+0.007)#2,325 |
| 38. | Danbury | 0.12% | 0.18%(-0.058)#38 | 0.12%(-0.003)#2,415 |
| 39. | Middletown | 0.12% | 0.18%(-0.060)#39 | 0.12%(-0.004)#2,433 |
| 40. | New London | 0.11% | 0.18%(-0.073)#40 | 0.12%(-0.018)#2,572 |
| 41. | Shelton | 0.10% | 0.18%(-0.074)#41 | 0.12%(-0.018)#2,583 |
| 42. | Cheshire Village | 0.10% | 0.18%(-0.076)#42 | 0.12%(-0.021)#2,605 |
| 43. | Thompsonville | 0.099% | 0.18%(-0.080)#43 | 0.12%(-0.024)#2,643 |
| 44. | Greenwich | 0.093% | 0.18%(-0.086)#44 | 0.12%(-0.030)#2,722 |
| 45. | West Haven | 0.060% | 0.18%(-0.119)#45 | 0.12%(-0.063)#3,079 |
| 46. | Hartford | 0.054% | 0.18%(-0.125)#46 | 0.12%(-0.069)#3,146 |
| 47. | Ansonia | 0.053% | 0.18%(-0.126)#47 | 0.12%(-0.070)#3,155 |
| 48. | Waterbury | 0.037% | 0.18%(-0.142)#48 | 0.12%(-0.086)#3,369 |
| 49. | New Britain | 0.035% | 0.18%(-0.144)#49 | 0.12%(-0.088)#3,391 |
| 50. | Simsbury Center | 0.033% | 0.18%(-0.146)#50 | 0.12%(-0.090)#3,424 |
| 51. | Northwest Harwinton | 0.031% | 0.18%(-0.147)#51 | 0.12%(-0.092)#3,446 |
| 52. | Mystic | 0.023% | 0.18%(-0.156)#52 | 0.12%(-0.100)#3,555 |
| 53. | Norwich | 0.0075% | 0.18%(-0.171)#53 | 0.12%(-0.115)#3,724 |
| 54. | Manchester | 0.0054% | 0.18%(-0.173)#54 | 0.12%(-0.117)#3,744 |
1
2Common Questions
What are the Top 10 Cities with the Highest Percentage of Immigrants from Russia in Connecticut?
Top 10 Cities with the Highest Percentage of Immigrants from Russia in Connecticut are:
#1
2.38%
#2
1.93%
#3
1.38%
#4
0.78%
#5
0.72%
#6
0.71%
#7
0.70%
#8
0.70%
#9
0.55%
#10
0.43%
What city has the Highest Percentage of Immigrants from Russia in Connecticut?
Southport has the Highest Percentage of Immigrants from Russia in Connecticut with 2.38%.
What is the Percentage of Immigrants from Russia in the State of Connecticut?
Percentage of Immigrants from Russia in Connecticut is 0.18%.
What is the Percentage of Immigrants from Russia in the United States?
Percentage of Immigrants from Russia in the United States is 0.12%.