Cities with the Highest Percentage of Immigrants from Peru in Connecticut
RELATED REPORTS & OPTIONS
Peru
Connecticut
Compare Cities
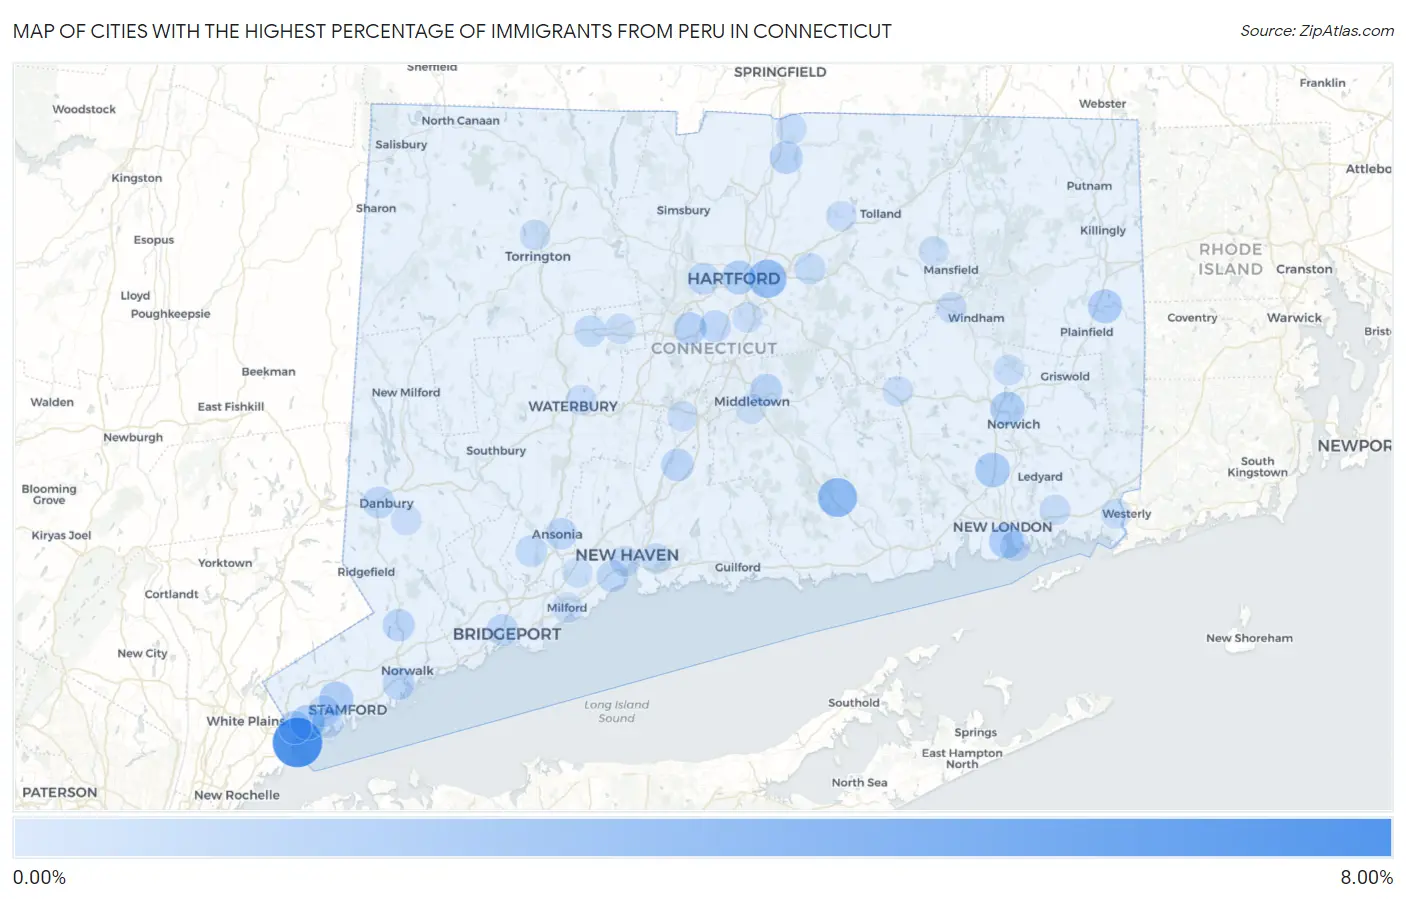
Map of Cities with the Highest Percentage of Immigrants from Peru in Connecticut
0.00%
8.00%
Cities with the Highest Percentage of Immigrants from Peru in Connecticut
| City | Peru | vs State | vs National | |
| 1. | Byram | 6.74% | 0.38%(+6.36)#-1 | 0.14%(+6.60)#0 |
| 2. | Botsford | 5.25% | 0.38%(+4.88)#0 | 0.14%(+5.11)#1 |
| 3. | Chester Center | 3.01% | 0.38%(+2.63)#1 | 0.14%(+2.87)#2 |
| 4. | East Hartford | 2.72% | 0.38%(+2.35)#2 | 0.14%(+2.59)#3 |
| 5. | Greenwich | 1.53% | 0.38%(+1.15)#7 | 0.14%(+1.39)#519 |
| 6. | Oxoboxo River | 1.52% | 0.38%(+1.15)#8 | 0.14%(+1.38)#520 |
| 7. | Norwich | 1.39% | 0.38%(+1.01)#9 | 0.14%(+1.25)#521 |
| 8. | New London | 1.38% | 0.38%(+1.00)#10 | 0.14%(+1.24)#1,026 |
| 9. | Stamford | 1.35% | 0.38%(+0.973)#14 | 0.14%(+1.21)#1,359 |
| 10. | Moosup | 1.29% | 0.38%(+0.915)#15 | 0.14%(+1.15)#1,360 |
| 11. | Hartford | 1.26% | 0.38%(+0.882)#16 | 0.14%(+1.12)#1,361 |
| 12. | Pemberwick | 1.03% | 0.38%(+0.651)#17 | 0.14%(+0.888)#1,362 |
| 13. | New Britain | 0.94% | 0.38%(+0.563)#18 | 0.14%(+0.800)#1,363 |
| 14. | Southwood Acres | 0.92% | 0.38%(+0.544)#19 | 0.14%(+0.781)#1,364 |
| 15. | Wallingford Center | 0.83% | 0.38%(+0.451)#20 | 0.14%(+0.688)#1,365 |
| 16. | Norwalk | 0.78% | 0.38%(+0.401)#21 | 0.14%(+0.638)#1,366 |
| 17. | Portland | 0.76% | 0.38%(+0.387)#22 | 0.14%(+0.624)#1,367 |
| 18. | Wilton Center | 0.73% | 0.38%(+0.354)#23 | 0.14%(+0.591)#1,368 |
| 19. | Noroton | 0.70% | 0.38%(+0.319)#24 | 0.14%(+0.556)#1,369 |
| 20. | West Hartford | 0.61% | 0.38%(+0.232)#25 | 0.14%(+0.469)#1,370 |
| 21. | Danbury | 0.60% | 0.38%(+0.219)#26 | 0.14%(+0.456)#1,546 |
| 22. | Bridgeport | 0.56% | 0.38%(+0.188)#27 | 0.14%(+0.425)#1,547 |
| 23. | West Haven | 0.54% | 0.38%(+0.166)#28 | 0.14%(+0.403)#1,548 |
| 24. | Cos Cob | 0.52% | 0.38%(+0.148)#29 | 0.14%(+0.385)#1,549 |
| 25. | Newington | 0.52% | 0.38%(+0.139)#30 | 0.14%(+0.376)#1,550 |
| 26. | Ansonia | 0.51% | 0.38%(+0.130)#31 | 0.14%(+0.367)#1,551 |
| 27. | Terryville | 0.48% | 0.38%(+0.104)#32 | 0.14%(+0.341)#1,552 |
| 28. | Shelton | 0.46% | 0.38%(+0.087)#33 | 0.14%(+0.324)#1,553 |
| 29. | Manchester | 0.38% | 0.38%(+0.007)#34 | 0.14%(+0.244)#1,554 |
| 30. | Riverside | 0.35% | 0.38%(-0.024)#35 | 0.14%(+0.213)#1,555 |
| 31. | Tokeneke | 0.31% | 0.38%(-0.066)#36 | 0.14%(+0.171)#1,556 |
| 32. | Sherwood Manor | 0.28% | 0.38%(-0.097)#37 | 0.14%(+0.140)#1,557 |
| 33. | East Haven | 0.26% | 0.38%(-0.114)#38 | 0.14%(+0.123)#1,558 |
| 34. | Baltic | 0.26% | 0.38%(-0.115)#39 | 0.14%(+0.122)#1,559 |
| 35. | Trumbull Center | 0.24% | 0.38%(-0.134)#40 | 0.14%(+0.103)#1,560 |
| 36. | New Haven | 0.20% | 0.38%(-0.173)#41 | 0.14%(+0.064)#1,561 |
| 37. | Torrington | 0.19% | 0.38%(-0.190)#42 | 0.14%(+0.047)#1,562 |
| 38. | Old Mystic | 0.18% | 0.38%(-0.199)#43 | 0.14%(+0.038)#1,563 |
| 39. | Bristol | 0.16% | 0.38%(-0.221)#44 | 0.14%(+0.016)#1,564 |
| 40. | Waterbury | 0.15% | 0.38%(-0.226)#45 | 0.14%(+0.011)#1,565 |
| 41. | Bethel | 0.15% | 0.38%(-0.229)#46 | 0.14%(+0.008)#1,566 |
| 42. | Colchester | 0.14% | 0.38%(-0.233)#47 | 0.14%(+0.004)#1,567 |
| 43. | Groton | 0.13% | 0.38%(-0.248)#48 | 0.14%(-0.011)#1,568 |
| 44. | Meriden | 0.13% | 0.38%(-0.251)#49 | 0.14%(-0.014)#1,569 |
| 45. | Sandy Hook | 0.12% | 0.38%(-0.251)#50 | 0.14%(-0.014)#1,570 |
| 46. | Willimantic | 0.11% | 0.38%(-0.264)#51 | 0.14%(-0.027)#1,571 |
| 47. | New Canaan | 0.10% | 0.38%(-0.274)#52 | 0.14%(-0.037)#1,572 |
| 48. | Rockville | 0.10% | 0.38%(-0.276)#53 | 0.14%(-0.039)#1,573 |
| 49. | Milford City Balance | 0.093% | 0.38%(-0.284)#54 | 0.14%(-0.047)#1,574 |
| 50. | Pawcatuck | 0.090% | 0.38%(-0.287)#55 | 0.14%(-0.050)#1,575 |
| 51. | Wethersfield | 0.085% | 0.38%(-0.292)#56 | 0.14%(-0.055)#1,576 |
| 52. | Orange | 0.056% | 0.38%(-0.320)#57 | 0.14%(-0.083)#1,577 |
| 53. | Middletown | 0.046% | 0.38%(-0.331)#58 | 0.14%(-0.094)#1,578 |
| 54. | Naugatuck Borough | 0.035% | 0.38%(-0.342)#59 | 0.14%(-0.105)#1,579 |
| 55. | Storrs | 0.023% | 0.38%(-0.354)#60 | 0.14%(-0.117)#1,580 |
1
2Common Questions
What are the Top 10 Cities with the Highest Percentage of Immigrants from Peru in Connecticut?
Top 10 Cities with the Highest Percentage of Immigrants from Peru in Connecticut are:
#1
6.74%
#2
3.01%
#3
2.72%
#4
1.53%
#5
1.52%
#6
1.39%
#7
1.38%
#8
1.35%
#9
1.29%
#10
1.26%
What city has the Highest Percentage of Immigrants from Peru in Connecticut?
Byram has the Highest Percentage of Immigrants from Peru in Connecticut with 6.74%.
What is the Percentage of Immigrants from Peru in the State of Connecticut?
Percentage of Immigrants from Peru in Connecticut is 0.38%.
What is the Percentage of Immigrants from Peru in the United States?
Percentage of Immigrants from Peru in the United States is 0.14%.