Cities with the Highest Percentage of Immigrants from Nigeria in Michigan
RELATED REPORTS & OPTIONS
Nigeria
Michigan
Compare Cities
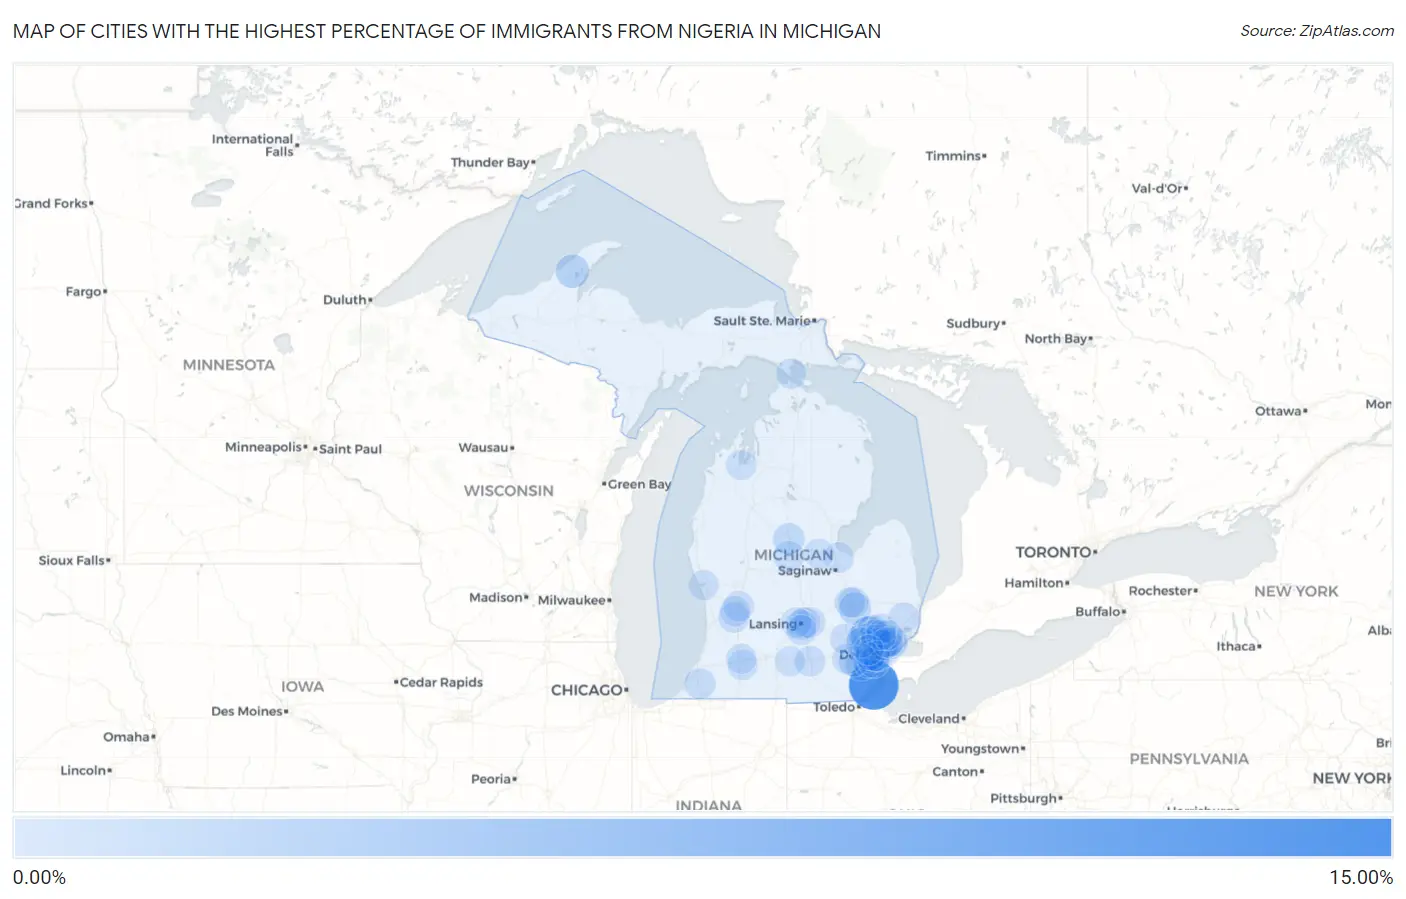
Map of Cities with the Highest Percentage of Immigrants from Nigeria in Michigan
0.00%
15.00%
Cities with the Highest Percentage of Immigrants from Nigeria in Michigan
| City | Nigeria | vs State | vs National | |
| 1. | Stony Point | 10.08% | 0.059%(+10.0)#-1 | 0.13%(+9.95)#0 |
| 2. | Orchard Lake Village | 3.50% | 0.059%(+3.44)#0 | 0.13%(+3.38)#1 |
| 3. | Houghton | 1.59% | 0.059%(+1.53)#1 | 0.13%(+1.46)#2 |
| 4. | Wayne | 1.00% | 0.059%(+0.943)#2 | 0.13%(+0.876)#3 |
| 5. | Grand Blanc | 0.98% | 0.059%(+0.924)#3 | 0.13%(+0.858)#4 |
| 6. | Westland | 0.76% | 0.059%(+0.699)#4 | 0.13%(+0.632)#5 |
| 7. | Belleville | 0.68% | 0.059%(+0.619)#5 | 0.13%(+0.553)#6 |
| 8. | Clare | 0.65% | 0.059%(+0.594)#6 | 0.13%(+0.528)#7 |
| 9. | Southfield | 0.63% | 0.059%(+0.566)#20 | 0.13%(+0.500)#1,558 |
| 10. | Inkster | 0.47% | 0.059%(+0.409)#21 | 0.13%(+0.343)#1,559 |
| 11. | Berrien Springs | 0.35% | 0.059%(+0.287)#22 | 0.13%(+0.220)#1,560 |
| 12. | Oak Park | 0.32% | 0.059%(+0.256)#23 | 0.13%(+0.190)#1,561 |
| 13. | Mount Pleasant | 0.28% | 0.059%(+0.225)#24 | 0.13%(+0.158)#1,562 |
| 14. | Ann Arbor | 0.26% | 0.059%(+0.200)#25 | 0.13%(+0.134)#1,563 |
| 15. | Byron Center | 0.23% | 0.059%(+0.170)#26 | 0.13%(+0.103)#1,564 |
| 16. | Haslett | 0.23% | 0.059%(+0.166)#27 | 0.13%(+0.099)#1,565 |
| 17. | Farmington Hills | 0.20% | 0.059%(+0.138)#28 | 0.13%(+0.072)#1,566 |
| 18. | Walled Lake | 0.18% | 0.059%(+0.120)#29 | 0.13%(+0.053)#1,567 |
| 19. | Jackson | 0.18% | 0.059%(+0.119)#30 | 0.13%(+0.052)#1,568 |
| 20. | Pontiac | 0.18% | 0.059%(+0.118)#31 | 0.13%(+0.052)#1,569 |
| 21. | Grand Rapids | 0.17% | 0.059%(+0.106)#32 | 0.13%(+0.040)#1,944 |
| 22. | Bloomfield Hills | 0.16% | 0.059%(+0.100)#33 | 0.13%(+0.033)#1,945 |
| 23. | Detroit | 0.16% | 0.059%(+0.099)#34 | 0.13%(+0.032)#2,033 |
| 24. | Romulus | 0.15% | 0.059%(+0.088)#35 | 0.13%(+0.022)#2,034 |
| 25. | Hazel Park | 0.14% | 0.059%(+0.080)#36 | 0.13%(+0.014)#2,035 |
| 26. | Portage | 0.14% | 0.059%(+0.078)#37 | 0.13%(+0.011)#2,036 |
| 27. | Ferndale | 0.13% | 0.059%(+0.070)#38 | 0.13%(+0.004)#2,037 |
| 28. | Center Line | 0.13% | 0.059%(+0.070)#39 | 0.13%(+0.004)#2,038 |
| 29. | Ypsilanti | 0.13% | 0.059%(+0.069)#40 | 0.13%(+0.003)#2,039 |
| 30. | Burton | 0.13% | 0.059%(+0.069)#41 | 0.13%(+0.003)#2,040 |
| 31. | Taylor | 0.13% | 0.059%(+0.068)#42 | 0.13%(+0.001)#2,041 |
| 32. | East Lansing | 0.12% | 0.059%(+0.060)#43 | 0.13%(-0.007)#2,042 |
| 33. | Brighton | 0.11% | 0.059%(+0.048)#44 | 0.13%(-0.019)#2,043 |
| 34. | Flint | 0.099% | 0.059%(+0.040)#45 | 0.13%(-0.027)#2,044 |
| 35. | Beverly Hills | 0.095% | 0.059%(+0.035)#46 | 0.13%(-0.031)#2,045 |
| 36. | St Ignace | 0.090% | 0.059%(+0.030)#47 | 0.13%(-0.036)#2,046 |
| 37. | Richmond | 0.085% | 0.059%(+0.026)#48 | 0.13%(-0.040)#2,047 |
| 38. | Garden City | 0.085% | 0.059%(+0.025)#49 | 0.13%(-0.041)#2,048 |
| 39. | Dearborn | 0.078% | 0.059%(+0.019)#50 | 0.13%(-0.047)#2,049 |
| 40. | Lansing | 0.059% | 0.059%(+0.000)#51 | 0.13%(-0.066)#2,050 |
| 41. | Traverse City | 0.052% | 0.059%(-0.008)#52 | 0.13%(-0.074)#2,051 |
| 42. | Waverly | 0.046% | 0.059%(-0.013)#53 | 0.13%(-0.079)#2,052 |
| 43. | Kalamazoo | 0.046% | 0.059%(-0.013)#54 | 0.13%(-0.079)#2,053 |
| 44. | Holt | 0.043% | 0.059%(-0.016)#55 | 0.13%(-0.082)#2,054 |
| 45. | Bay City | 0.031% | 0.059%(-0.029)#56 | 0.13%(-0.095)#2,055 |
| 46. | Eastpointe | 0.029% | 0.059%(-0.030)#57 | 0.13%(-0.096)#2,056 |
| 47. | Roseville | 0.027% | 0.059%(-0.032)#58 | 0.13%(-0.098)#2,057 |
| 48. | Novi | 0.026% | 0.059%(-0.033)#59 | 0.13%(-0.100)#2,058 |
| 49. | Warren | 0.024% | 0.059%(-0.035)#60 | 0.13%(-0.102)#2,059 |
| 50. | Dearborn Heights | 0.021% | 0.059%(-0.038)#61 | 0.13%(-0.105)#2,060 |
| 51. | Rochester Hills | 0.020% | 0.059%(-0.040)#62 | 0.13%(-0.106)#2,061 |
| 52. | Sterling Heights | 0.019% | 0.059%(-0.040)#63 | 0.13%(-0.106)#2,062 |
| 53. | Midland | 0.019% | 0.059%(-0.040)#64 | 0.13%(-0.107)#2,063 |
| 54. | Muskegon | 0.016% | 0.059%(-0.044)#65 | 0.13%(-0.110)#2,064 |
| 55. | Albion | 0.013% | 0.059%(-0.046)#66 | 0.13%(-0.113)#2,065 |
| 56. | Troy | 0.010% | 0.059%(-0.049)#67 | 0.13%(-0.115)#2,066 |
| 57. | Livonia | 0.0063% | 0.059%(-0.053)#68 | 0.13%(-0.119)#2,067 |
| 58. | Wyoming | 0.0039% | 0.059%(-0.055)#69 | 0.13%(-0.122)#2,068 |
Common Questions
What are the Top 10 Cities with the Highest Percentage of Immigrants from Nigeria in Michigan?
Top 10 Cities with the Highest Percentage of Immigrants from Nigeria in Michigan are:
#1
10.08%
#2
3.50%
#3
1.59%
#4
1.00%
#5
0.98%
#6
0.76%
#7
0.68%
#8
0.65%
#9
0.63%
#10
0.47%
What city has the Highest Percentage of Immigrants from Nigeria in Michigan?
Stony Point has the Highest Percentage of Immigrants from Nigeria in Michigan with 10.08%.
What is the Percentage of Immigrants from Nigeria in the State of Michigan?
Percentage of Immigrants from Nigeria in Michigan is 0.059%.
What is the Percentage of Immigrants from Nigeria in the United States?
Percentage of Immigrants from Nigeria in the United States is 0.13%.