Cities with the Highest Percentage of Immigrants from Korea in Ohio
RELATED REPORTS & OPTIONS
Korea
Ohio
Compare Cities
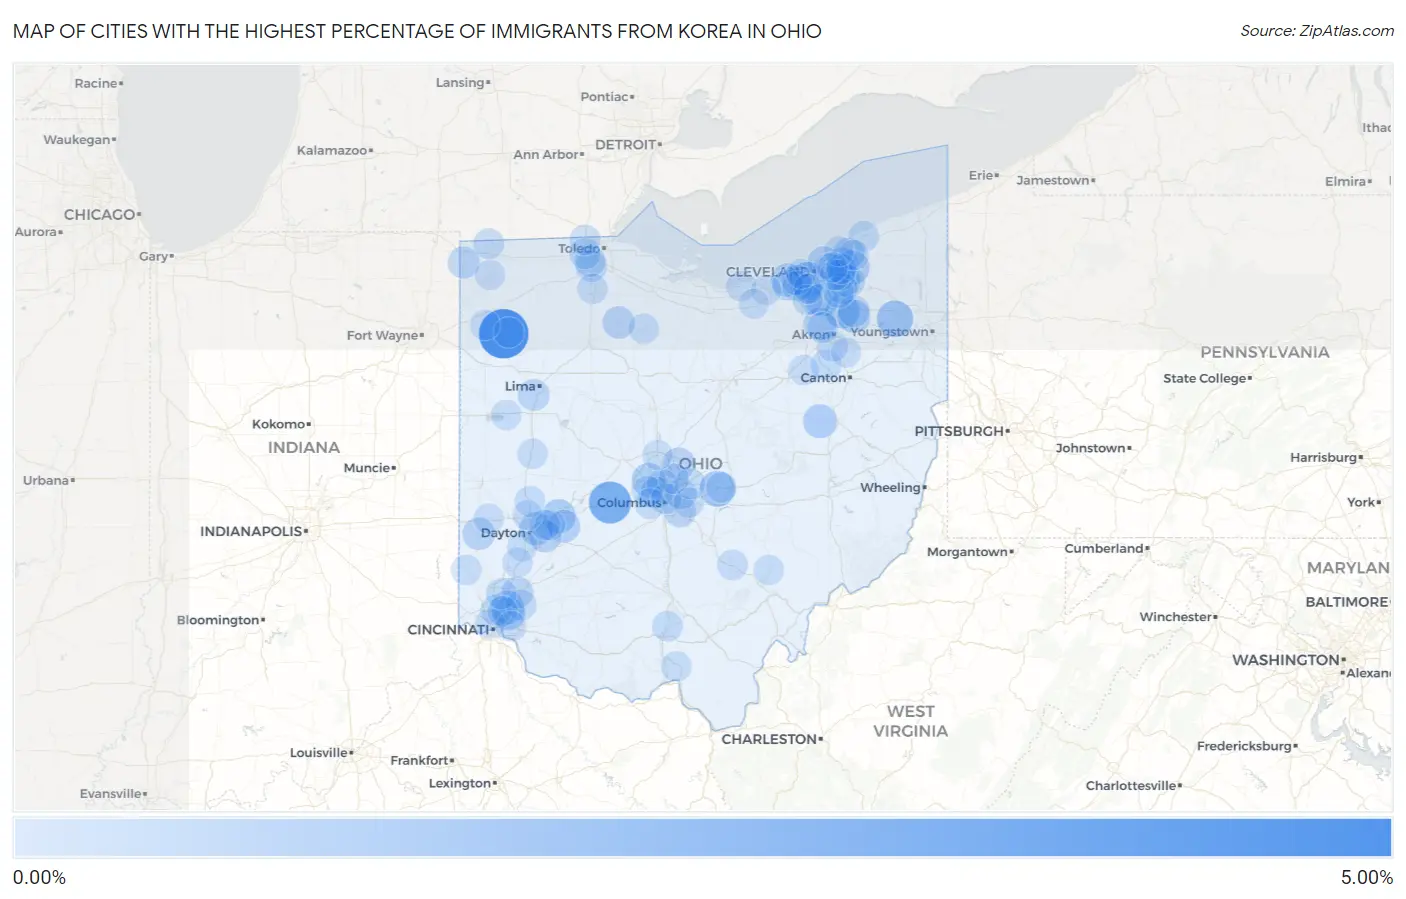
Map of Cities with the Highest Percentage of Immigrants from Korea in Ohio
0.00%
5.00%
Cities with the Highest Percentage of Immigrants from Korea in Ohio
| City | Korea | vs State | vs National | |
| 1. | Melrose | 4.90% | 0.097%(+4.80)#1 | 0.31%(+4.58)#100 |
| 2. | Sharon Center | 4.26% | 0.097%(+4.16)#2 | 0.31%(+3.94)#120 |
| 3. | Choctaw Lake | 2.98% | 0.097%(+2.88)#3 | 0.31%(+2.67)#189 |
| 4. | Newton Falls | 1.62% | 0.097%(+1.53)#4 | 0.31%(+1.31)#470 |
| 5. | Brooklyn | 1.55% | 0.097%(+1.45)#5 | 0.31%(+1.23)#497 |
| 6. | Granville South | 1.46% | 0.097%(+1.36)#6 | 0.31%(+1.14)#539 |
| 7. | Hudson | 1.13% | 0.097%(+1.03)#7 | 0.31%(+0.818)#742 |
| 8. | Dublin | 1.07% | 0.097%(+0.971)#8 | 0.31%(+0.755)#797 |
| 9. | Chesterland | 1.07% | 0.097%(+0.969)#9 | 0.31%(+0.754)#801 |
| 10. | Enon | 1.04% | 0.097%(+0.939)#10 | 0.31%(+0.724)#828 |
| 11. | Sugarcreek | 0.96% | 0.097%(+0.862)#11 | 0.31%(+0.647)#918 |
| 12. | Blue Ash | 0.94% | 0.097%(+0.841)#12 | 0.31%(+0.626)#949 |
| 13. | Riverside | 0.89% | 0.097%(+0.790)#13 | 0.31%(+0.574)#1,007 |
| 14. | Moreland Hills | 0.87% | 0.097%(+0.775)#14 | 0.31%(+0.560)#1,027 |
| 15. | Sugar Bush Knolls | 0.86% | 0.097%(+0.765)#15 | 0.31%(+0.550)#1,046 |
| 16. | Westlake | 0.83% | 0.097%(+0.735)#16 | 0.31%(+0.519)#1,085 |
| 17. | Brecksville | 0.82% | 0.097%(+0.726)#17 | 0.31%(+0.510)#1,095 |
| 18. | Yellow Springs | 0.75% | 0.097%(+0.652)#18 | 0.31%(+0.436)#1,195 |
| 19. | Kenwood | 0.75% | 0.097%(+0.651)#19 | 0.31%(+0.436)#1,196 |
| 20. | Montrose Ghent | 0.72% | 0.097%(+0.621)#20 | 0.31%(+0.405)#1,238 |
| 21. | Galena | 0.66% | 0.097%(+0.567)#21 | 0.31%(+0.352)#1,333 |
| 22. | Eaton | 0.66% | 0.097%(+0.561)#22 | 0.31%(+0.346)#1,344 |
| 23. | Bratenahl | 0.63% | 0.097%(+0.536)#23 | 0.31%(+0.321)#1,407 |
| 24. | Fostoria | 0.63% | 0.097%(+0.531)#24 | 0.31%(+0.315)#1,419 |
| 25. | Beavercreek | 0.61% | 0.097%(+0.517)#25 | 0.31%(+0.302)#1,443 |
| 26. | Blacklick Estates | 0.58% | 0.097%(+0.480)#26 | 0.31%(+0.265)#1,535 |
| 27. | Mayfield | 0.57% | 0.097%(+0.471)#27 | 0.31%(+0.256)#1,554 |
| 28. | Chagrin Falls | 0.56% | 0.097%(+0.462)#28 | 0.31%(+0.246)#1,577 |
| 29. | Edon | 0.55% | 0.097%(+0.458)#29 | 0.31%(+0.242)#1,586 |
| 30. | Waite Hill | 0.54% | 0.097%(+0.445)#30 | 0.31%(+0.229)#1,621 |
| 31. | Mason | 0.53% | 0.097%(+0.432)#31 | 0.31%(+0.217)#1,657 |
| 32. | Streetsboro | 0.52% | 0.097%(+0.421)#32 | 0.31%(+0.206)#1,689 |
| 33. | Fort Shawnee | 0.49% | 0.097%(+0.389)#33 | 0.31%(+0.174)#1,790 |
| 34. | Upper Arlington | 0.46% | 0.097%(+0.366)#34 | 0.31%(+0.151)#1,875 |
| 35. | Perrysburg | 0.41% | 0.097%(+0.314)#35 | 0.31%(+0.098)#2,072 |
| 36. | Riverlea | 0.39% | 0.097%(+0.292)#36 | 0.31%(+0.076)#2,172 |
| 37. | Broadview Heights | 0.36% | 0.097%(+0.267)#37 | 0.31%(+0.051)#2,267 |
| 38. | Maumee | 0.36% | 0.097%(+0.265)#38 | 0.31%(+0.049)#2,274 |
| 39. | Cleveland Heights | 0.36% | 0.097%(+0.261)#39 | 0.31%(+0.045)#2,288 |
| 40. | Holland | 0.32% | 0.097%(+0.224)#40 | 0.31%(+0.008)#2,478 |
| 41. | Wyoming | 0.31% | 0.097%(+0.213)#41 | 0.31%(-0.003)#2,544 |
| 42. | Gahanna | 0.30% | 0.097%(+0.204)#42 | 0.31%(-0.011)#2,585 |
| 43. | Pioneer | 0.30% | 0.097%(+0.203)#43 | 0.31%(-0.012)#2,594 |
| 44. | Solon | 0.30% | 0.097%(+0.203)#44 | 0.31%(-0.013)#2,601 |
| 45. | Canal Fulton | 0.28% | 0.097%(+0.185)#45 | 0.31%(-0.030)#2,695 |
| 46. | Hilliard | 0.27% | 0.097%(+0.177)#46 | 0.31%(-0.038)#2,741 |
| 47. | Pepper Pike | 0.27% | 0.097%(+0.169)#47 | 0.31%(-0.047)#2,797 |
| 48. | Loveland | 0.26% | 0.097%(+0.167)#48 | 0.31%(-0.048)#2,810 |
| 49. | Parma Heights | 0.25% | 0.097%(+0.154)#49 | 0.31%(-0.061)#2,897 |
| 50. | Logan | 0.25% | 0.097%(+0.154)#50 | 0.31%(-0.061)#2,898 |
| 51. | Painesville | 0.25% | 0.097%(+0.153)#51 | 0.31%(-0.062)#2,905 |
| 52. | Fairlawn | 0.25% | 0.097%(+0.150)#52 | 0.31%(-0.066)#2,924 |
| 53. | Lincoln Village | 0.24% | 0.097%(+0.144)#53 | 0.31%(-0.072)#2,974 |
| 54. | Waverly | 0.24% | 0.097%(+0.144)#54 | 0.31%(-0.072)#2,975 |
| 55. | Glenwillow | 0.24% | 0.097%(+0.139)#55 | 0.31%(-0.077)#3,015 |
| 56. | Portage Lakes | 0.23% | 0.097%(+0.137)#56 | 0.31%(-0.079)#3,031 |
| 57. | Beckett Ridge | 0.23% | 0.097%(+0.136)#57 | 0.31%(-0.080)#3,038 |
| 58. | North Olmsted | 0.22% | 0.097%(+0.120)#58 | 0.31%(-0.095)#3,147 |
| 59. | Sylvania | 0.22% | 0.097%(+0.119)#59 | 0.31%(-0.097)#3,166 |
| 60. | Columbus | 0.21% | 0.097%(+0.110)#60 | 0.31%(-0.106)#3,228 |
| 61. | Brook Park | 0.21% | 0.097%(+0.109)#61 | 0.31%(-0.107)#3,237 |
| 62. | Tipp City | 0.20% | 0.097%(+0.108)#62 | 0.31%(-0.108)#3,245 |
| 63. | Fairborn | 0.20% | 0.097%(+0.106)#63 | 0.31%(-0.109)#3,261 |
| 64. | Beachwood | 0.20% | 0.097%(+0.098)#64 | 0.31%(-0.117)#3,317 |
| 65. | Wright Patterson Afb | 0.19% | 0.097%(+0.096)#65 | 0.31%(-0.119)#3,329 |
| 66. | Orrville | 0.19% | 0.097%(+0.096)#66 | 0.31%(-0.120)#3,334 |
| 67. | Oxford | 0.19% | 0.097%(+0.094)#67 | 0.31%(-0.122)#3,359 |
| 68. | Granville | 0.19% | 0.097%(+0.094)#68 | 0.31%(-0.122)#3,360 |
| 69. | New Albany | 0.19% | 0.097%(+0.093)#69 | 0.31%(-0.122)#3,363 |
| 70. | Fairview Park | 0.19% | 0.097%(+0.090)#70 | 0.31%(-0.126)#3,401 |
| 71. | Westerville | 0.19% | 0.097%(+0.088)#71 | 0.31%(-0.127)#3,414 |
| 72. | Tiffin | 0.18% | 0.097%(+0.088)#72 | 0.31%(-0.128)#3,418 |
| 73. | Sidney | 0.18% | 0.097%(+0.085)#73 | 0.31%(-0.131)#3,450 |
| 74. | Mayfield Heights | 0.17% | 0.097%(+0.077)#74 | 0.31%(-0.138)#3,522 |
| 75. | Cincinnati | 0.17% | 0.097%(+0.072)#75 | 0.31%(-0.144)#3,588 |
| 76. | St Marys | 0.17% | 0.097%(+0.071)#76 | 0.31%(-0.144)#3,592 |
| 77. | Lewisburg | 0.16% | 0.097%(+0.066)#77 | 0.31%(-0.149)#3,630 |
| 78. | Kirtland | 0.16% | 0.097%(+0.062)#78 | 0.31%(-0.153)#3,664 |
| 79. | Oakwood | 0.16% | 0.097%(+0.061)#79 | 0.31%(-0.154)#3,674 |
| 80. | West Carrollton | 0.15% | 0.097%(+0.056)#80 | 0.31%(-0.159)#3,727 |
| 81. | Reading | 0.15% | 0.097%(+0.055)#81 | 0.31%(-0.160)#3,743 |
| 82. | Clarktown | 0.15% | 0.097%(+0.054)#82 | 0.31%(-0.162)#3,761 |
| 83. | Bryan | 0.15% | 0.097%(+0.053)#83 | 0.31%(-0.162)#3,772 |
| 84. | Newtown | 0.15% | 0.097%(+0.052)#84 | 0.31%(-0.164)#3,787 |
| 85. | Reynoldsburg | 0.14% | 0.097%(+0.042)#85 | 0.31%(-0.173)#3,876 |
| 86. | Vermilion | 0.13% | 0.097%(+0.037)#86 | 0.31%(-0.179)#3,934 |
| 87. | Bowling Green | 0.13% | 0.097%(+0.036)#87 | 0.31%(-0.180)#3,941 |
| 88. | Elyria | 0.13% | 0.097%(+0.032)#88 | 0.31%(-0.184)#3,985 |
| 89. | North Royalton | 0.13% | 0.097%(+0.032)#89 | 0.31%(-0.184)#3,990 |
| 90. | Glouster | 0.13% | 0.097%(+0.031)#90 | 0.31%(-0.184)#3,992 |
| 91. | Oberlin | 0.12% | 0.097%(+0.025)#91 | 0.31%(-0.190)#4,079 |
| 92. | Uniontown | 0.12% | 0.097%(+0.018)#92 | 0.31%(-0.197)#4,154 |
| 93. | Delaware | 0.11% | 0.097%(+0.018)#93 | 0.31%(-0.198)#4,161 |
| 94. | Willowick | 0.11% | 0.097%(+0.016)#94 | 0.31%(-0.200)#4,177 |
| 95. | Franklin | 0.11% | 0.097%(+0.015)#95 | 0.31%(-0.201)#4,191 |
| 96. | Parma | 0.11% | 0.097%(+0.014)#96 | 0.31%(-0.202)#4,203 |
| 97. | Paulding | 0.11% | 0.097%(+0.013)#97 | 0.31%(-0.202)#4,210 |
| 98. | Lakewood | 0.10% | 0.097%(+0.006)#98 | 0.31%(-0.210)#4,289 |
| 99. | South Euclid | 0.10% | 0.097%(+0.004)#99 | 0.31%(-0.211)#4,312 |
| 100. | Vandalia | 0.099% | 0.097%(+0.002)#100 | 0.31%(-0.213)#4,332 |
Common Questions
What are the Top 10 Cities with the Highest Percentage of Immigrants from Korea in Ohio?
Top 10 Cities with the Highest Percentage of Immigrants from Korea in Ohio are:
#1
4.90%
#2
2.98%
#3
1.62%
#4
1.55%
#5
1.46%
#6
1.13%
#7
1.07%
#8
1.07%
#9
1.04%
#10
0.96%
What city has the Highest Percentage of Immigrants from Korea in Ohio?
Melrose has the Highest Percentage of Immigrants from Korea in Ohio with 4.90%.
What is the Percentage of Immigrants from Korea in the State of Ohio?
Percentage of Immigrants from Korea in Ohio is 0.097%.
What is the Percentage of Immigrants from Korea in the United States?
Percentage of Immigrants from Korea in the United States is 0.31%.