Cities with the Highest Percentage of Immigrants from Korea in Michigan
RELATED REPORTS & OPTIONS
Korea
Michigan
Compare Cities
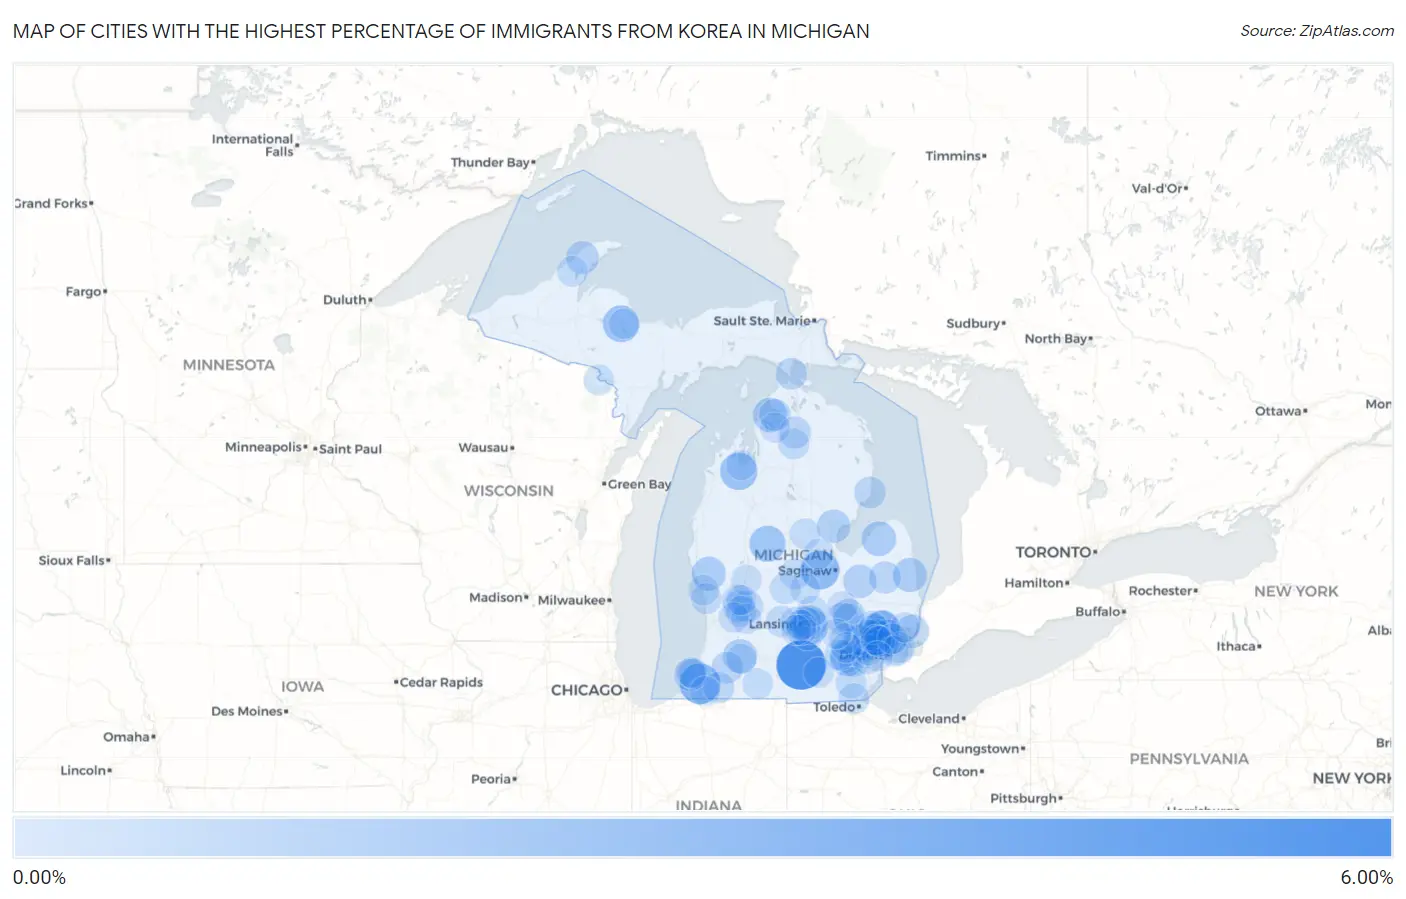
Map of Cities with the Highest Percentage of Immigrants from Korea in Michigan
0.00%
6.00%
Cities with the Highest Percentage of Immigrants from Korea in Michigan
| City | Korea | vs State | vs National | |
| 1. | Spring Arbor | 5.81% | 0.21%(+5.60)#1 | 0.31%(+5.50)#81 |
| 2. | Berrien Springs | 3.17% | 0.21%(+2.96)#2 | 0.31%(+2.85)#174 |
| 3. | Hemlock | 2.61% | 0.21%(+2.40)#3 | 0.31%(+2.30)#240 |
| 4. | Chums Corner | 2.17% | 0.21%(+1.96)#4 | 0.31%(+1.85)#317 |
| 5. | West Ishpeming | 1.99% | 0.21%(+1.78)#5 | 0.31%(+1.68)#353 |
| 6. | Barryton | 1.82% | 0.21%(+1.61)#6 | 0.31%(+1.51)#404 |
| 7. | Okemos | 1.79% | 0.21%(+1.58)#7 | 0.31%(+1.48)#408 |
| 8. | Troy | 1.71% | 0.21%(+1.51)#8 | 0.31%(+1.40)#434 |
| 9. | Rochester Hills | 1.66% | 0.21%(+1.45)#9 | 0.31%(+1.34)#456 |
| 10. | Novi | 1.44% | 0.21%(+1.23)#10 | 0.31%(+1.13)#547 |
| 11. | Birmingham | 1.38% | 0.21%(+1.18)#11 | 0.31%(+1.07)#576 |
| 12. | Ann Arbor | 1.38% | 0.21%(+1.17)#12 | 0.31%(+1.06)#582 |
| 13. | Rochester | 1.36% | 0.21%(+1.15)#13 | 0.31%(+1.04)#589 |
| 14. | Elkton | 1.34% | 0.21%(+1.13)#14 | 0.31%(+1.03)#600 |
| 15. | Bay Shore | 1.31% | 0.21%(+1.11)#15 | 0.31%(+1.00)#615 |
| 16. | Applegate | 1.29% | 0.21%(+1.08)#16 | 0.31%(+0.975)#637 |
| 17. | Westwood | 1.27% | 0.21%(+1.07)#17 | 0.31%(+0.962)#645 |
| 18. | Twin Lake | 1.27% | 0.21%(+1.07)#18 | 0.31%(+0.961)#646 |
| 19. | Haslett | 1.20% | 0.21%(+0.992)#19 | 0.31%(+0.887)#682 |
| 20. | Standish | 1.03% | 0.21%(+0.823)#20 | 0.31%(+0.719)#832 |
| 21. | Millington | 1.00% | 0.21%(+0.795)#21 | 0.31%(+0.690)#865 |
| 22. | Pearl Beach | 0.97% | 0.21%(+0.762)#22 | 0.31%(+0.657)#904 |
| 23. | Barton Hills | 0.90% | 0.21%(+0.693)#23 | 0.31%(+0.589)#989 |
| 24. | Copper City | 0.87% | 0.21%(+0.666)#24 | 0.31%(+0.561)#1,025 |
| 25. | Farmington | 0.81% | 0.21%(+0.602)#25 | 0.31%(+0.497)#1,113 |
| 26. | Lake Fenton | 0.73% | 0.21%(+0.521)#26 | 0.31%(+0.416)#1,225 |
| 27. | Argentine | 0.69% | 0.21%(+0.486)#27 | 0.31%(+0.381)#1,280 |
| 28. | Marlette | 0.67% | 0.21%(+0.460)#28 | 0.31%(+0.355)#1,323 |
| 29. | East Lansing | 0.67% | 0.21%(+0.460)#29 | 0.31%(+0.355)#1,325 |
| 30. | Bloomfield Hills | 0.66% | 0.21%(+0.451)#30 | 0.31%(+0.346)#1,342 |
| 31. | Shoreham | 0.65% | 0.21%(+0.444)#31 | 0.31%(+0.339)#1,365 |
| 32. | Petoskey | 0.61% | 0.21%(+0.407)#32 | 0.31%(+0.302)#1,442 |
| 33. | Vanderbilt | 0.61% | 0.21%(+0.398)#33 | 0.31%(+0.294)#1,461 |
| 34. | Madison Heights | 0.56% | 0.21%(+0.357)#34 | 0.31%(+0.252)#1,563 |
| 35. | Au Sable | 0.54% | 0.21%(+0.332)#35 | 0.31%(+0.228)#1,626 |
| 36. | St Ignace | 0.54% | 0.21%(+0.330)#36 | 0.31%(+0.225)#1,633 |
| 37. | Lawton | 0.54% | 0.21%(+0.327)#37 | 0.31%(+0.223)#1,642 |
| 38. | Forest Hills | 0.49% | 0.21%(+0.285)#38 | 0.31%(+0.180)#1,766 |
| 39. | Ypsilanti | 0.49% | 0.21%(+0.282)#39 | 0.31%(+0.178)#1,776 |
| 40. | Cassopolis | 0.46% | 0.21%(+0.250)#40 | 0.31%(+0.145)#1,896 |
| 41. | Grand Rapids | 0.45% | 0.21%(+0.245)#41 | 0.31%(+0.140)#1,913 |
| 42. | Farmington Hills | 0.42% | 0.21%(+0.210)#42 | 0.31%(+0.105)#2,054 |
| 43. | Wixom | 0.41% | 0.21%(+0.204)#43 | 0.31%(+0.099)#2,066 |
| 44. | Waverly | 0.40% | 0.21%(+0.193)#44 | 0.31%(+0.088)#2,121 |
| 45. | Dundee | 0.39% | 0.21%(+0.181)#45 | 0.31%(+0.076)#2,173 |
| 46. | Mulliken | 0.38% | 0.21%(+0.173)#46 | 0.31%(+0.069)#2,199 |
| 47. | Dexter | 0.38% | 0.21%(+0.170)#47 | 0.31%(+0.065)#2,216 |
| 48. | Sterling Heights | 0.37% | 0.21%(+0.162)#48 | 0.31%(+0.057)#2,248 |
| 49. | Lambertville | 0.37% | 0.21%(+0.158)#49 | 0.31%(+0.053)#2,258 |
| 50. | Gaylord | 0.35% | 0.21%(+0.144)#50 | 0.31%(+0.040)#2,314 |
| 51. | Lake Angelus | 0.35% | 0.21%(+0.141)#51 | 0.31%(+0.036)#2,331 |
| 52. | Fenton | 0.34% | 0.21%(+0.135)#52 | 0.31%(+0.030)#2,360 |
| 53. | Comstock Park | 0.34% | 0.21%(+0.130)#53 | 0.31%(+0.025)#2,381 |
| 54. | Brighton | 0.33% | 0.21%(+0.126)#54 | 0.31%(+0.022)#2,404 |
| 55. | Mason | 0.33% | 0.21%(+0.118)#55 | 0.31%(+0.014)#2,444 |
| 56. | Houghton | 0.33% | 0.21%(+0.118)#56 | 0.31%(+0.013)#2,449 |
| 57. | Alma | 0.32% | 0.21%(+0.110)#57 | 0.31%(+0.006)#2,495 |
| 58. | Kentwood | 0.32% | 0.21%(+0.109)#58 | 0.31%(+0.004)#2,506 |
| 59. | Laingsburg | 0.32% | 0.21%(+0.108)#59 | 0.31%(+0.003)#2,509 |
| 60. | Wayne | 0.31% | 0.21%(+0.105)#60 | 0.31%(+0.001)#2,524 |
| 61. | Grand Haven | 0.30% | 0.21%(+0.093)#61 | 0.31%(-0.011)#2,586 |
| 62. | Carson City | 0.30% | 0.21%(+0.091)#62 | 0.31%(-0.014)#2,608 |
| 63. | Colon | 0.29% | 0.21%(+0.080)#63 | 0.31%(-0.025)#2,661 |
| 64. | Norton Shores | 0.28% | 0.21%(+0.073)#64 | 0.31%(-0.032)#2,705 |
| 65. | Ferndale | 0.28% | 0.21%(+0.067)#65 | 0.31%(-0.037)#2,737 |
| 66. | Kingsford | 0.27% | 0.21%(+0.065)#66 | 0.31%(-0.039)#2,749 |
| 67. | Livonia | 0.27% | 0.21%(+0.062)#67 | 0.31%(-0.043)#2,774 |
| 68. | Orchard Lake Village | 0.26% | 0.21%(+0.049)#68 | 0.31%(-0.056)#2,866 |
| 69. | Auburn Hills | 0.25% | 0.21%(+0.044)#69 | 0.31%(-0.060)#2,887 |
| 70. | Beaverton | 0.25% | 0.21%(+0.044)#70 | 0.31%(-0.061)#2,895 |
| 71. | Royal Oak | 0.25% | 0.21%(+0.042)#71 | 0.31%(-0.063)#2,906 |
| 72. | Berkley | 0.24% | 0.21%(+0.037)#72 | 0.31%(-0.068)#2,950 |
| 73. | Whitmore Lake | 0.24% | 0.21%(+0.033)#73 | 0.31%(-0.072)#2,981 |
| 74. | Grosse Pointe Farms | 0.24% | 0.21%(+0.032)#74 | 0.31%(-0.073)#2,986 |
| 75. | Village Of Grosse Pointe Shores | 0.23% | 0.21%(+0.022)#75 | 0.31%(-0.082)#3,057 |
| 76. | Caledonia | 0.22% | 0.21%(+0.014)#76 | 0.31%(-0.091)#3,110 |
| 77. | Fair Plain | 0.22% | 0.21%(+0.010)#77 | 0.31%(-0.094)#3,142 |
| 78. | Brooklyn | 0.21% | 0.21%(+0.004)#78 | 0.31%(-0.100)#3,192 |
| 79. | Ashley | 0.21% | 0.21%(+0.003)#79 | 0.31%(-0.102)#3,207 |
| 80. | Holt | 0.21% | 0.21%(+0.001)#80 | 0.31%(-0.104)#3,214 |
| 81. | St Joseph | 0.20% | 0.21%(-0.004)#81 | 0.31%(-0.109)#3,254 |
| 82. | Sand Lake | 0.20% | 0.21%(-0.004)#82 | 0.31%(-0.109)#3,256 |
| 83. | Lansing | 0.20% | 0.21%(-0.005)#83 | 0.31%(-0.110)#3,263 |
| 84. | Grosse Pointe Park | 0.20% | 0.21%(-0.008)#84 | 0.31%(-0.113)#3,286 |
| 85. | Ishpeming | 0.19% | 0.21%(-0.014)#85 | 0.31%(-0.119)#3,323 |
| 86. | Beverly Hills | 0.19% | 0.21%(-0.018)#86 | 0.31%(-0.123)#3,371 |
| 87. | Kalamazoo | 0.19% | 0.21%(-0.018)#87 | 0.31%(-0.123)#3,373 |
| 88. | Swartz Creek | 0.19% | 0.21%(-0.020)#88 | 0.31%(-0.125)#3,393 |
| 89. | Dimondale | 0.19% | 0.21%(-0.022)#89 | 0.31%(-0.127)#3,409 |
| 90. | Fraser | 0.18% | 0.21%(-0.024)#90 | 0.31%(-0.128)#3,422 |
| 91. | Midland | 0.18% | 0.21%(-0.024)#91 | 0.31%(-0.128)#3,424 |
| 92. | Dearborn | 0.18% | 0.21%(-0.031)#92 | 0.31%(-0.136)#3,498 |
| 93. | Byron Center | 0.17% | 0.21%(-0.036)#93 | 0.31%(-0.141)#3,541 |
| 94. | Northview | 0.17% | 0.21%(-0.039)#94 | 0.31%(-0.144)#3,587 |
| 95. | Kincheloe | 0.15% | 0.21%(-0.056)#95 | 0.31%(-0.160)#3,744 |
| 96. | New Baltimore | 0.15% | 0.21%(-0.059)#96 | 0.31%(-0.164)#3,784 |
| 97. | Traverse City | 0.15% | 0.21%(-0.059)#97 | 0.31%(-0.164)#3,786 |
| 98. | Niles | 0.14% | 0.21%(-0.064)#98 | 0.31%(-0.169)#3,829 |
| 99. | Howell | 0.14% | 0.21%(-0.069)#99 | 0.31%(-0.173)#3,881 |
| 100. | Boyne City | 0.13% | 0.21%(-0.077)#100 | 0.31%(-0.182)#3,959 |
Common Questions
What are the Top 10 Cities with the Highest Percentage of Immigrants from Korea in Michigan?
Top 10 Cities with the Highest Percentage of Immigrants from Korea in Michigan are:
#1
5.81%
#2
3.17%
#3
2.61%
#4
2.17%
#5
1.99%
#6
1.82%
#7
1.79%
#8
1.71%
#9
1.66%
#10
1.44%
What city has the Highest Percentage of Immigrants from Korea in Michigan?
Spring Arbor has the Highest Percentage of Immigrants from Korea in Michigan with 5.81%.
What is the Percentage of Immigrants from Korea in the State of Michigan?
Percentage of Immigrants from Korea in Michigan is 0.21%.
What is the Percentage of Immigrants from Korea in the United States?
Percentage of Immigrants from Korea in the United States is 0.31%.