Cities with the Highest Percentage of Immigrants from Italy in Michigan
RELATED REPORTS & OPTIONS
Italy
Michigan
Compare Cities
Map of Cities with the Highest Percentage of Immigrants from Italy in Michigan
0.00%
2.50%
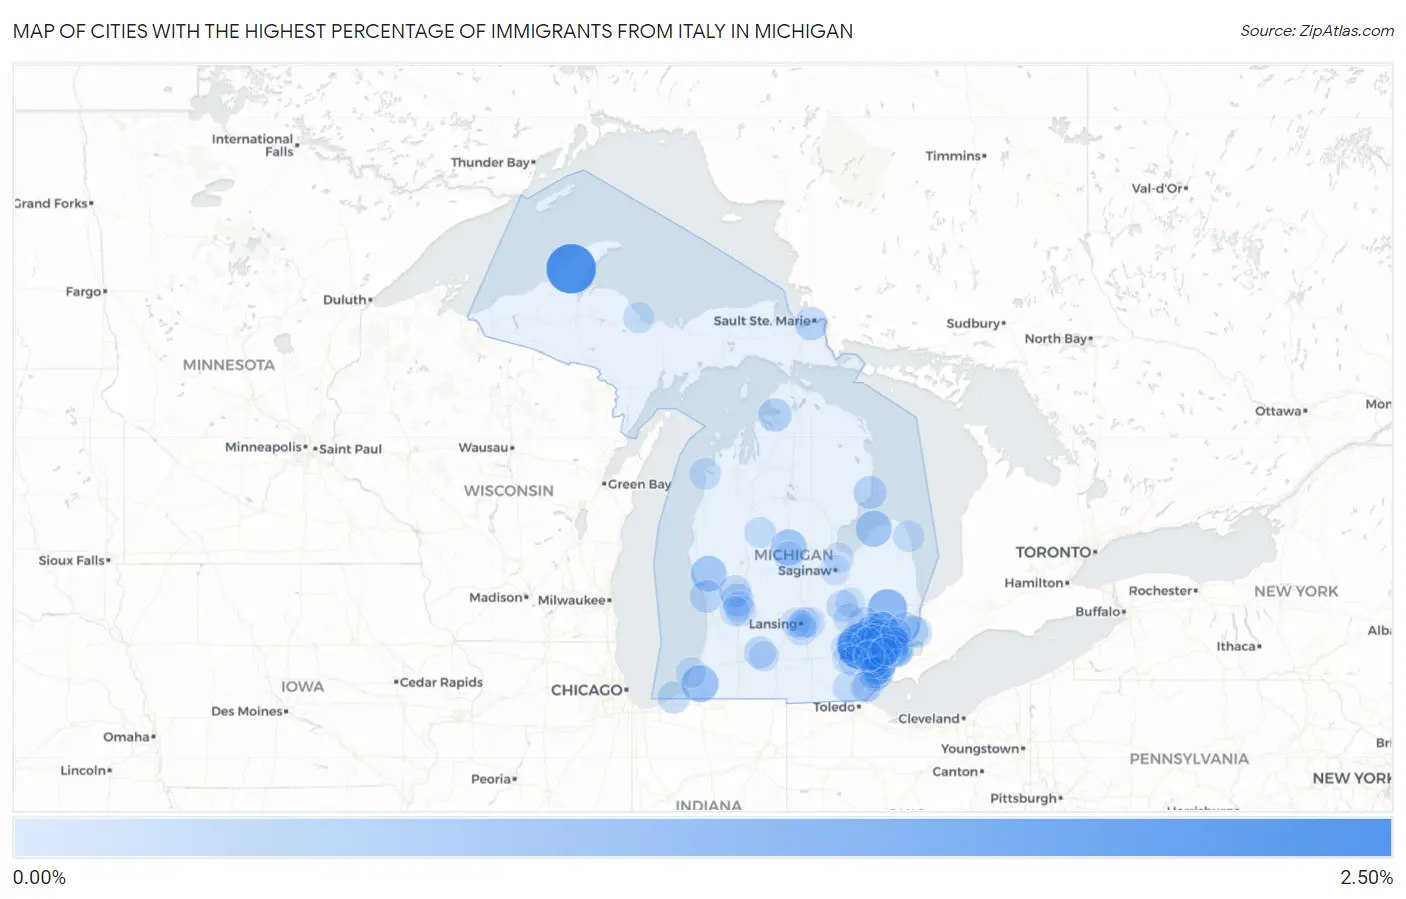
Cities with the Highest Percentage of Immigrants from Italy in Michigan
| City | Italy | vs State | vs National | |
| 1. | Hancock | 2.45% | 0.077%(+2.38)#1 | 0.095%(+2.36)#78 |
| 2. | Northville | 2.10% | 0.077%(+2.03)#2 | 0.095%(+2.01)#112 |
| 3. | Almont | 1.13% | 0.077%(+1.05)#3 | 0.095%(+1.04)#285 |
| 4. | Berrien Springs | 0.84% | 0.077%(+0.763)#4 | 0.095%(+0.746)#429 |
| 5. | Caseville | 0.74% | 0.077%(+0.664)#5 | 0.095%(+0.647)#508 |
| 6. | Rosebush | 0.74% | 0.077%(+0.661)#6 | 0.095%(+0.644)#513 |
| 7. | Southgate | 0.70% | 0.077%(+0.624)#7 | 0.095%(+0.607)#556 |
| 8. | Twin Lake | 0.69% | 0.077%(+0.612)#8 | 0.095%(+0.595)#570 |
| 9. | Rochester Hills | 0.54% | 0.077%(+0.463)#9 | 0.095%(+0.446)#740 |
| 10. | Grosse Pointe Woods | 0.46% | 0.077%(+0.382)#10 | 0.095%(+0.365)#878 |
| 11. | Grosse Pointe | 0.44% | 0.077%(+0.367)#11 | 0.095%(+0.350)#909 |
| 12. | Farmington | 0.44% | 0.077%(+0.367)#12 | 0.095%(+0.350)#913 |
| 13. | Petoskey | 0.39% | 0.077%(+0.315)#13 | 0.095%(+0.298)#1,007 |
| 14. | Village Of Clarkston | 0.39% | 0.077%(+0.310)#14 | 0.095%(+0.293)#1,022 |
| 15. | Allen Park | 0.38% | 0.077%(+0.306)#15 | 0.095%(+0.289)#1,032 |
| 16. | Sault Ste Marie | 0.38% | 0.077%(+0.303)#16 | 0.095%(+0.286)#1,047 |
| 17. | Au Sable | 0.36% | 0.077%(+0.282)#17 | 0.095%(+0.265)#1,089 |
| 18. | Sterling Heights | 0.35% | 0.077%(+0.276)#18 | 0.095%(+0.259)#1,107 |
| 19. | Walled Lake | 0.34% | 0.077%(+0.267)#19 | 0.095%(+0.250)#1,136 |
| 20. | Bloomfield Hills | 0.34% | 0.077%(+0.263)#20 | 0.095%(+0.246)#1,148 |
| 21. | Ferrysburg | 0.34% | 0.077%(+0.260)#21 | 0.095%(+0.243)#1,157 |
| 22. | Novi | 0.33% | 0.077%(+0.255)#22 | 0.095%(+0.238)#1,177 |
| 23. | South Lyon | 0.33% | 0.077%(+0.253)#23 | 0.095%(+0.236)#1,178 |
| 24. | Gibraltar | 0.32% | 0.077%(+0.246)#24 | 0.095%(+0.229)#1,205 |
| 25. | Birmingham | 0.32% | 0.077%(+0.245)#25 | 0.095%(+0.228)#1,212 |
| 26. | Grosse Pointe Farms | 0.32% | 0.077%(+0.242)#26 | 0.095%(+0.225)#1,220 |
| 27. | Plymouth | 0.29% | 0.077%(+0.213)#27 | 0.095%(+0.196)#1,332 |
| 28. | Comstock Park | 0.28% | 0.077%(+0.202)#28 | 0.095%(+0.185)#1,368 |
| 29. | Grand Beach | 0.27% | 0.077%(+0.188)#29 | 0.095%(+0.171)#1,429 |
| 30. | Livonia | 0.26% | 0.077%(+0.183)#30 | 0.095%(+0.166)#1,459 |
| 31. | Rockwood | 0.25% | 0.077%(+0.170)#31 | 0.095%(+0.153)#1,499 |
| 32. | Level Park Oak Park | 0.24% | 0.077%(+0.160)#32 | 0.095%(+0.143)#1,546 |
| 33. | Sparta | 0.24% | 0.077%(+0.158)#33 | 0.095%(+0.141)#1,558 |
| 34. | Sylvan Lake | 0.23% | 0.077%(+0.154)#34 | 0.095%(+0.137)#1,578 |
| 35. | Auburn Hills | 0.22% | 0.077%(+0.146)#35 | 0.095%(+0.129)#1,610 |
| 36. | Eastpointe | 0.22% | 0.077%(+0.143)#36 | 0.095%(+0.126)#1,628 |
| 37. | Trenton | 0.22% | 0.077%(+0.140)#37 | 0.095%(+0.123)#1,644 |
| 38. | Algonac | 0.22% | 0.077%(+0.139)#38 | 0.095%(+0.121)#1,651 |
| 39. | Swartz Creek | 0.20% | 0.077%(+0.127)#39 | 0.095%(+0.110)#1,721 |
| 40. | Beverly Hills | 0.20% | 0.077%(+0.122)#40 | 0.095%(+0.105)#1,759 |
| 41. | Fraser | 0.20% | 0.077%(+0.120)#41 | 0.095%(+0.103)#1,770 |
| 42. | Pearl Beach | 0.19% | 0.077%(+0.116)#42 | 0.095%(+0.099)#1,796 |
| 43. | Frankfort | 0.18% | 0.077%(+0.104)#43 | 0.095%(+0.087)#1,869 |
| 44. | Troy | 0.18% | 0.077%(+0.099)#44 | 0.095%(+0.082)#1,899 |
| 45. | Petersburg | 0.17% | 0.077%(+0.097)#45 | 0.095%(+0.080)#1,909 |
| 46. | Harbor Beach | 0.17% | 0.077%(+0.095)#46 | 0.095%(+0.078)#1,917 |
| 47. | Dearborn Heights | 0.17% | 0.077%(+0.094)#47 | 0.095%(+0.077)#1,925 |
| 48. | Warren | 0.16% | 0.077%(+0.085)#48 | 0.095%(+0.068)#1,994 |
| 49. | Rochester | 0.15% | 0.077%(+0.077)#49 | 0.095%(+0.060)#2,029 |
| 50. | Dearborn | 0.15% | 0.077%(+0.074)#50 | 0.095%(+0.057)#2,046 |
| 51. | St Clair Shores | 0.14% | 0.077%(+0.062)#51 | 0.095%(+0.045)#2,117 |
| 52. | Wixom | 0.14% | 0.077%(+0.058)#52 | 0.095%(+0.041)#2,147 |
| 53. | Roseville | 0.13% | 0.077%(+0.055)#53 | 0.095%(+0.038)#2,170 |
| 54. | Melvindale | 0.13% | 0.077%(+0.049)#54 | 0.095%(+0.032)#2,230 |
| 55. | Harper Woods | 0.12% | 0.077%(+0.047)#55 | 0.095%(+0.030)#2,255 |
| 56. | Holt | 0.12% | 0.077%(+0.041)#56 | 0.095%(+0.024)#2,311 |
| 57. | Evart | 0.12% | 0.077%(+0.038)#57 | 0.095%(+0.020)#2,335 |
| 58. | Franklin | 0.11% | 0.077%(+0.036)#58 | 0.095%(+0.019)#2,352 |
| 59. | Marquette | 0.11% | 0.077%(+0.029)#59 | 0.095%(+0.012)#2,400 |
| 60. | Flat Rock | 0.11% | 0.077%(+0.028)#60 | 0.095%(+0.011)#2,406 |
| 61. | Haslett | 0.100% | 0.077%(+0.022)#61 | 0.095%(+0.005)#2,457 |
| 62. | Fenton | 0.092% | 0.077%(+0.014)#62 | 0.095%(-0.003)#2,517 |
| 63. | New Baltimore | 0.091% | 0.077%(+0.013)#63 | 0.095%(-0.004)#2,532 |
| 64. | St Joseph | 0.089% | 0.077%(+0.012)#64 | 0.095%(-0.005)#2,551 |
| 65. | Whitmore Lake | 0.088% | 0.077%(+0.011)#65 | 0.095%(-0.006)#2,557 |
| 66. | Woodhaven | 0.085% | 0.077%(+0.008)#66 | 0.095%(-0.009)#2,582 |
| 67. | Wyandotte | 0.084% | 0.077%(+0.007)#67 | 0.095%(-0.010)#2,593 |
| 68. | Grosse Pointe Park | 0.078% | 0.077%(+0.001)#68 | 0.095%(-0.016)#2,656 |
| 69. | Monroe | 0.074% | 0.077%(-0.004)#69 | 0.095%(-0.021)#2,712 |
| 70. | East Lansing | 0.070% | 0.077%(-0.007)#70 | 0.095%(-0.024)#2,748 |
| 71. | Taylor | 0.068% | 0.077%(-0.009)#71 | 0.095%(-0.026)#2,773 |
| 72. | Kentwood | 0.059% | 0.077%(-0.018)#72 | 0.095%(-0.035)#2,880 |
| 73. | Royal Oak | 0.057% | 0.077%(-0.021)#73 | 0.095%(-0.038)#2,915 |
| 74. | Ann Arbor | 0.052% | 0.077%(-0.026)#74 | 0.095%(-0.043)#2,974 |
| 75. | Garden City | 0.051% | 0.077%(-0.026)#75 | 0.095%(-0.043)#2,976 |
| 76. | Battle Creek | 0.046% | 0.077%(-0.032)#76 | 0.095%(-0.049)#3,040 |
| 77. | South Monroe | 0.045% | 0.077%(-0.032)#77 | 0.095%(-0.049)#3,052 |
| 78. | Mount Clemens | 0.045% | 0.077%(-0.033)#78 | 0.095%(-0.050)#3,060 |
| 79. | Waverly | 0.038% | 0.077%(-0.040)#79 | 0.095%(-0.057)#3,139 |
| 80. | Grand Rapids | 0.037% | 0.077%(-0.041)#80 | 0.095%(-0.058)#3,159 |
| 81. | Farmington Hills | 0.034% | 0.077%(-0.044)#81 | 0.095%(-0.061)#3,216 |
| 82. | Hamtramck | 0.032% | 0.077%(-0.045)#82 | 0.095%(-0.062)#3,229 |
| 83. | Bay City | 0.031% | 0.077%(-0.047)#83 | 0.095%(-0.064)#3,254 |
| 84. | Ypsilanti | 0.030% | 0.077%(-0.048)#84 | 0.095%(-0.065)#3,267 |
| 85. | Wyoming | 0.021% | 0.077%(-0.057)#85 | 0.095%(-0.074)#3,396 |
| 86. | Mount Pleasant | 0.018% | 0.077%(-0.059)#86 | 0.095%(-0.076)#3,436 |
| 87. | Saginaw | 0.018% | 0.077%(-0.059)#87 | 0.095%(-0.076)#3,438 |
| 88. | Westland | 0.012% | 0.077%(-0.066)#88 | 0.095%(-0.083)#3,520 |
| 89. | Detroit | 0.0086% | 0.077%(-0.069)#89 | 0.095%(-0.086)#3,558 |
| 90. | Lansing | 0.0062% | 0.077%(-0.071)#90 | 0.095%(-0.088)#3,591 |
| 91. | Flint | 0.0049% | 0.077%(-0.073)#91 | 0.095%(-0.090)#3,605 |
Common Questions
What are the Top 10 Cities with the Highest Percentage of Immigrants from Italy in Michigan?
Top 10 Cities with the Highest Percentage of Immigrants from Italy in Michigan are:
#1
2.45%
#2
2.10%
#3
1.13%
#4
0.84%
#5
0.74%
#6
0.74%
#7
0.70%
#8
0.69%
#9
0.54%
#10
0.46%
What city has the Highest Percentage of Immigrants from Italy in Michigan?
Hancock has the Highest Percentage of Immigrants from Italy in Michigan with 2.45%.
What is the Percentage of Immigrants from Italy in the State of Michigan?
Percentage of Immigrants from Italy in Michigan is 0.077%.
What is the Percentage of Immigrants from Italy in the United States?
Percentage of Immigrants from Italy in the United States is 0.095%.